✍️ January New Money Flows = The Biggest Market Structure Dynamic!
January inflows coming to town, new allocations are key for investors ...
Dear all,
First of all, I wish you a great 2023 with accomplishments on all sides!
It is January, time to refresh, restart and a great time for a forward looking perspective. Specifically, January is a key month for asset allocations and related money flows dynamics that come with each start of the new year.
Report is not behind a paywall & there are no pesky ads here. It would be highly appreciated if you just spread the word around to people that might also be interested.
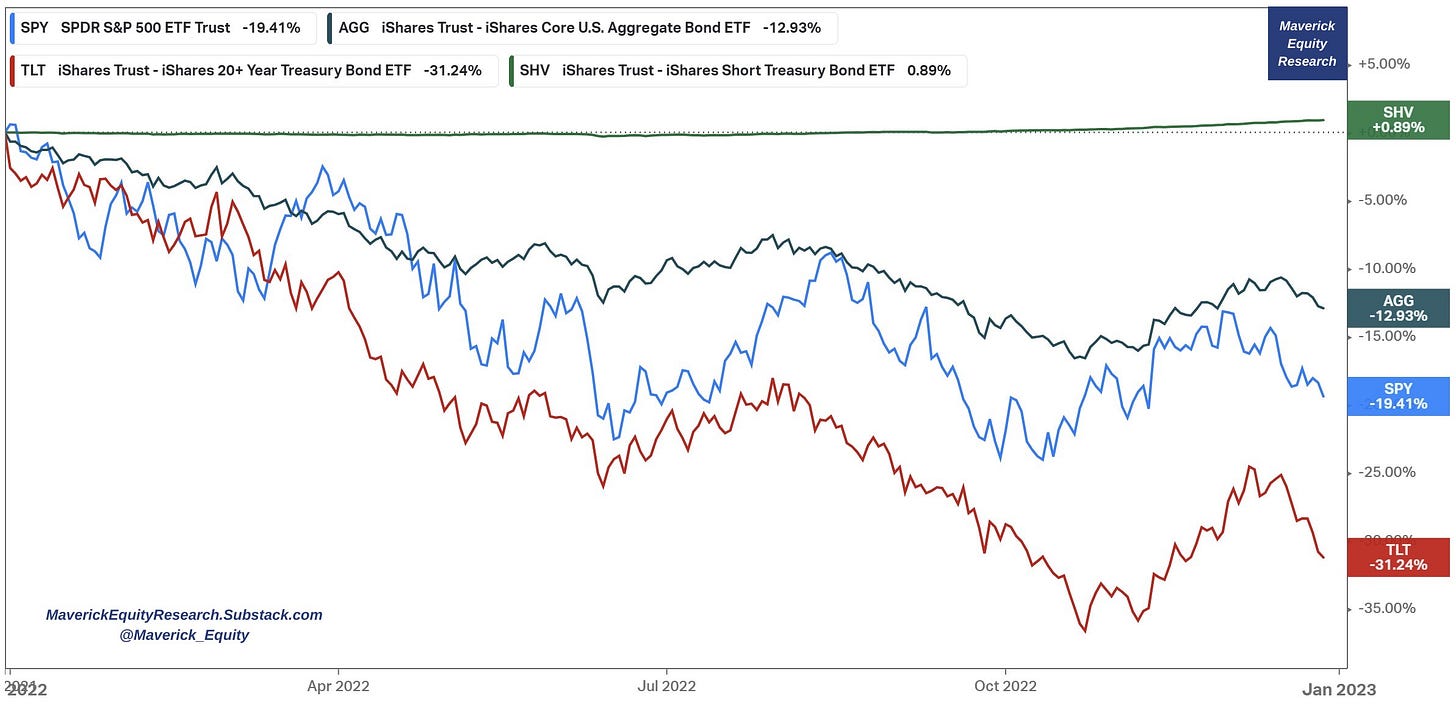
First of all, where do we stand? 2022 review in one chart: S&P 500 SPY down -19.41% while bonds down as well but not all equal: TLT (20-year+) pain with -31.24% AGG (US IG: treasuries, corporate, MBS, ABS, municipalities) just -12.93% while SHV (1-year/less maturities) even with 2022 ramping inflation & interest rates a remarkable positive +0.89%
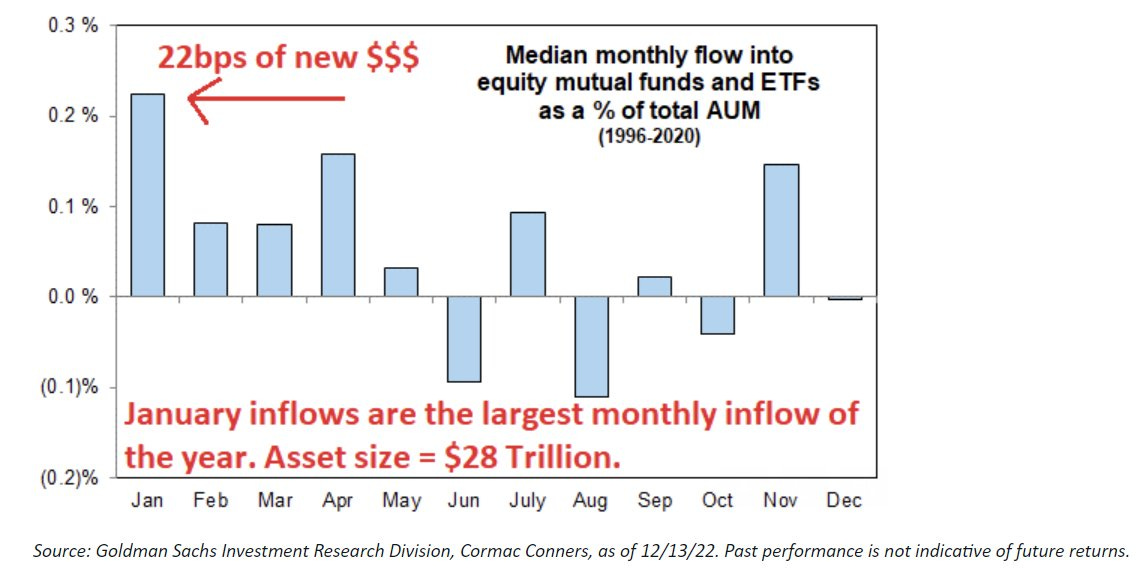
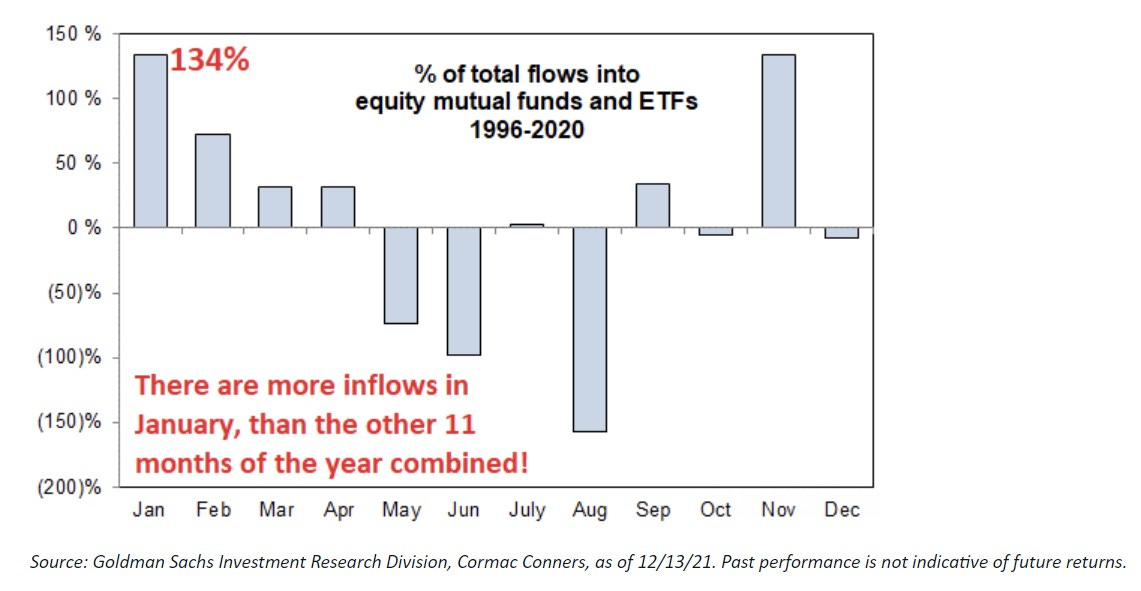
In January each year new money is allocated across asset classes, big portfolios are rebalanced, new IRA & 401k contributions are coming to town. Therefore, January is the biggest market structure dynamic.
Specifically:
22bps of new money (not including money leaving bonds/cash) comes into the market every January which is about $62 billion of new money!
January inflows are more than the other 11 months of the year combined!
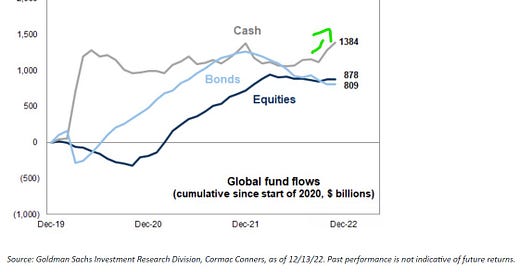
A 1st key question: is there dry powder cash sitting on the sidelines? Yes! Actually, it has been the money flow winner in 2022! Does any of that Cash come back into and go into stocks & bonds? It should: inflation is burning cash in stealth mode and reduces purchasing power … time value of money 101.
Now a 2nd key question, where does the new money go in January? Chart from Ben Snider via Goldman Sachs is very important. This would be different than we are used to. New money goes into the laggards and this is what everyone is asking today. Factor seasonality in January since 1980 with the median & average returns: valuation (low vs high), Growth (high vs low) & Size (small vs large) to be watched as favorites:
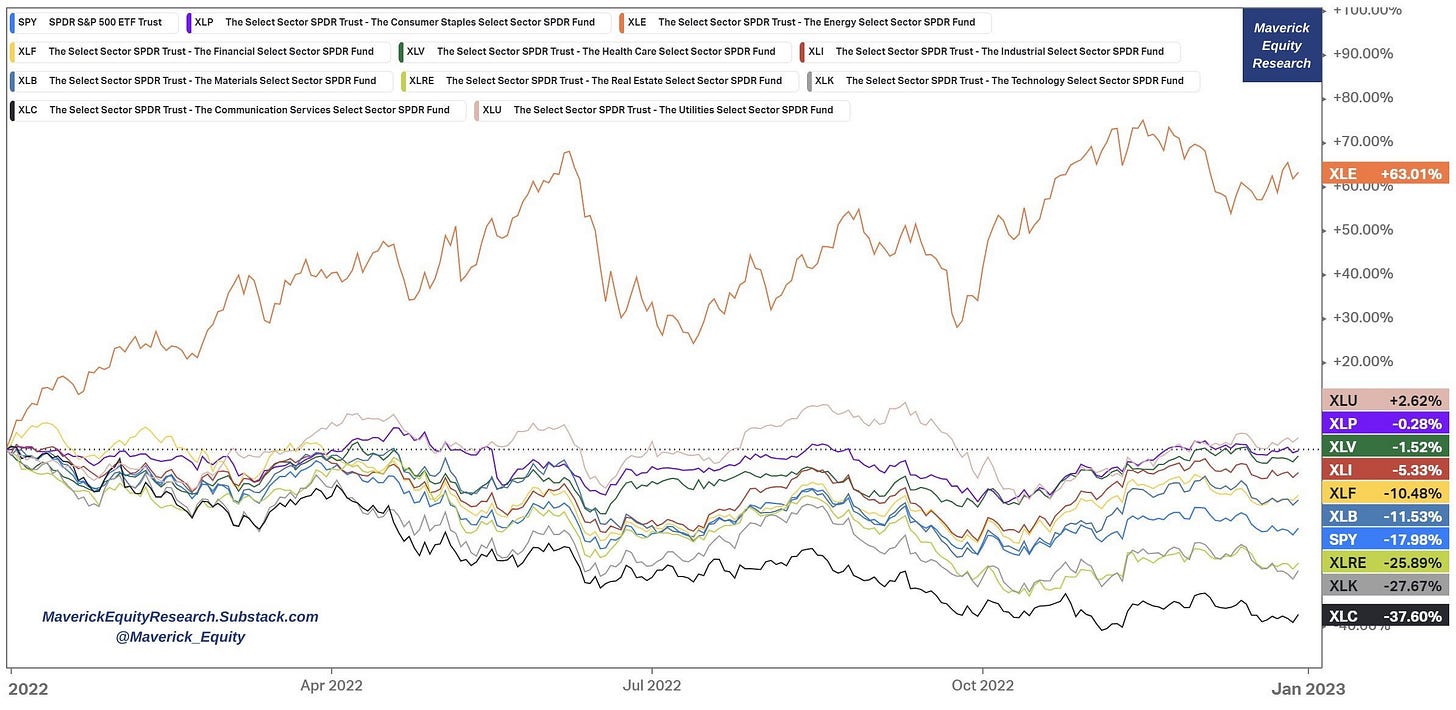
Now first, let’s check the S&P 500 2022 Sector laggards. XLC Communications, XLK Technology and XLRE Real Estate were the top laggards in 2022, a year when XLE Energy lead by far and together with XLU Utilities were the only 2 positive sectors:
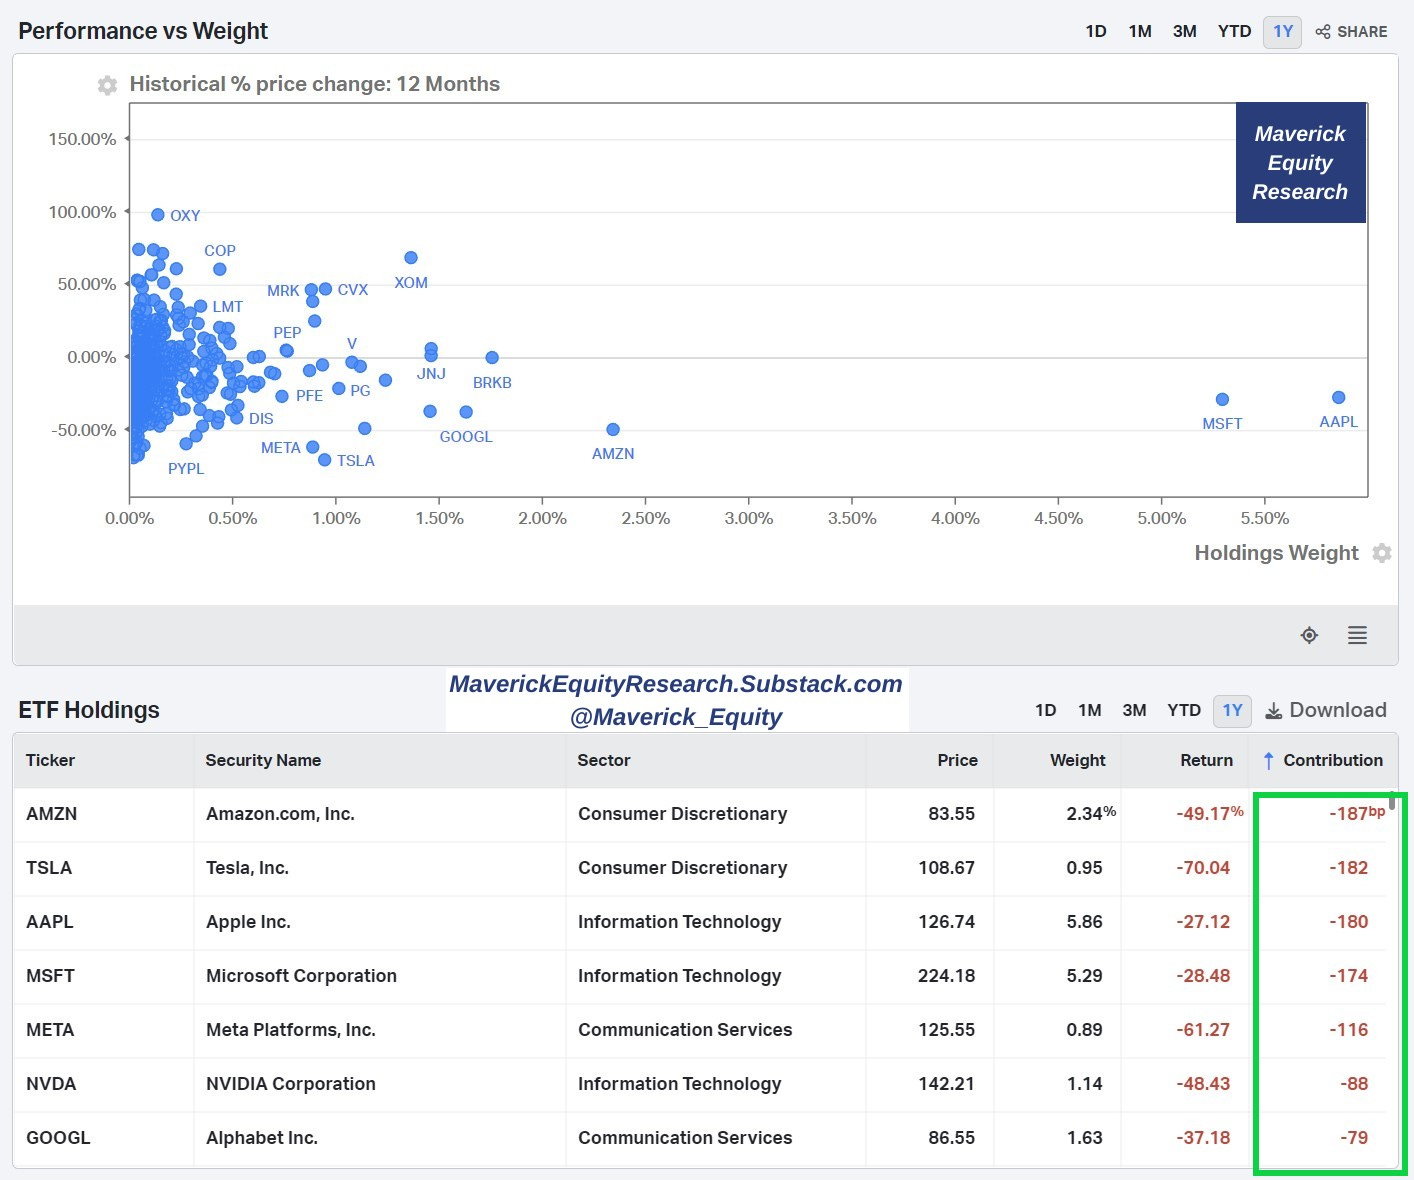
Let’s go even more granular from the Sector level to the single S&P 500 laggards. The S&P 500 ended the year a bit below 20% but note the top laggards in terms of overall contribution: more than half (-10.06% / 1,006 basis points) was due to just 7 Big Tech stocks: Tesla, Meta/Facebook, Apple, Microsoft, Nvidia, Amazon and Google.
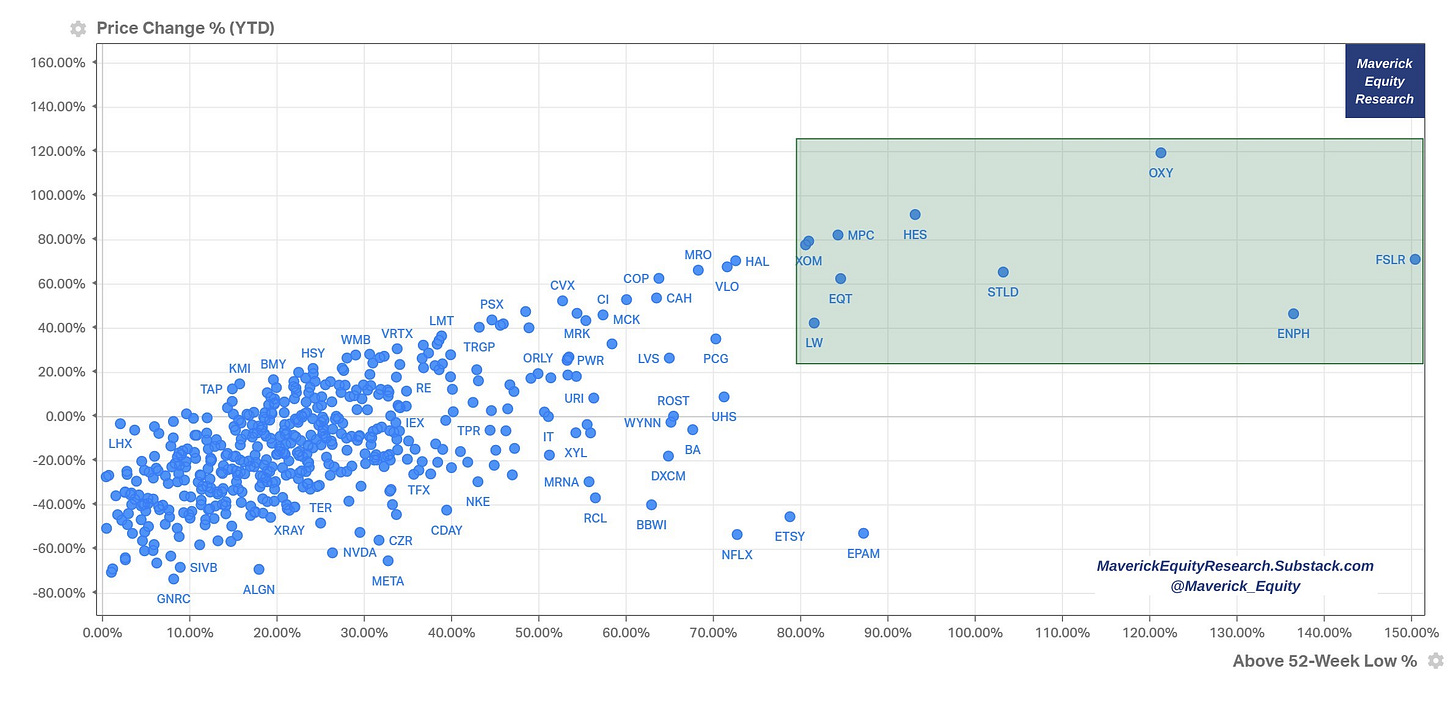
And now let’s see below both winners and laggards via a price scatterplot view with the Return % YTD '&' Above 52-week Low % with the overall note: 135 stocks ended the year positive, 365 negative with 198 of those having a return of -20% or more. 121 stocks had a return worse than -30% (~24% of the index). 26 stocks had a return worse than -50% (~5% of the index).
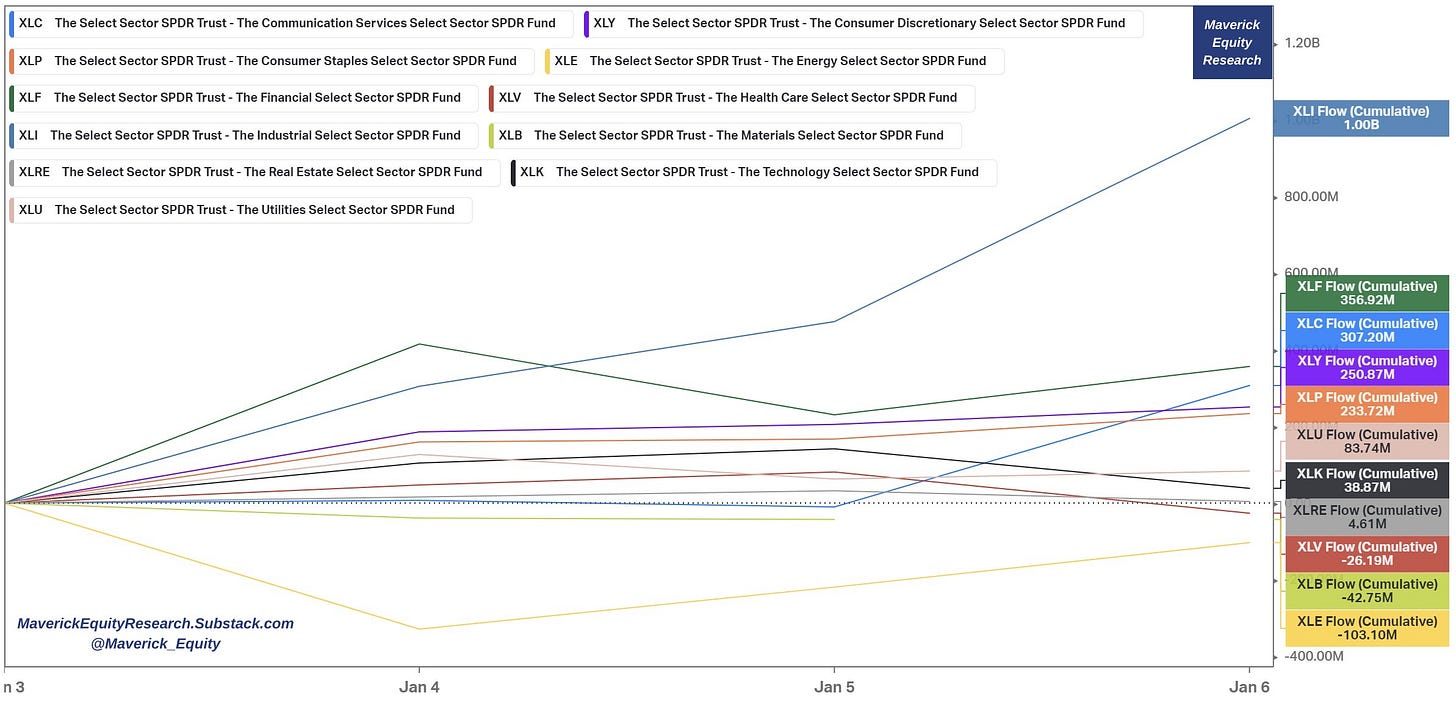
Time to look now at 2023 flows in the 11 Sectors from the S&P 500: XLE Energy the leader in 2022, now with the biggest negative flows. XLC Communications the top laggard in 2022, now Top 3 with 307m inflows. XLI with the biggest inflows after in 2022 a laggard as well. Overall, mostly positive flows coming to town.
Performance wise we are already seeing that in the 1st week of 2023: XLC Communication Services (2022 laggard) leading with +5% the S&P 500 sectors and just XLV Health Care close to nothing down:
How did bonds, specifically non-investment (‘junk bonds’) do in the new year flows wise? Biggest weekly inflow since 2020 for the iShares Junk Bonds ETF (HYG):
Zooming out to global stocks, they gained $1.8tn in market cap for a good start in 2023:
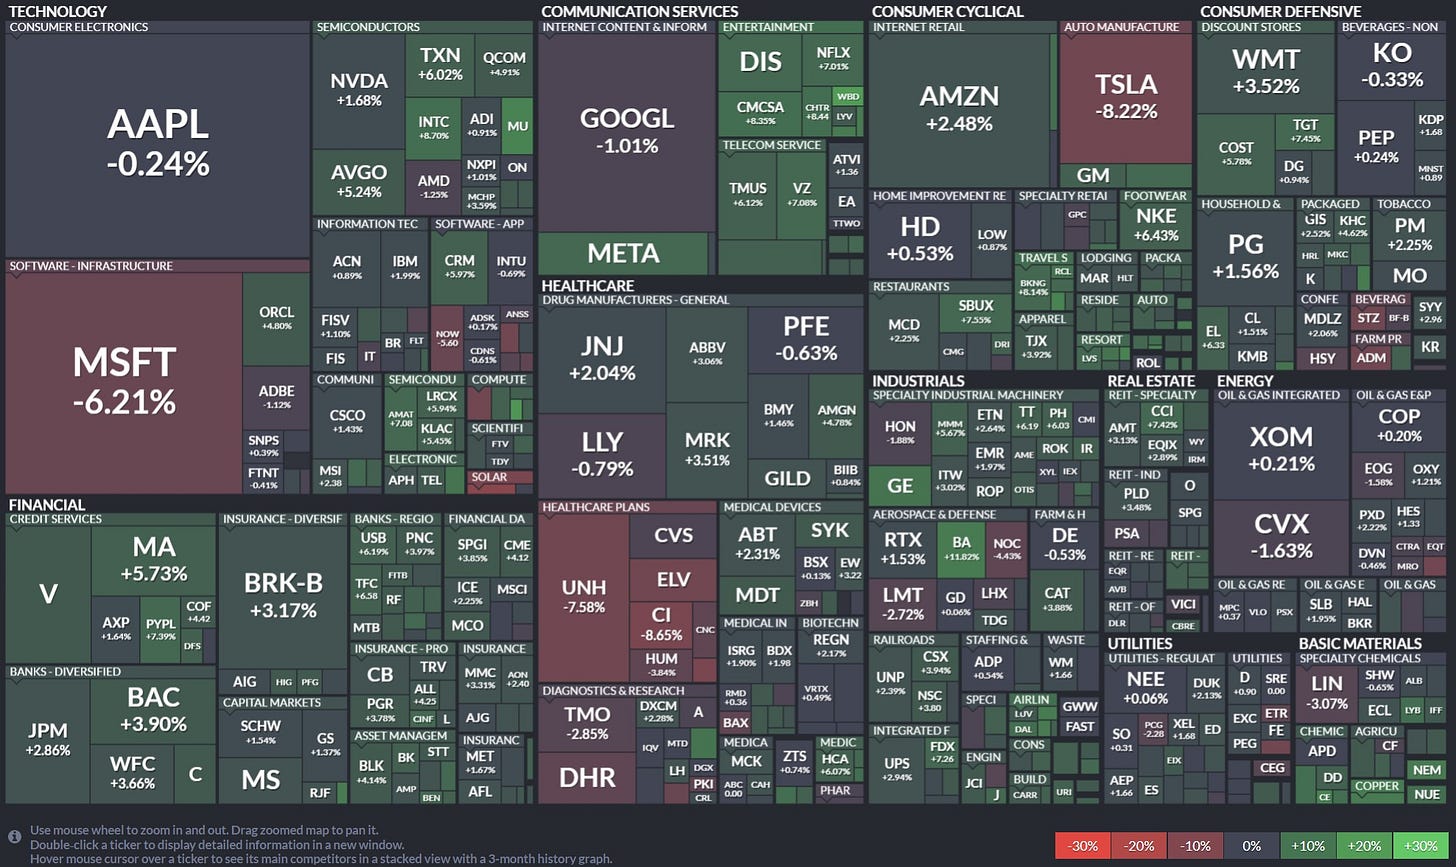
Going more granular, S&P 500 heatmap to see the latest action into single names:
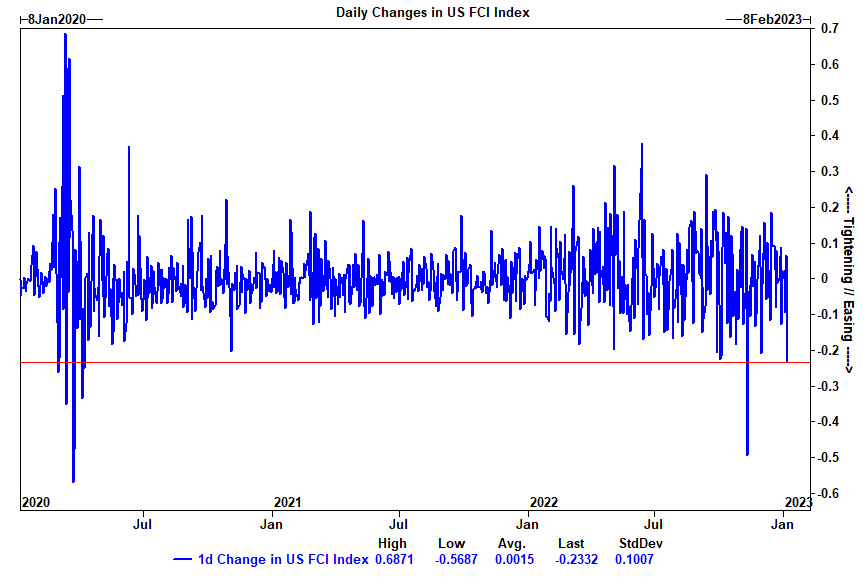
Goldman’s US Financial Conditions Index (GS US FCI) recorded a big easing last Friday after positive economic data came out and helps a lot the start in 2023. Outside of the November CPI day, Friday's FCI easing was the largest since April of 2020. Essentially, the market sees a slowdown in FED’s pace or rate hikes in 2023+.
For a complementary view, let’s plot now the GS US FCI & the FED funds rate: after the FED hiked interest rates in one of the most aggressive ways in recent history, financial conditions have continued to loosen indicating that the market believes ‘peak FED’ is priced in and we are going looser from here, sooner or later:
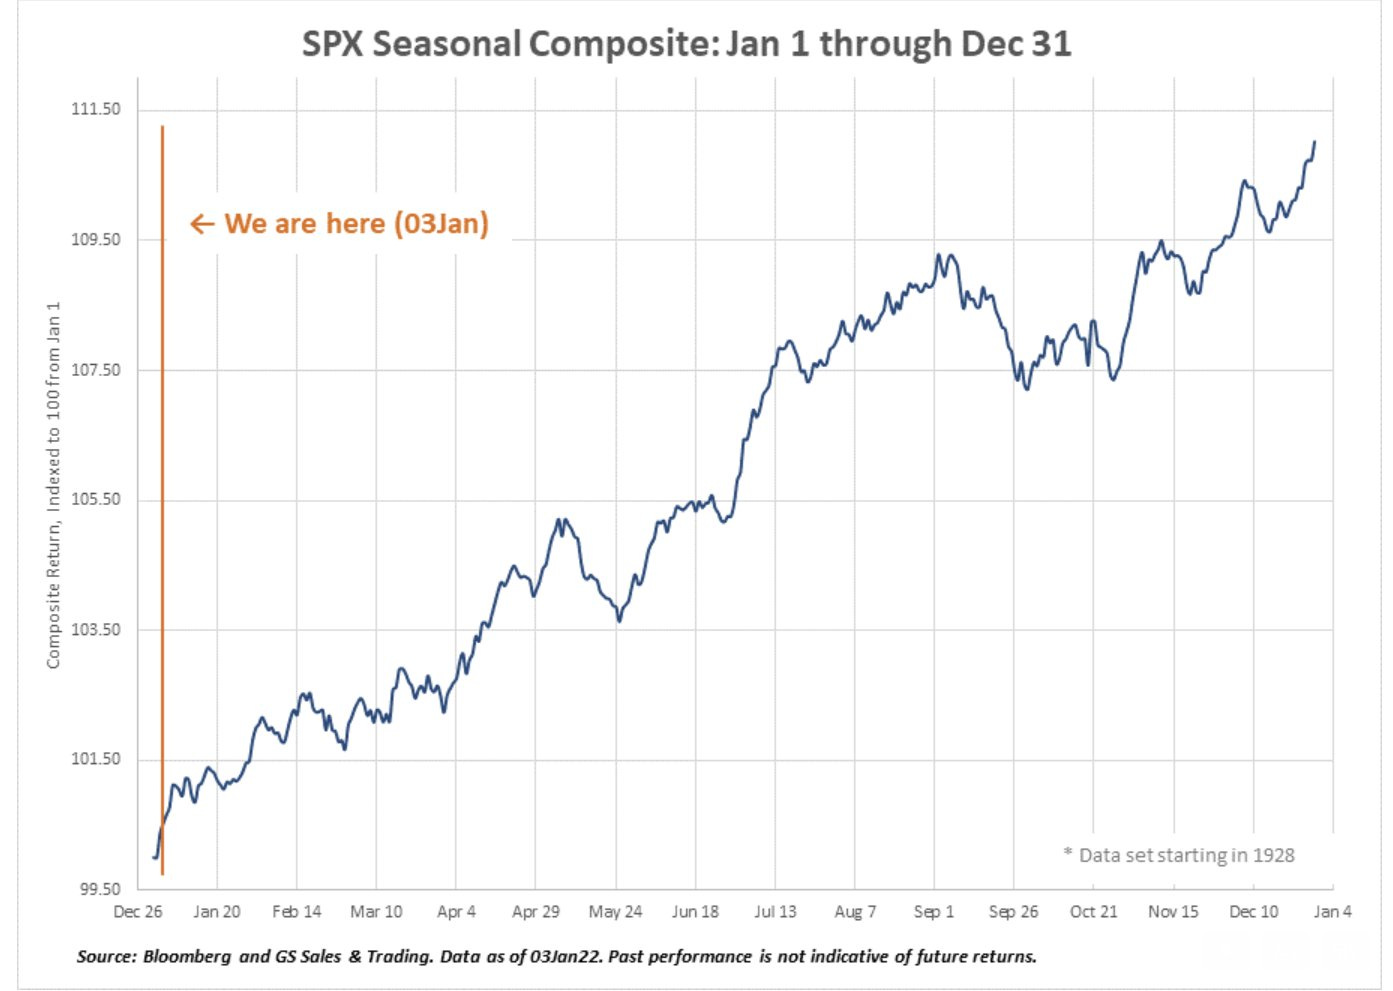
After hard data, now let’s also look at Seasonality: positive Seasonals to start 2023 as a preview of the start of the year.
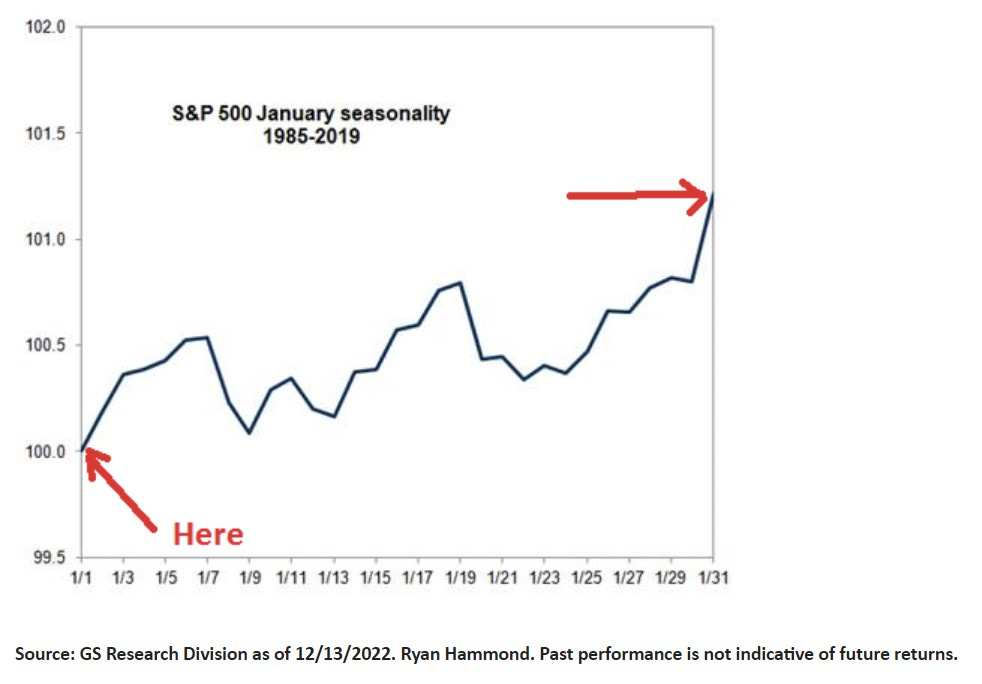
S&P 500 January - isolated - seasonality: that's the pattern ...
Last but not least, let’s note also that Stock Buybacks are back in town in 2023: repurchase Blackout window ends on 1/27/23. GS Corporate buyback desk models $1TN worth of executions for 2022, for the best year on record (2021 was $992bn). This gets us to ~$4 Billion during each of the 252 trading days.
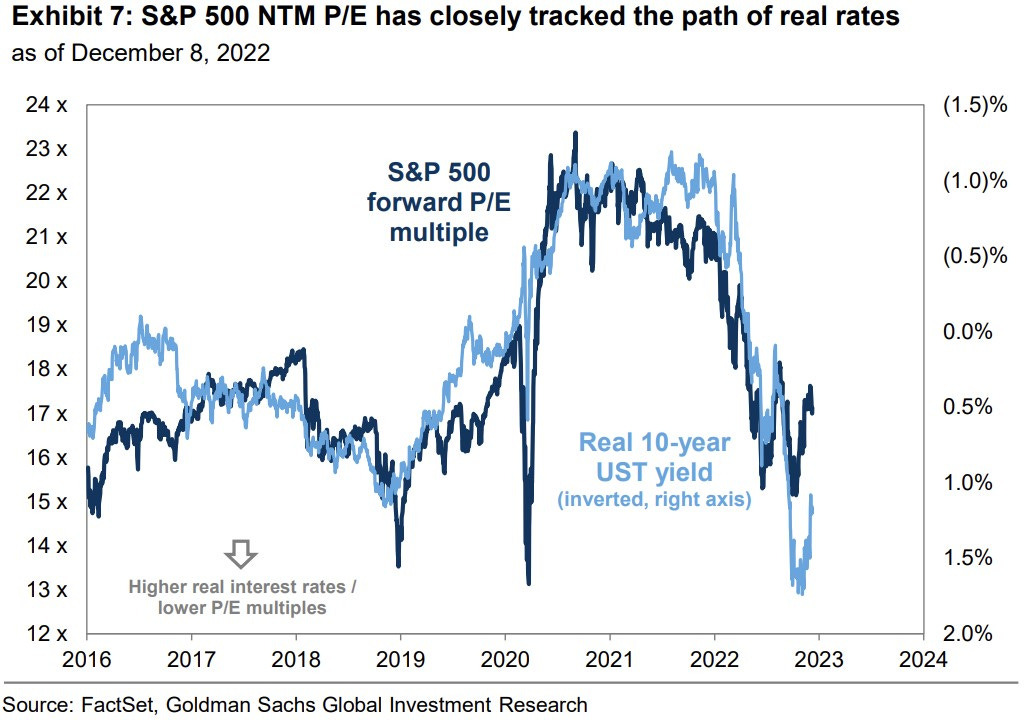
Key variable to watch in 2023 S&P 500 valuation wise? Real Rates!
P/E (forward) closely tracks the path of real rates 10-year real US treasuries
higher real rates lead to lower P/E multiples & conversely lower real rates lead to higher P/E multiples
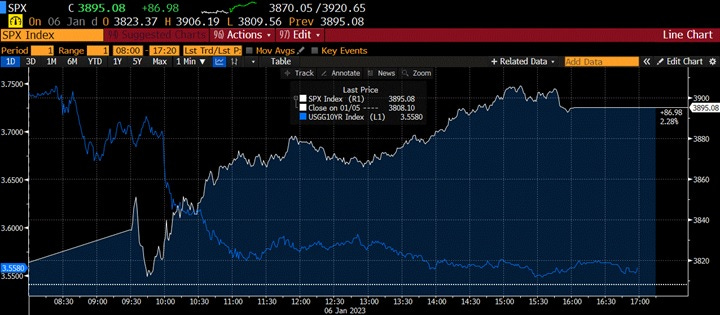
This was shown again exactly now in 2023 on Friday the 6th of January: S&P 500 UP, 10-year real US treasuries DOWN. Interest rates, interest rates, interest rates … .
I hope you enjoyed this publication. What would help a lot from your side? Easy, just spread the word around & share this with people that might also be interested.
Have a great start in 2023!
Maverick Equity Research









Very interesting January seasonality, thanks for sharing!
Thanks a lot, saw the thread on twitter also ... this was even more detailed ... real research ... appreciate