✍️ Maverick Charts & Markets - July 2024 Edition #20
Tech AI CAPEX, Nvidia VS Berkshire, FED, Manufacturing & Investments, TLT, Gold, Luxury sector margins, Delinquency rates, Money Market Funds, Small caps
Dear all,
first of all, welcome to the 700+ new readers for a total of 9,522! The independent investment research here is now read across 151 countries and 49 US states! Enjoy!
The Substack team decided to have my publication featured within their ecosystem after handpicking it from the many out there! Moreover, they sent a sleek badge also!
Second of all, watch out there for the many pesky impersonators of this publication. I will never ask for your WhatsApp number, any personal data, there is no other separate channel, group etc. This Substack + my verified Twitter/X profile are the only places I am active and publish. When/if I expand, you will be the first to know!
Now there you go with July’s 25 charts + 5 bonus that I carefully cherry picked.
Delivery is in typical Maverick fashion, via charts that say 10,000 words covering Macro, Stocks, Bonds & more which also naturally connects the Geopolitics dots.
How they add value to you? First of all, at a minimum saving you time which is a ‘maximum-minimum’ already as time is precious. Secondly, providing key insights without clickbait, hype, a 2-hour media talk, or an endless podcast. Basically, these monthly wrap ups are done so that many can connects many dots across markets!
Research is NOT behind a paywall and NO pesky ads here unlike most other places!
What would be appreciated?
Just sharing this around with like-minded people, and hitting the 🔄 & ❤️ buttons! That’ll definitely support bringing in more & more independent investment research!
First of all, from the one & only Warren Buffett: "Cash combined with courage in a crisis is priceless." and "Only when the tide goes out do you discover who's been swimming naked."
Intuitive Surgical (ISRG) RECURRING revenues going higher & higher: likely a stock that I will cover in detail via the Full Equity Research section. Stay tuned!
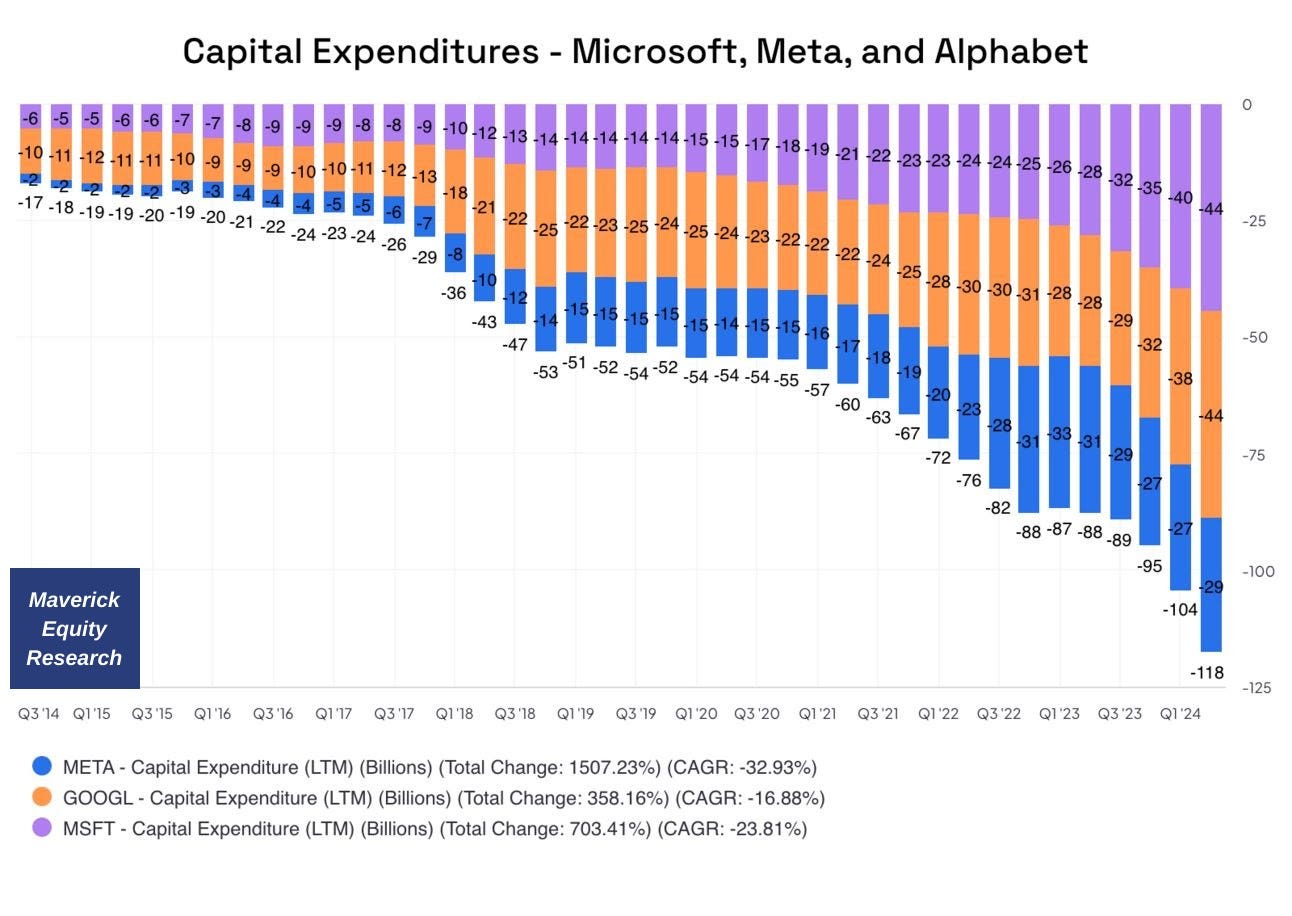
Tech companies and Capital expenditures, CAPEX baby!
👉 Microsoft, Meta and Google have been boosting capital expenditure since 2020
It’s Google/Alphabet time
👉 Q2 earnings better than expected: grew its revenue 14% versus the same period a year ago and expanded operating margins from 29% to 32%
👉 consistent growth across pretty much all of its divisions, but one segment stood out above the rest: Google Cloud crossed $10 billion in revenue (up 29% compared to a year ago), while also delivering more than $1 billion in operating income
Maverick ‘Chart Of The Year’ candidate: Is it a bird? Is it a plane? No, it's Berkshire's Hathaway or actually better said 'Berkshire STASHaway' cash position
👉 cash pile = $277 billion from $189 is the biggie, doing the ‘T-bill & Chill’ strategy
👉 Buffett like a cat, no matter what landing on top and smiling = taking profits and building a huge cash large pile ... cash compounds now at +5% given the high interest rates ... heads he wins, tail he wins ... keep compounding!
👉+ gets optionality via that cash: buy undervalued stuff that they find or buy the same should we have a correction/recession
👉 Selling almost 50% of Apple was quite a 'trim': I do not think it’s a vote against the business, but less concentration risk / more diversification & profit taking: recall that Apple is 13% in 2024 and 315% in the last 5 years, Apple does stock buybacks, hence Buffet’s share grows anyway
👉 The Bank of America selling is also rather risk-off + diversification given the market touching recently all-time highs after all-time highs
👉 Recall that Buffett said is looking at an investment in Canada, which one could it be ? It should be energy or rail, or some pipeline ... . Maybe Enbridge (ENB) ... as quite a key one for Canada ... your thoughts?
👉 note how Cash went down during the 2007-2009 GFC (Global Financial Crisis) as Buffett was buying quality businesses for dirt cheap prices
👉 if by chance we get a recession (well, reminder: sooner or later it will happen, it is called the basic business cycle), what do you think Buffett will do? Same thing again!
I call this the ‘T-bill & Chill’ or ‘T-bill & Wait’ strategy hunting for opportunities that always come along sooner or later ...
💰 Buffett = the new FED in terms of treasuries holdings? Buffett holds now more US Treasury Bills than the US Federal Reserve ...
👉 Buffett own $277 Billion = 4% of all T-Bills issued to the public …
VS
👉 The Fed owns $195 Billion and tapering ...
Nvidia: gained 1.5 trillion in market cap in 2024 … which is equivalent to one entire + and a half of Berkshire ... which took 6 decades to compound by legendary Buffett & Munger! Let that one sink in & bring the sink if you feel like ...
US FED tapering from the ~$9 trillion April 2022 peak
👉 the Federal Reserve's balance has shed ~$1.8 trillion since the peak in April 2022
👉 after a 20% drawdown at ~$7.1 trillions now & at the lowest level since May 2020
👉 heading to pre-Covid levels in the range of ~$4.0-4.5 trillions
Food for thought: remember all the people that were screaming the markets would crash as the FED balance sheet is tapering off? Well, we reached new all-time highs …
Manufacturing baby, manufacturing! Total Private Construction Spending
👉 soon 3x since 2020, let that sink in! Quite a why the economy is doing well imho
👉 note: JPM's Jamie Dimon on the US economy recently “Basically, it's booming.”
Let that sink in ... and ... bring the sink if you wish!
What about business investment activity? It is UP as well!
👉 New orders for non-defense capital goods (excluding aircraft) with a very sharp rebound since the 2020 pandemic, and currently at a high level of $73.9 billion - while the growth rate slowed down, it still signals strong confidence looking ahead, hence a positive outlook and economic strength in the months to come
👉 new orders for non-defense capital goods is also known as ‘core CAPEX’ or simply put ‘business investment’ … so that you can connect the dots and/or do not get confused with other research or media reports
N.B. core CAPEX is regarded as a key factor driving the economy and one of the leading indictors of business activity / business CAPEX … hence to be monitored for any big swings be it up or down … see how it related to the business cycle with the grey bars showing the recession periods
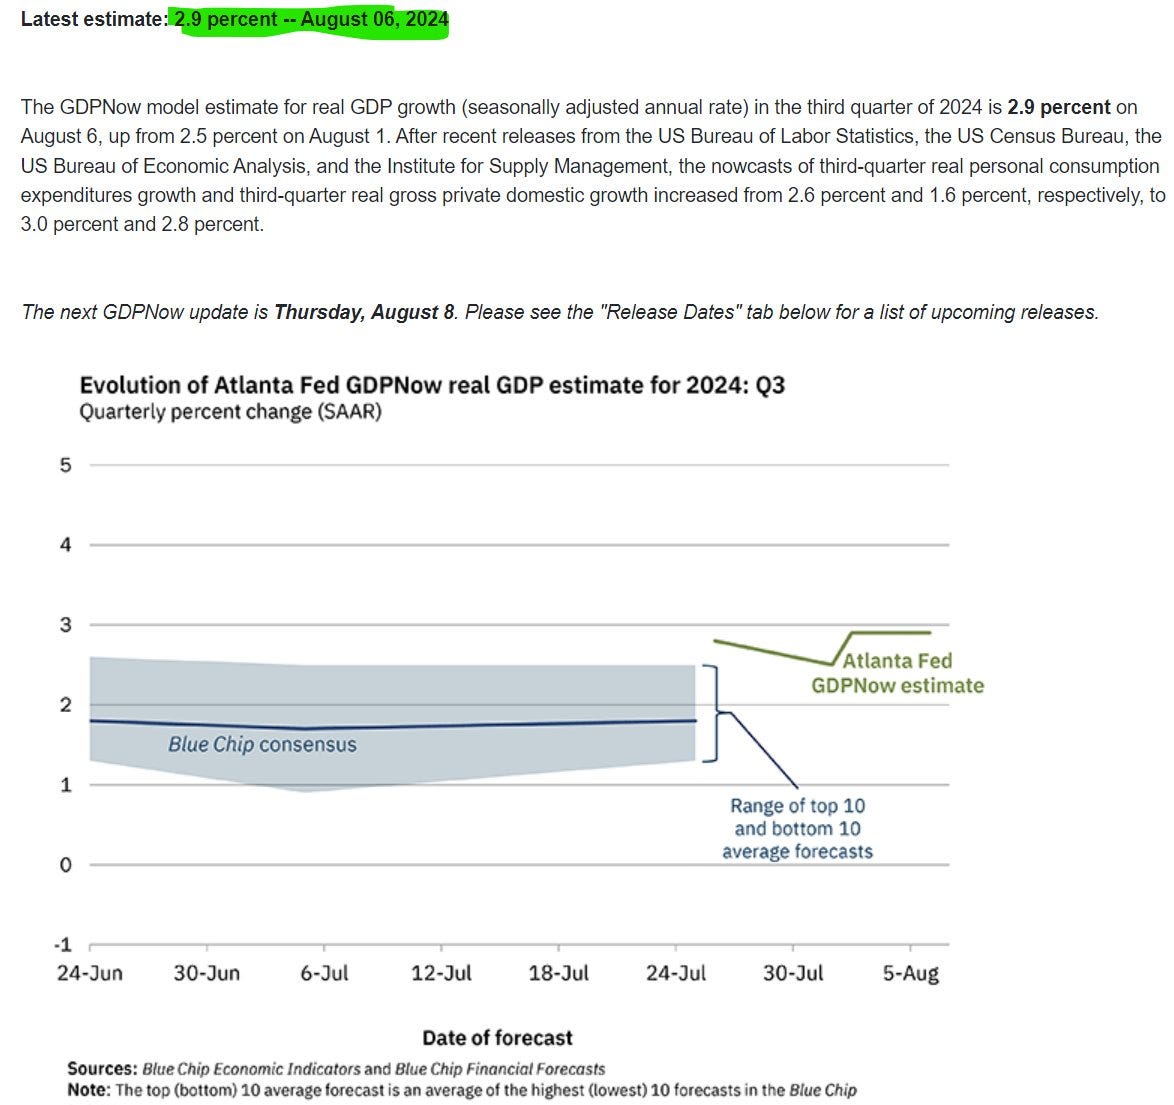
9.US GDP NowCast = Q3 2024 real GDP: +2.9% (q/q) via the latest August 6th GDPNow Altanta FED estimate … take it easy calling the recession is here …
In case you missed my deep dive on the US economy, there you go with the 3rd edition from June. Book your calendar for the 4th edition coming up next month in September.
✍️ The State of the US Economy in 75 Charts, Edition #3
TLT (20+ Year Treasury Bond ETF): record flows (almost 50 billion, blue), price picking up (green)... as FED funds rate peaking (red), cuts likely incoming … Thoughts? You know mine as I have been putting this upfront for a while …
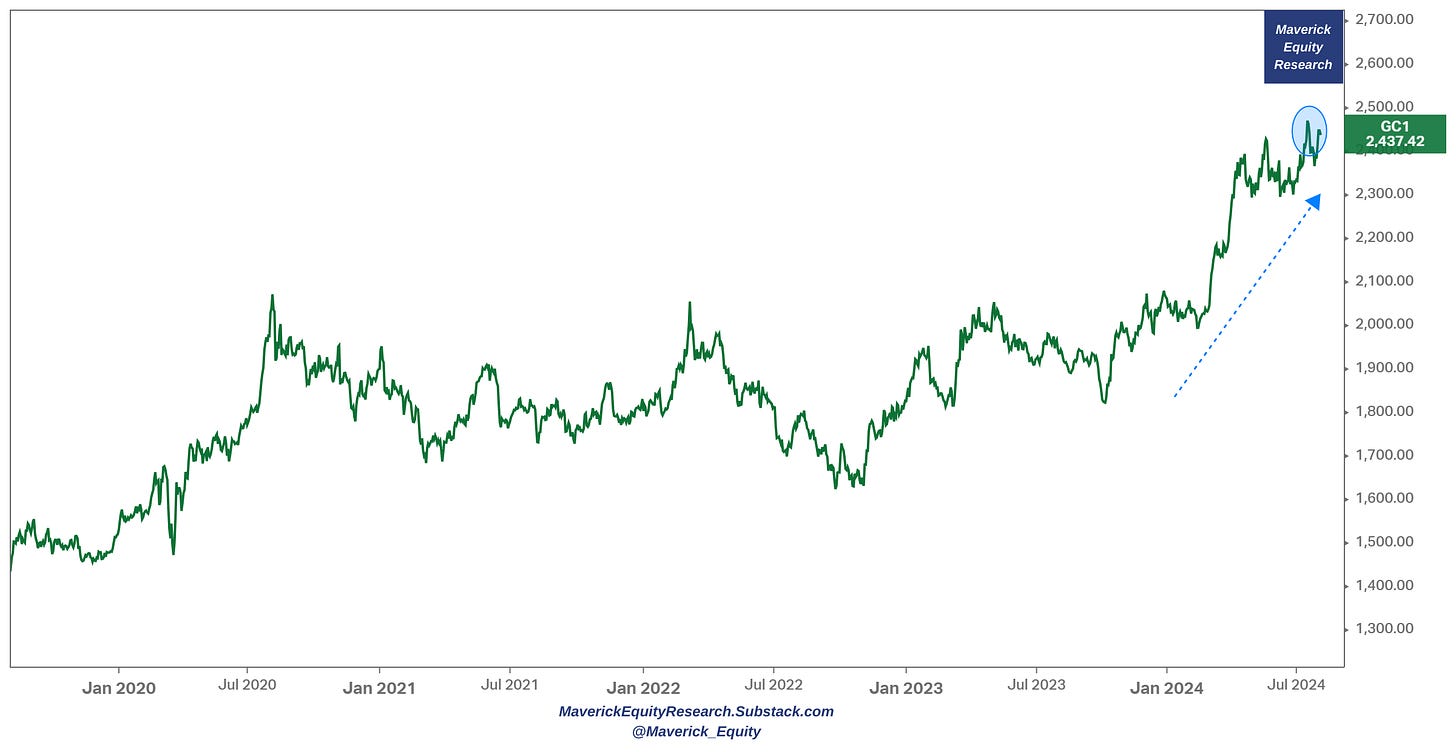
Gold: casually hitting a new all-time high as well: I say ‘casually’ as you recall my notes on how aggressively central banks have been buying gold in the last years
How high are the margins in the luxury sector? Have you ever wondered?
Interest rates on credit cards & delinquency rates on consumer loans
👉 interest rates on credit cards topping above 20%, likely lower from here
👉 Credit card default rates at 2.64% remain low historically
Delinquency rates, a breakdown by type
👉 in the 2007-2009 GFC, single-family residential defaults were the ones that spiked first followed by CRE loans
👉 no housing market issue nowadays, hence my focus is on defaults on CRE loans (orange) & Consumer loans (red) for a gauge on the health of banks and the consumer
Money Market Funds (MMFs) = record highs!
👉 MMFs total financial assets with record highs above $6.4 trillions (blue)
👉 the higher the rates driven by FED hiking rates (green), the higher MMFs assets
If we count time deposits, we soon reach $9 trillions ...
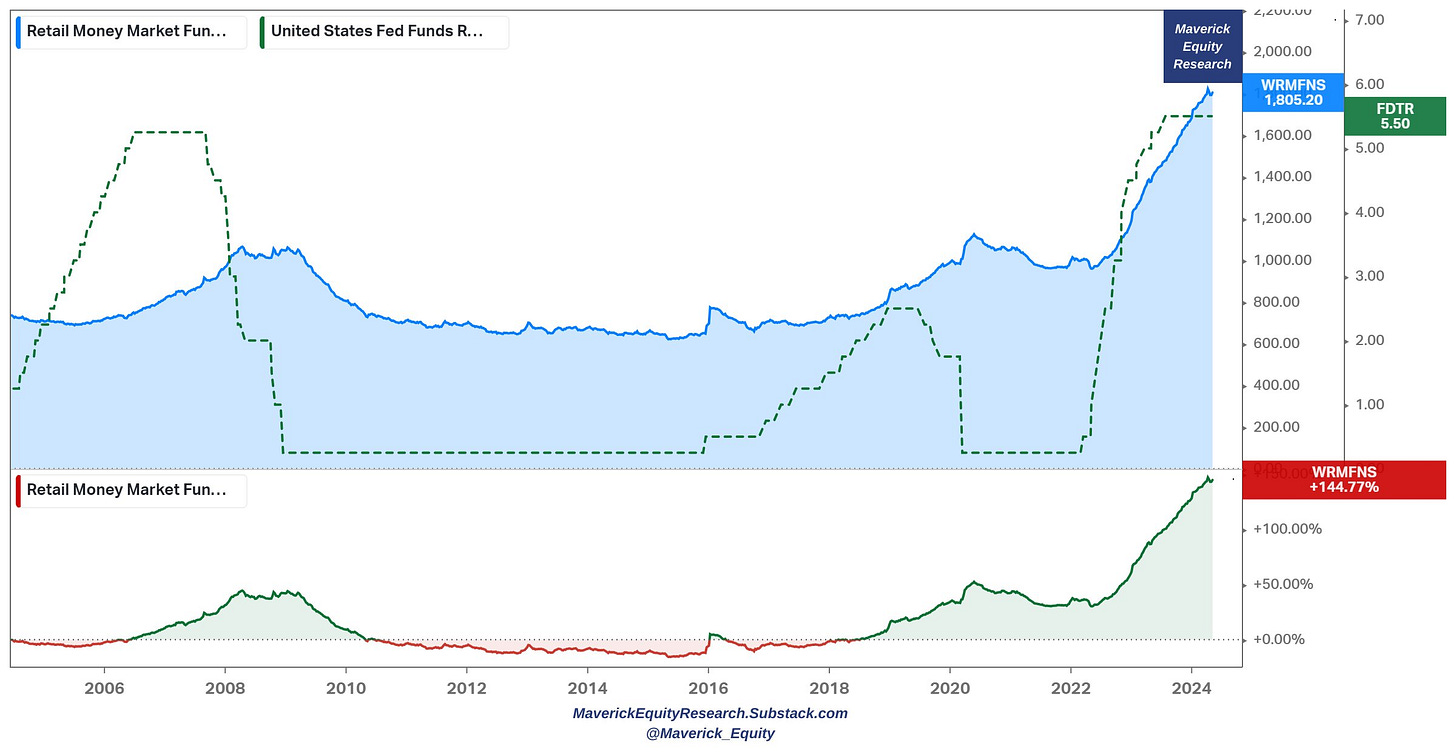
Did Retail Investors react from deposits paying peanuts? Isolating retail MMFs:
👉 yes, they did … also at record highs above $1.8 trillion
👉 note also below the price change % record high growth
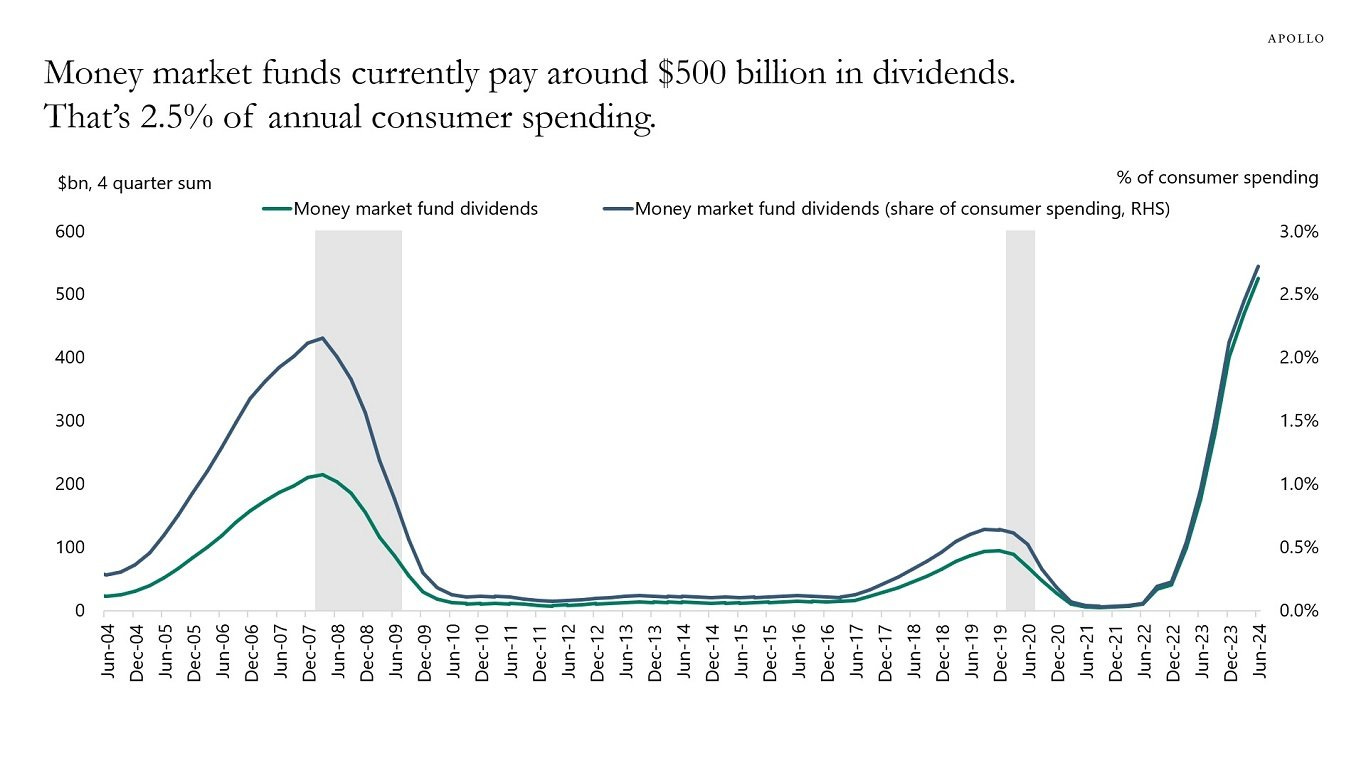
Why and how much do Money Market Funds (MMFs) pay investors?
👉 The Positive Effect of Fed Hikes On Consumer Spending = Money market funds are paying now $500 billion in dividends which = 2.5% of annual consumer spending
How do (Money Market Funds) pay investors in relation to FED & interest rates?
Easy answer and this time via an even longer time series:
👉 the higher the interest rates, the more Money Market Funds pay and both corporate and retail MMFs react … as banks pay less and experience outflows …
👉 once the FED starts cutting, Money Market Funds experience outflows as they pay less & less … but until then, as of today they pay decent … especially via a risk-return basis and if one already compounds nicely …
Money Market Funds and Banks Deposits with the 1st FED hike = divergence!
👉 for a while it worked for banks paying peanuts via deposit rates and boosting their Net Interest Margin (NIM), but then investors said nahhh, 'yield me baby one more time!'
Nonetheless, let this one sink in: still $17.5 trillion cash Americans have in commercial bank accounts yielding an average of just 0.45% ... PEANUTS!
👉 Solution: financial education, good financial advisory … which can be simple, does need not be complicated (to justify fees), a lot can be done via simple solutions!
👉 until then, recalling a saying from one of my former managers when it came to hiring, paying people, motivating, proper and fair incentives, delivering results:
‘you pay peanuts, you get monkeys … or smart people that will soon start acting like monkeys!’
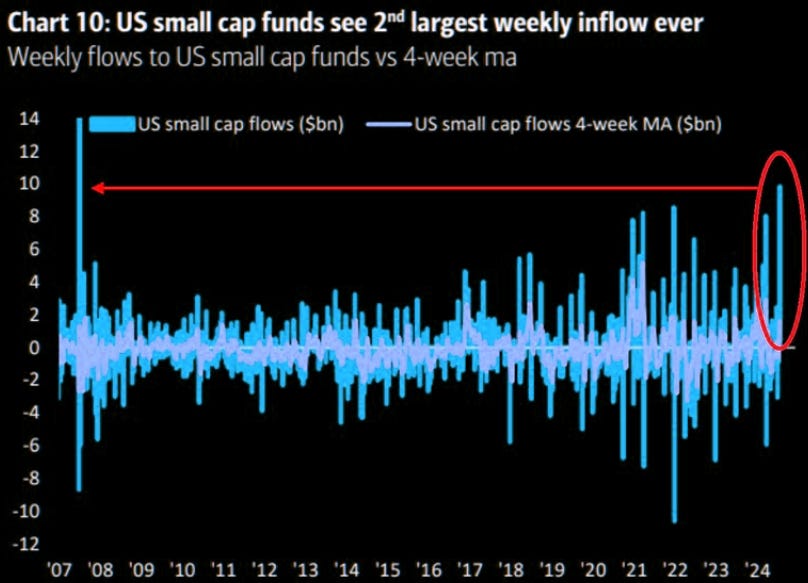
21.US small-cap stock funds had their 2nd largest weekly inflow on record in July: almost $10 billion flowed into US small-cap funds … US but also international small caps will be covered by me in the Full Equity Research section. Stay tuned!
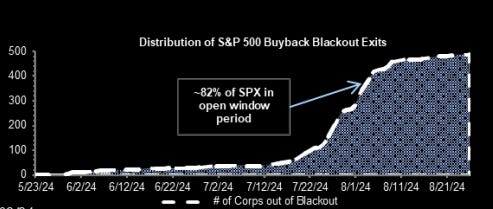
22.Stock Buybacks in the S&P 500 coming up - the buyback bid is waking up and should provide some support...
23.SOX are sexy again? SOX is very oversold ... but has actually put in the biggest up candle since "forever", bouncing right on must hold levels.
24.Current volatility spike relative to previous ones ... my take: this one was overcooked ... quite badly ...
25.Mean & Median cumulative returns of all (29,078) US-listed stocks since 1926
👉 median cumulative return is guess how? Negative … let that one sink in
👉 mean cumulative return is 22840% … let that one sink in!
Maverick’s take: picking winners and letting them run is key …
👍 Bonus charts: Bitcoin edition 👍
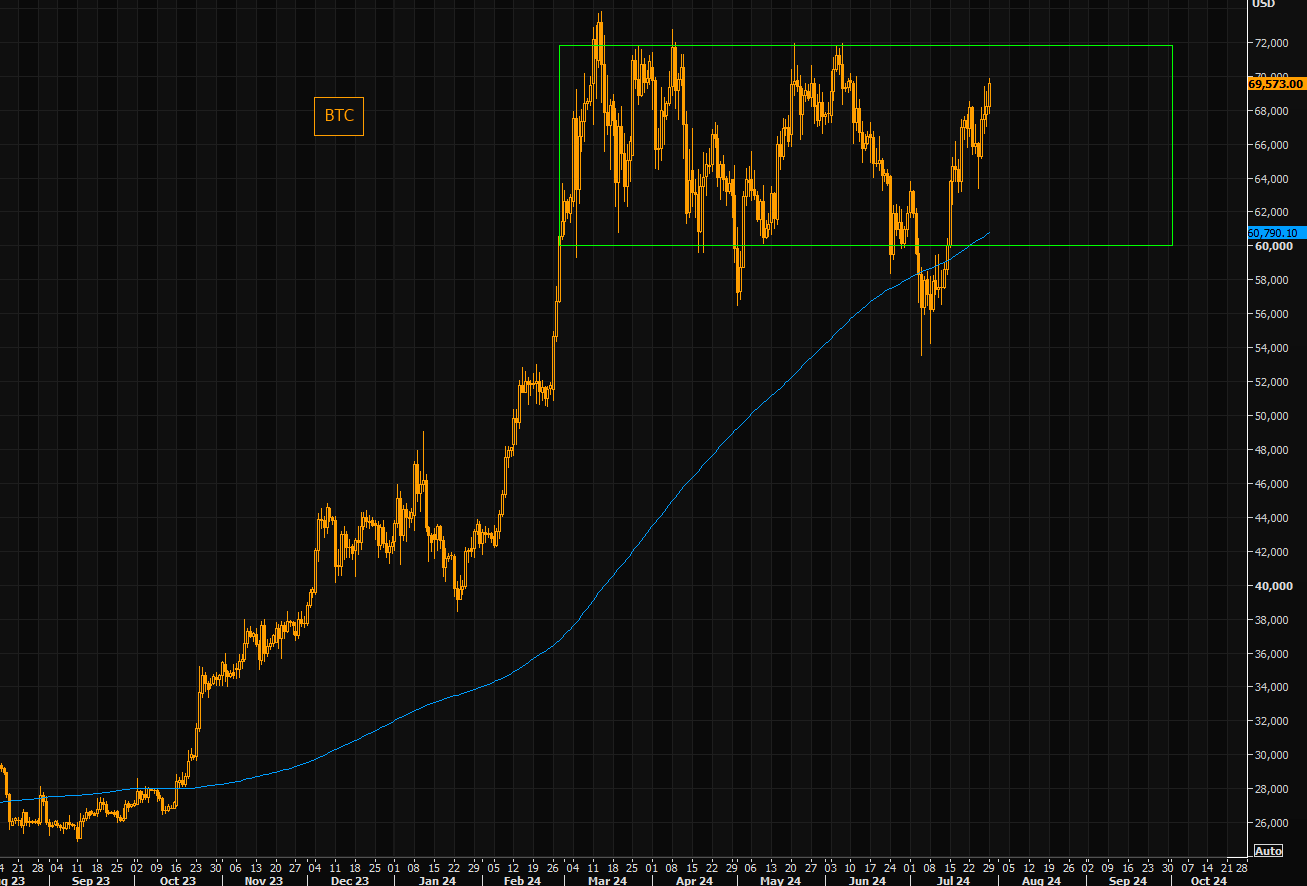
'Never Sell Your Bitcoin Bro' ?!?'
👉 the big BTC range requires a mean reversion mind = all break out attempts, both up and down, have been violently reversed
👉 the question is: do you sell range highs again, or listen to Trump's trading take outlined over the weekend "Never sell your bitcoin"? Food for thought … enjoy!
‘Bitcoin = the perfect tech substitute bro' ?!?'
👉 Bitcoin is not tech these days ... aka the crypto and NASDAQ have moved in perfect inverse relationship since late May. Chart shows BTC (inverted) vs NASDAQ
'Bitcoin = the fear hedge bro’ ?!?'
👉 Bitcoin lost the "fear" hedge long ago, but moved lately in tandem with the VIX
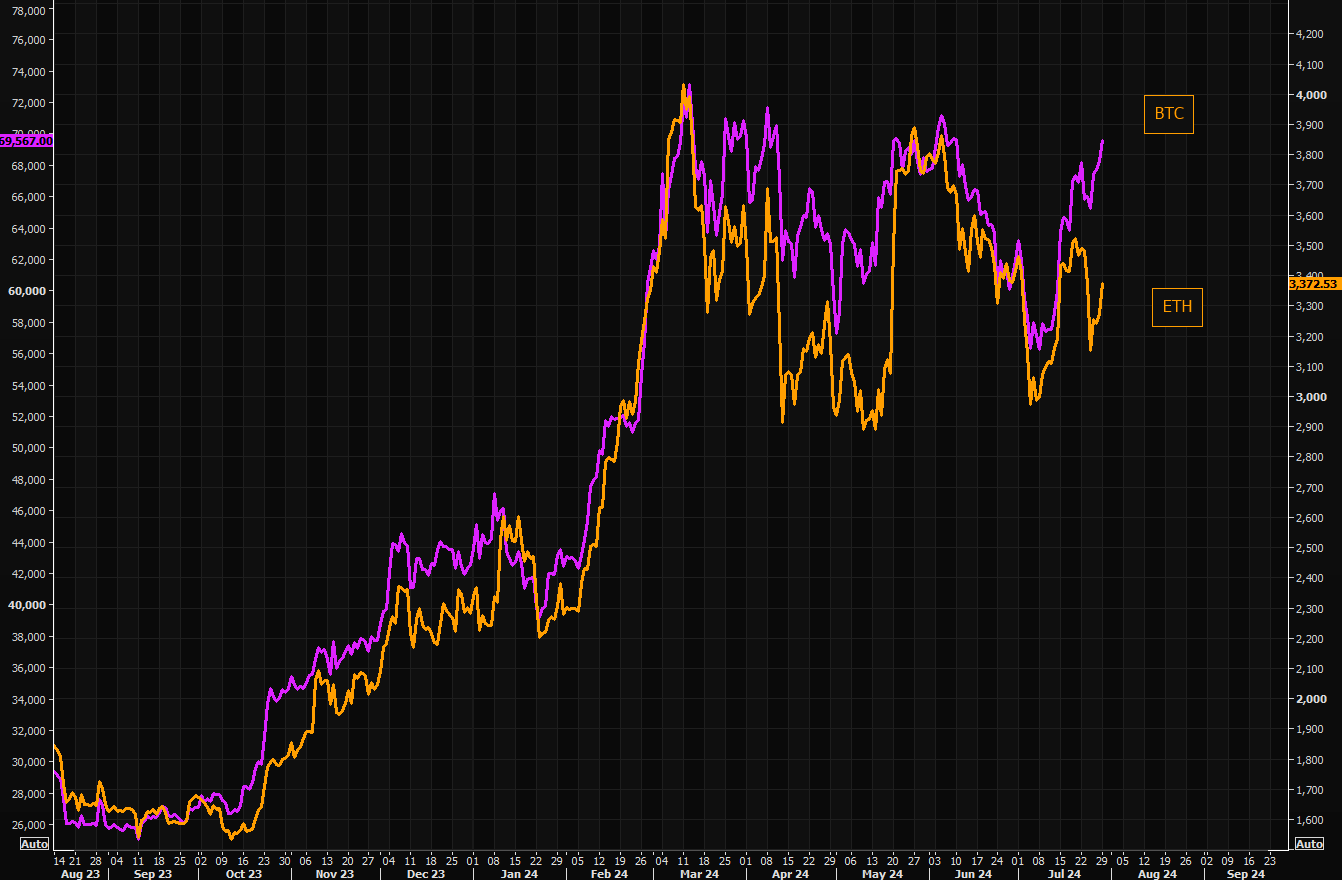
ETH = the lazy laggard
👉 last time BTC traded here, ETH traded at $3850 ... let that one sink in and bring the sink if you feel like ...
Ether: Blackrock, Bitwise and Fidelity's Ether ETFs took in over 900 million of inflows ... while hyper party cheer leader Grayscale lost 1.5 billion
Research is NOT behind a paywall and NO pesky ads here unlike most other places!
Did you enjoy this extensive research by finding it interesting, saving you time & getting valuable insights? What would be appreciated?
Just sharing this around with like-minded people, and hitting the 🔄 & ❤️ buttons! That’ll definitely support bringing in more & more independent investment research: from a single individual … not a bank, fund, click-baity media or so … !
Have a great summer!
Mav 👋 🤝














Thank you for all the value and market insight.
Thanks. TLT/EDV/TMF it's a bit late now.