Maverick Charts - March 2023 Edition #5
Cherry picked charts for interesting insights via short reads. This edition: S&P 500 & Rates, FED pricing, ETF flows, Stocks & Bonds, Retail Investors & Big Tech
Dear all,
welcome to the 5th edition of Maverick Charts, a dedicated section from Maverick Equity Research where I cherry pick 20 various charts from various contributors with the goal to provide interesting research insights via short reads. Enjoy it!
In case you did not subscribe yet for delivery straight to your inbox, it’s just 1-click. And the same goes to share this around with whom might be interested as well.
The most recent on Macro & General:
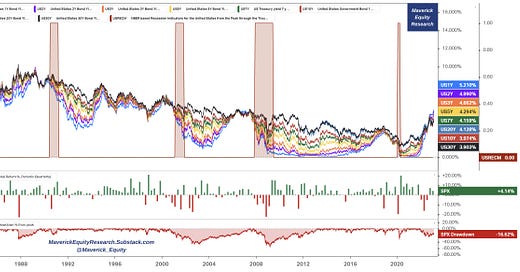
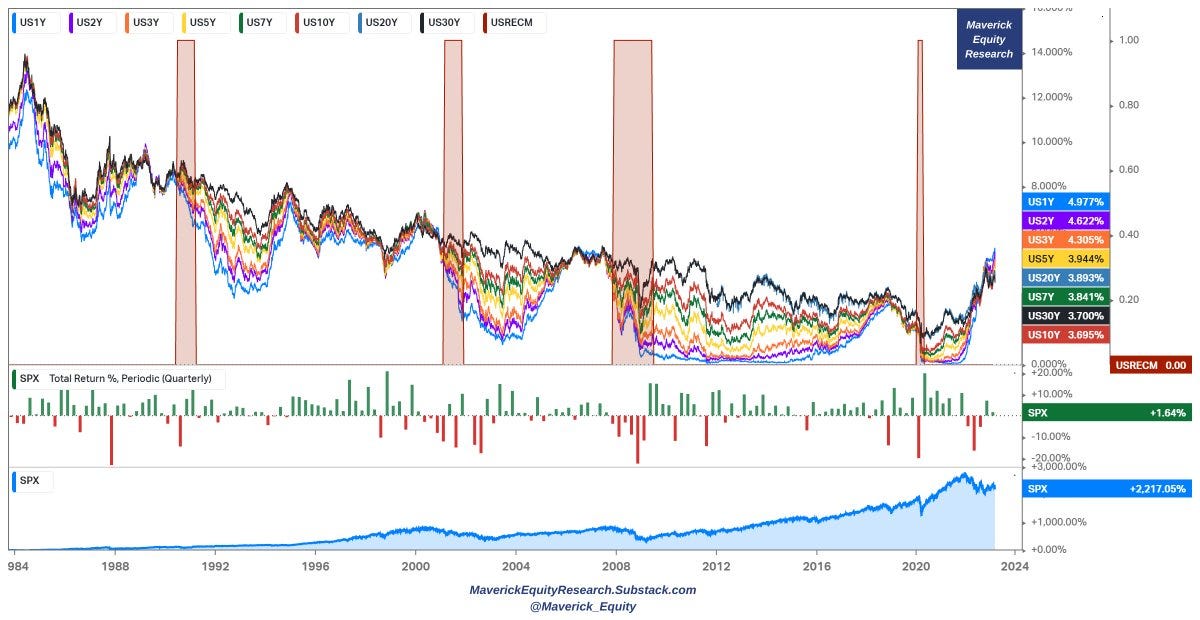
Via Maverick Equity Research: S&P 500 at least priced in already last year a / 'the' most anticipated recession in history, even a mini-rally in 2023, or? Overview:
👉 40 years of US interest rates with red bars recession
👉 S&P 500 quarterly returns & drawdown
👉 via Avery: Great to see all the tenors lined up with drawdowns and the periodic returns - I think this gives a better view as to what investors might expect with regards to rates/equity correlation
👉 Complementary given was asked via DMs: same but replaced S&P 500 drawdown with it's mighty Price Return (bottom blue): +2,217%
👉 N.B. that's ‘just’ price return, guess how much bigger with dividends reinvested? 6,000% for a 11.18% compounded annual growth rate (CAGR) … Let that sink in! …
Side note: it was great to see the one and only Danielle DiMartino Booth liking & retweeting …
Via Capital Flows: Fed Funds Futures pricing rate cuts
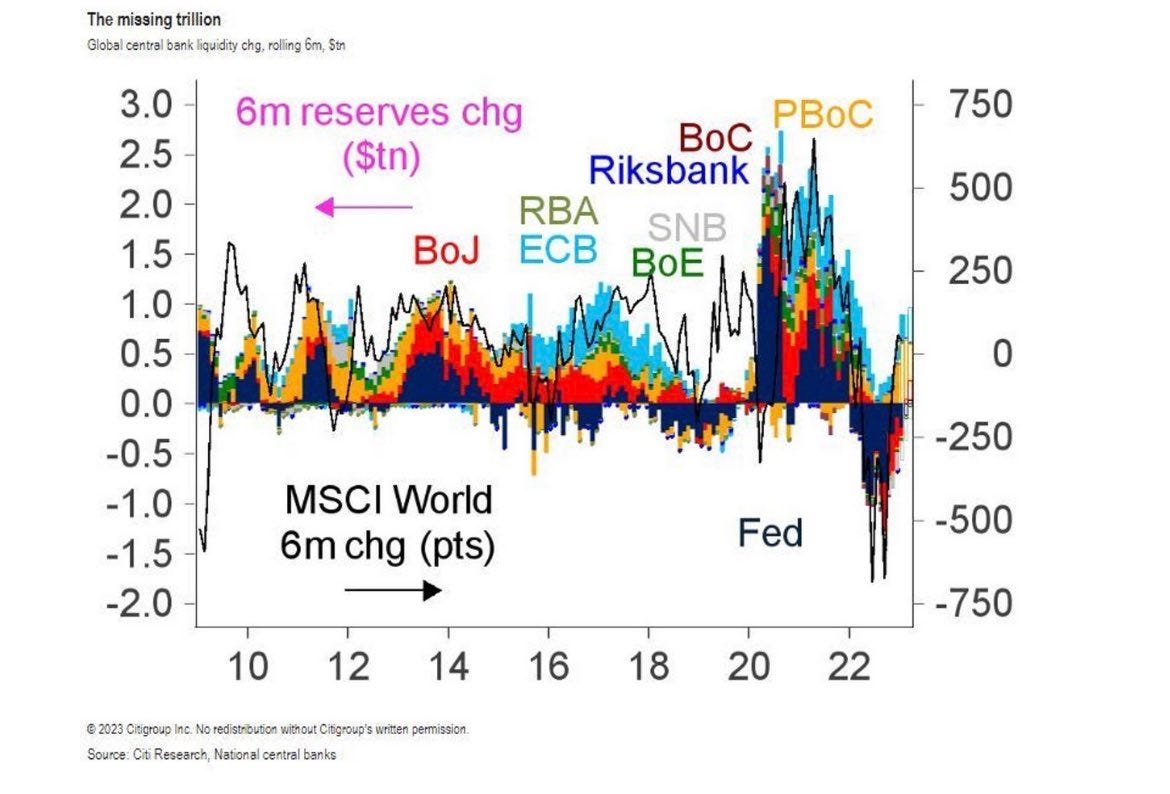
Via & Luis Torras & Citi: Even as the central banks have told us they’re going to be tightening, it turns out that on at a global level, they’ve just added $1 trillion worth of liquidity over the past three months
Via The Mad King: Central banks boxed in! No way out but to revive QE
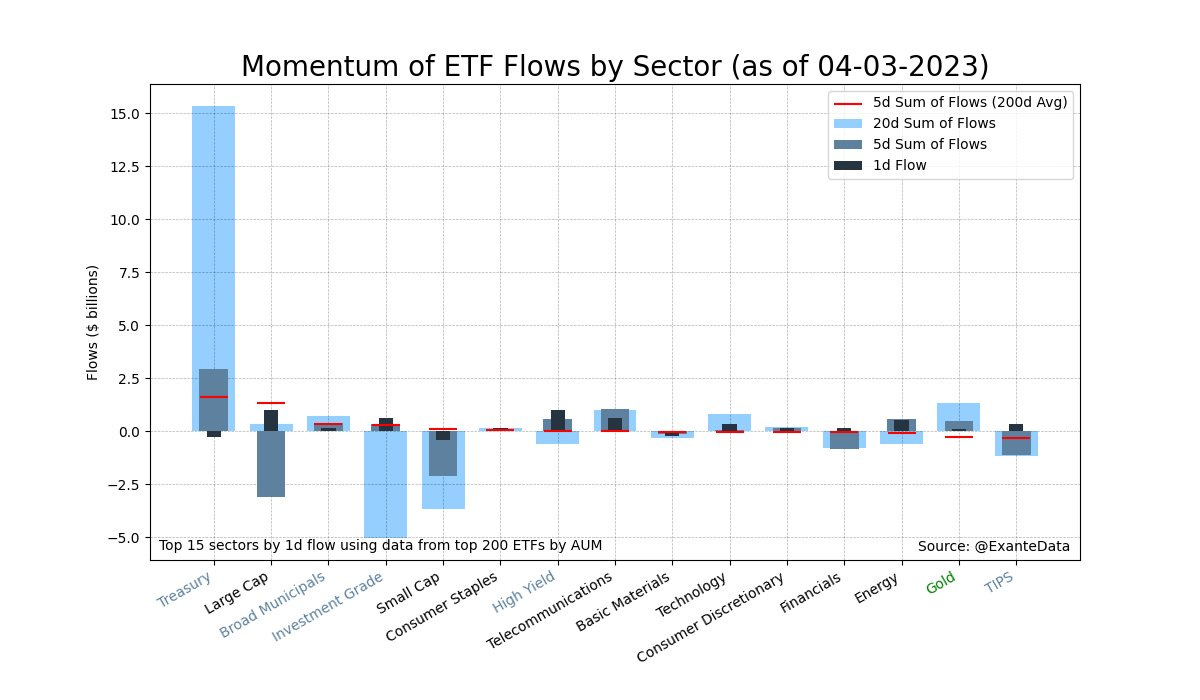
Via Kurang Patel: Notional ETF flows to monitor sector rotations within US Equities : currently the sectors experiencing the largest inflows compared to their averages include Treasury and Telecommunications, while outflows are being seen in Large Cap and Small Cap
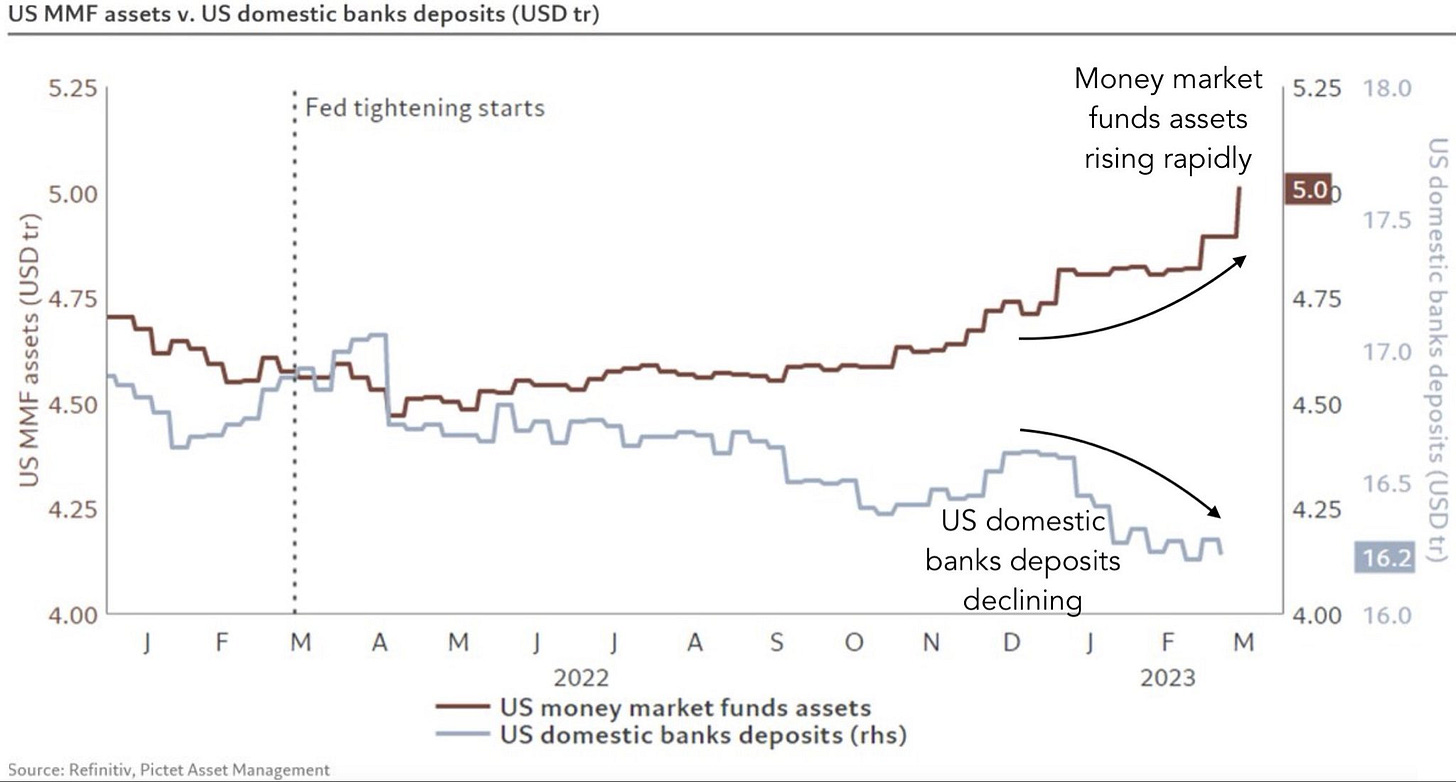
Via Michael A. Arouet & Pictet: Have US banks really assumed that people will happily keep their money as deposits earning 0,5% given all the alternatives?
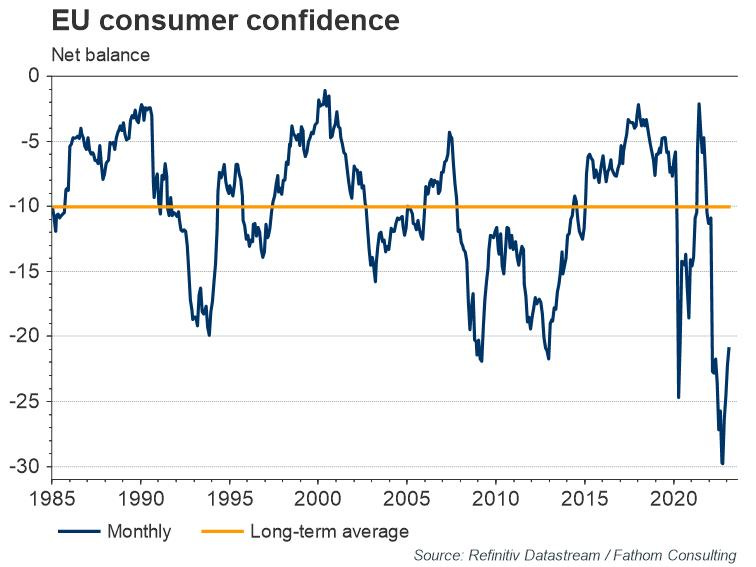
Via Refinitiv & Fathom Consulting: EU consumer confidence rose again after its trough in September
Via Michael A. Arouet & Reuters: At least one piece of all the various inflationary pressures has already normalized
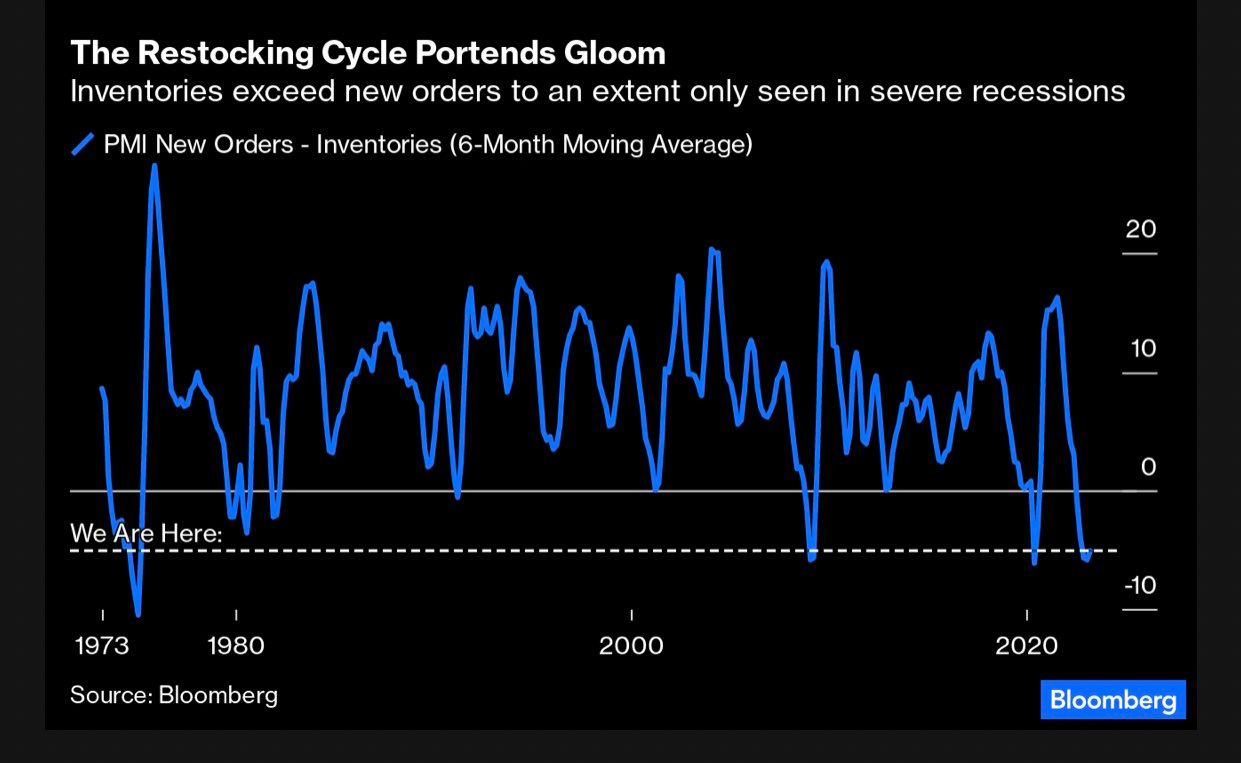
Via Le Sideline Shrub & Bloomberg: New Orders compared to Inventories have only been as depressed as the oil embargo in 1973, at the worst of GFC in 2009 and Covid in 2020 …
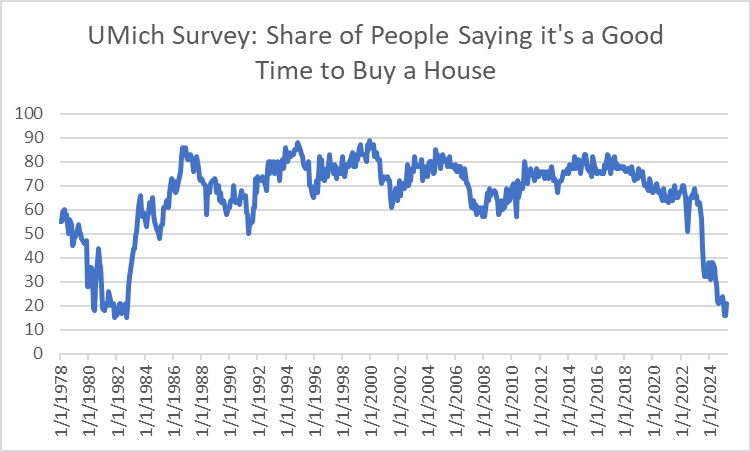
Via Joey Politano: People really, really, really do not like high mortgage rates
From the world of Stocks & Bonds:
Via Maverick Equity Research, VC & BofA, a great visual with 90+ Years of combined Stock & Bond portfolio returns!
👉Best, Worst & Average returns via various ways to mix stocks & bonds
👉check the classic 60/40
Bonds typically serve as a hedge against portfolio losses thanks to their negative historical correlation to stocks. Outliers are always interesting:
👉 2022 was quite one - correlation got back!
👉 the last time stocks & bonds moved together in a negative direction was in 1969
Over the last century, cycles of high interest rates have come & gone. Both equity & bond returns have been resilient for investors who stay the course ... . The 60/40 portfolio set for a comeback? Hard to have 2 big outliers 2 years in a row imo. How is 2023 looking so far a key question, no? As of February, rebound is here ...
Via Edelweiss Capital: Great businesses tend to remain great, or they become good businesses (combined probability of 79 percent).
Via Anne Cronin & Lu Wang (Bloomberg): All those stock market pessimists may actually be helping this year's rally. For more, link.
Oktay Kavrak, CFA & BofA: S&P 500 in 20th bear market past 140 years. On average: Duration is 289 days & Decline 37.3% peak to trough. We are now in a longer-than-normal bear market
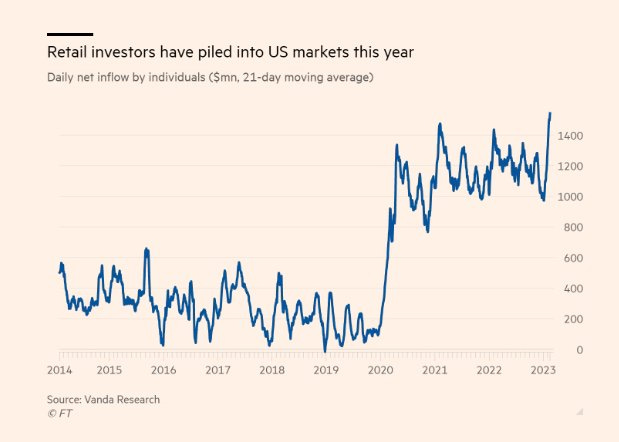
Via AlessioUrban & FT: Retail investors have piled into US markets this year
Via Ayesha Tariq, CFA & MS: Morgan Stanley cut Schwab's rating to equal weight based on the fact that cash sorting not improving as they had hoped, more intense regulation and pressure on earnings. It's not a deathblow/ This is the most interesting part of the report ⤵️
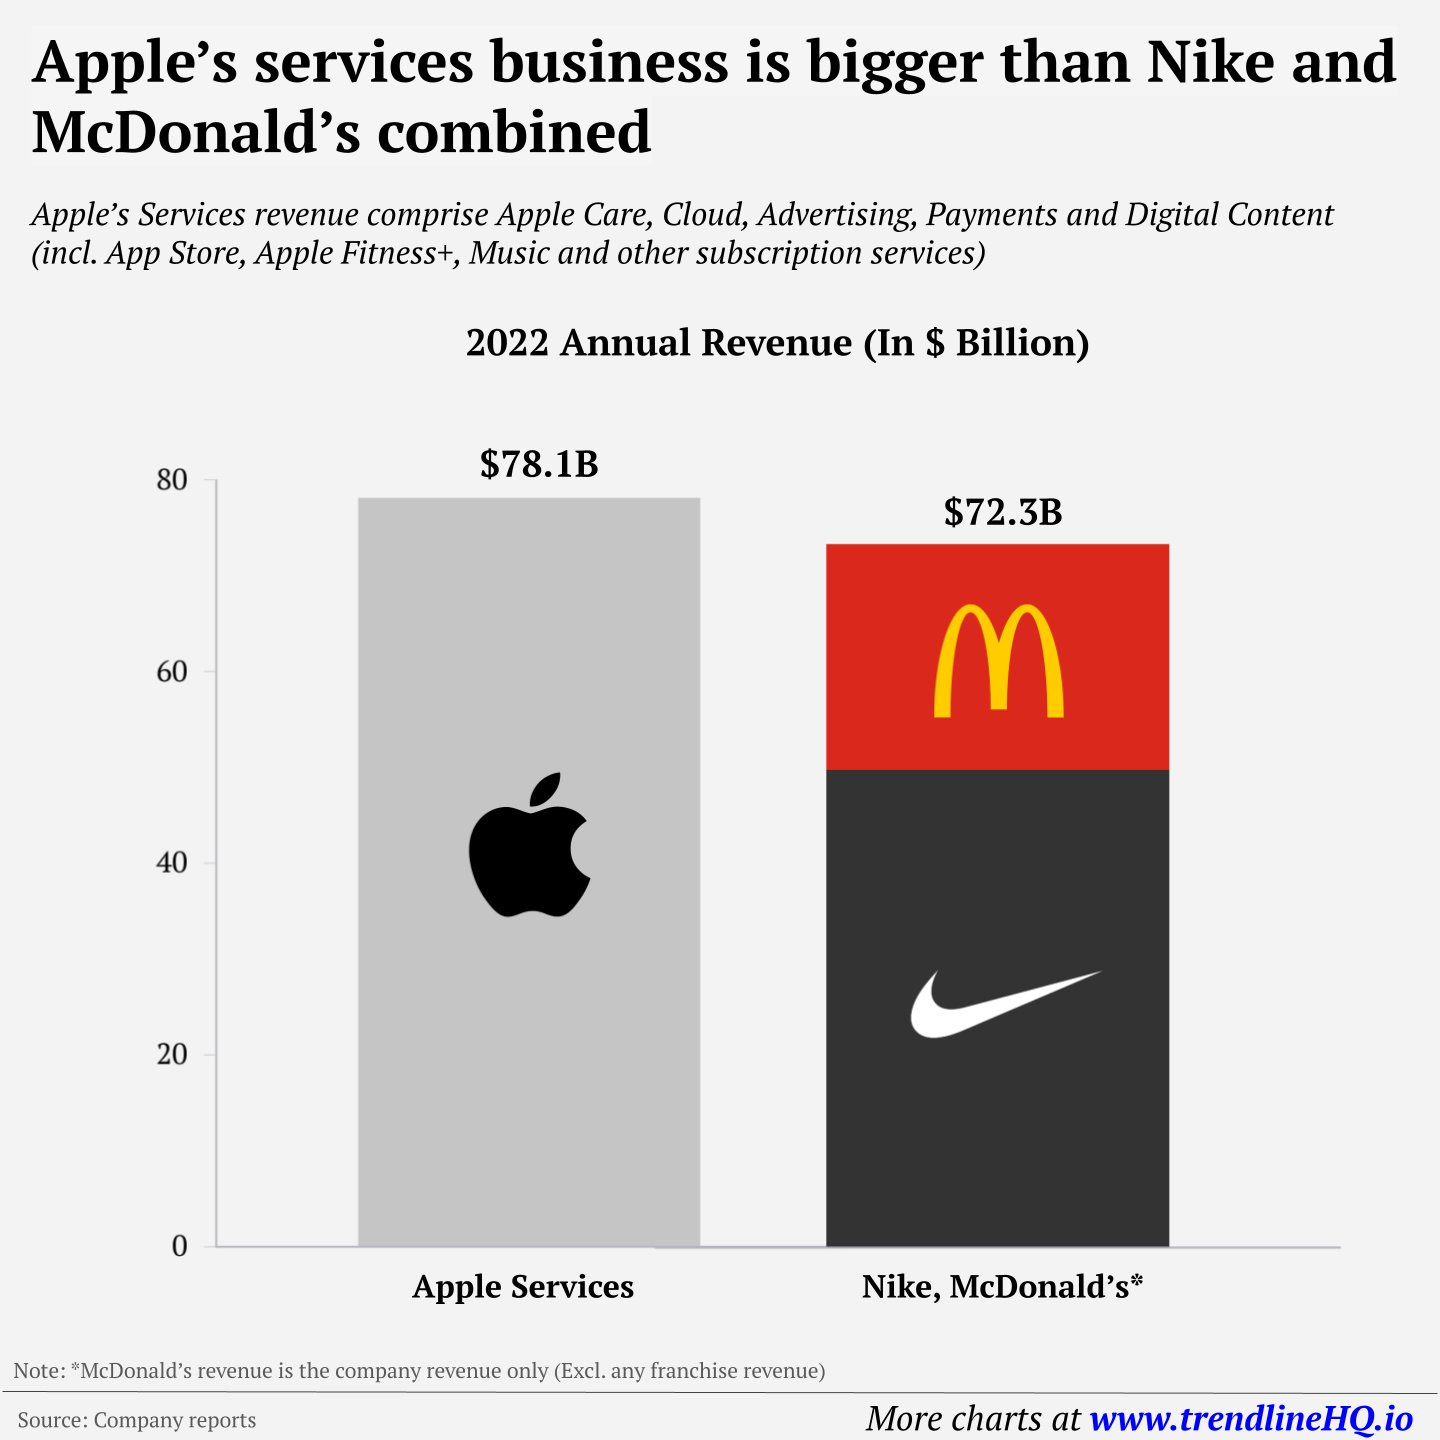
Via Maverick Equity Research: Apple 2022 total sales = $394 billion. Breakdown: 👉 52%from iPhone
👉17.6% Mac & iPad
👉10.5% Wearables, Home and Accessories (Apple Watch, Airpods etc)
👉20% from Services
~20% from Services = small/big? Bigger than Nike & McD combined. Let that sink in!
Via The Transcript & GS: Relative to the market, banks’ equity volatility is already nearing previous crisis levels
Via jeroen blokland: The market cap of 'Big Tech' is up a whopping 24% since the start of the year. This is the sole reason why US equities are holding up. However, the total market cap of Big Tech is still down a whopping 32% from its peak.
Via Athanasios Psarofagis: Big win for QQQ this week not having any financial exposure. Best week over SPY going back to 2008.
Should you have found this cherry-picking endeavour interesting and valuable, just subscribe and share it around with people that might also be interested to read this kind of content in the future. Twitter post can be found here. Thank you!
Have a great day!
Maverick Equity Research












Definitely Maverick Charts! Great job 👏
Thanks