


✍️ Maverick Charts of the Week #13: Bond Spreads vs News, Wage Growth & Job Openings, S&P 500 Earnings & Chatter
10 Maverick Charts that say 10,000 words

Dear all,
The ‘How’ = 10 cherry picked Maverick Charts of the week say 10,000 words or more!
The ‘What’ = table of contents:
📊 U.S Economy: Bond Spreads VS News, Wage Growth & Job Openings
📊 S&P 500: Earnings & Revenue Growth + Earnings Calls Chatter
The ‘Why’ = objective: data-driven insights + valuable food for thought + most of all, clarity of mind which was always very important, yet nowadays in the age of social media and 24/7 worldwide news & clickbait headlines, even more important …
📊 U.S Economy: Bond Spreads VS News, Wage Growth & Job Openings 📊
To kick-off, updating the previous 2 very useful charts for both you and me as we were navigating the Tariff/Trade War driven volatility in 2025: bond markets vs the news!
Let’s get visual for that!
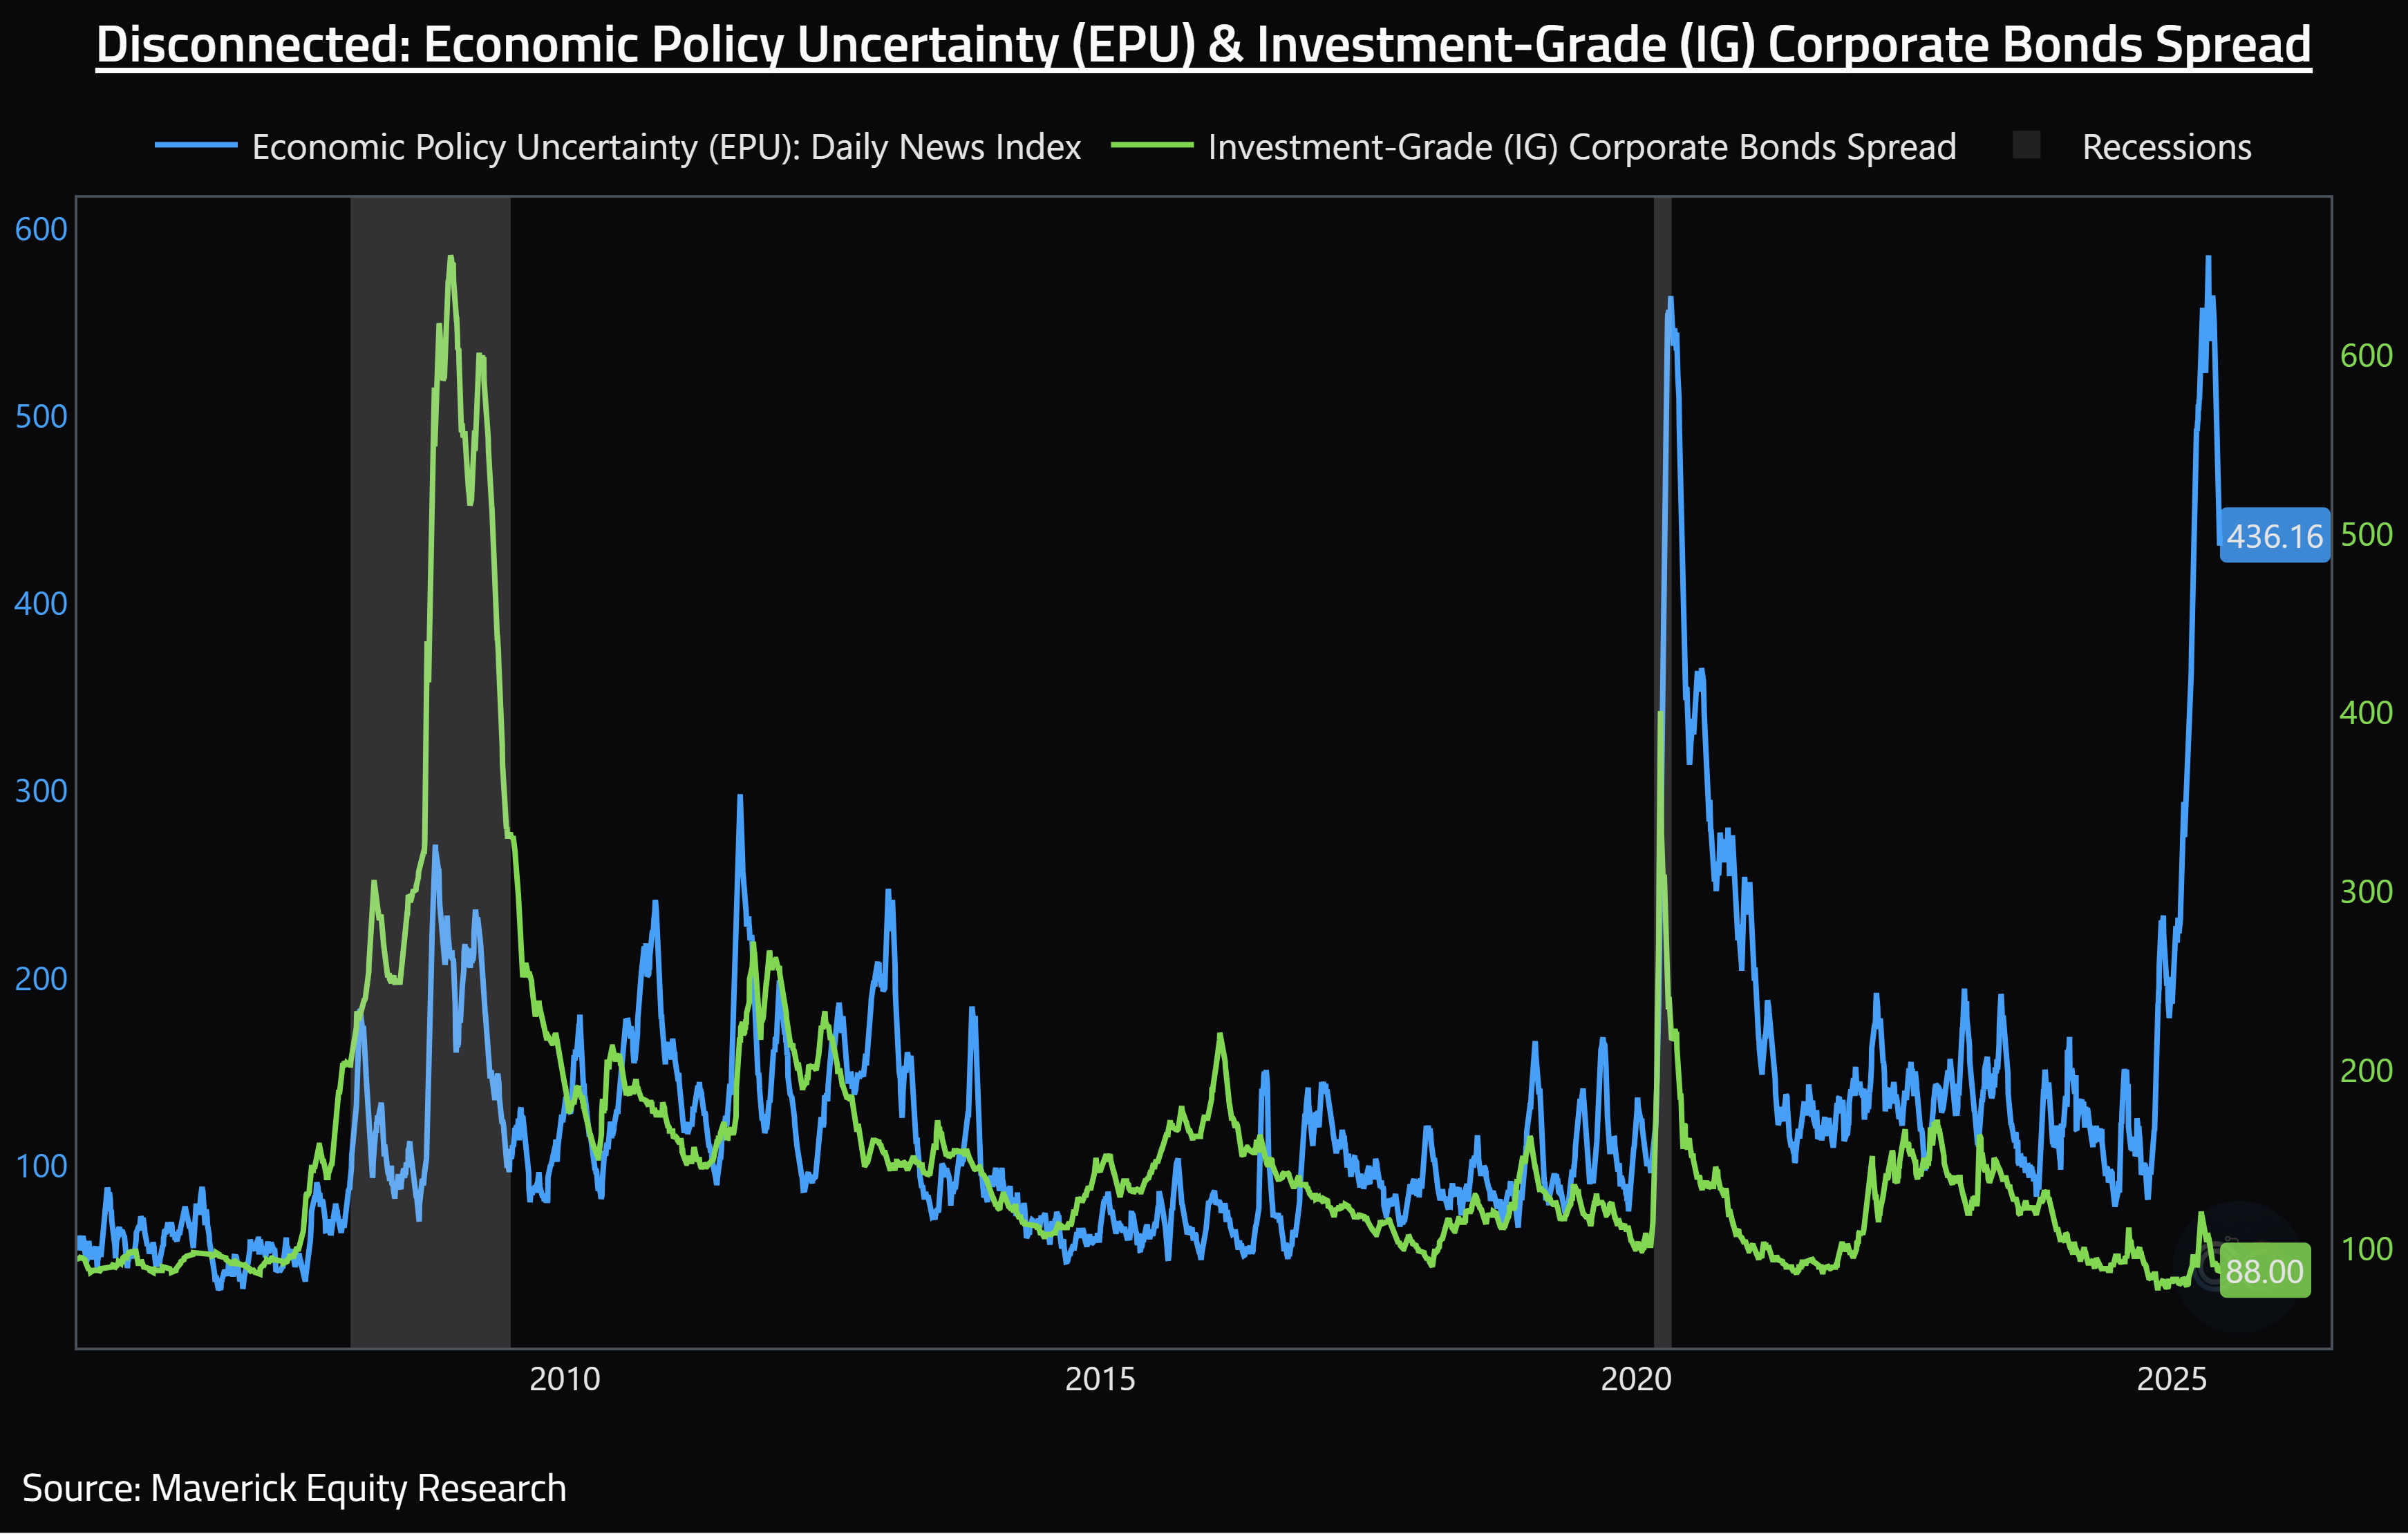
Disconnected: U.S. Economic Policy Uncertainty (EPU): Daily News Index (blue) & U.S. Investment Grade (IG) Corporate Bonds Spread (green), Recessions (grey):
👉 IG bond spreads at 88 back to BELOW pre-Liberation/Tariff Day (2nd of April)
👉 Economic Policy Uncertainty (EPU) index cooling off also at 436 (from a 585 peak)
As I was providing guidance on the 17th of April via the Maverick Special Report:
“Policy Uncertainty ≠ Policy Outcome (more likely = quite a circus or silly show)“
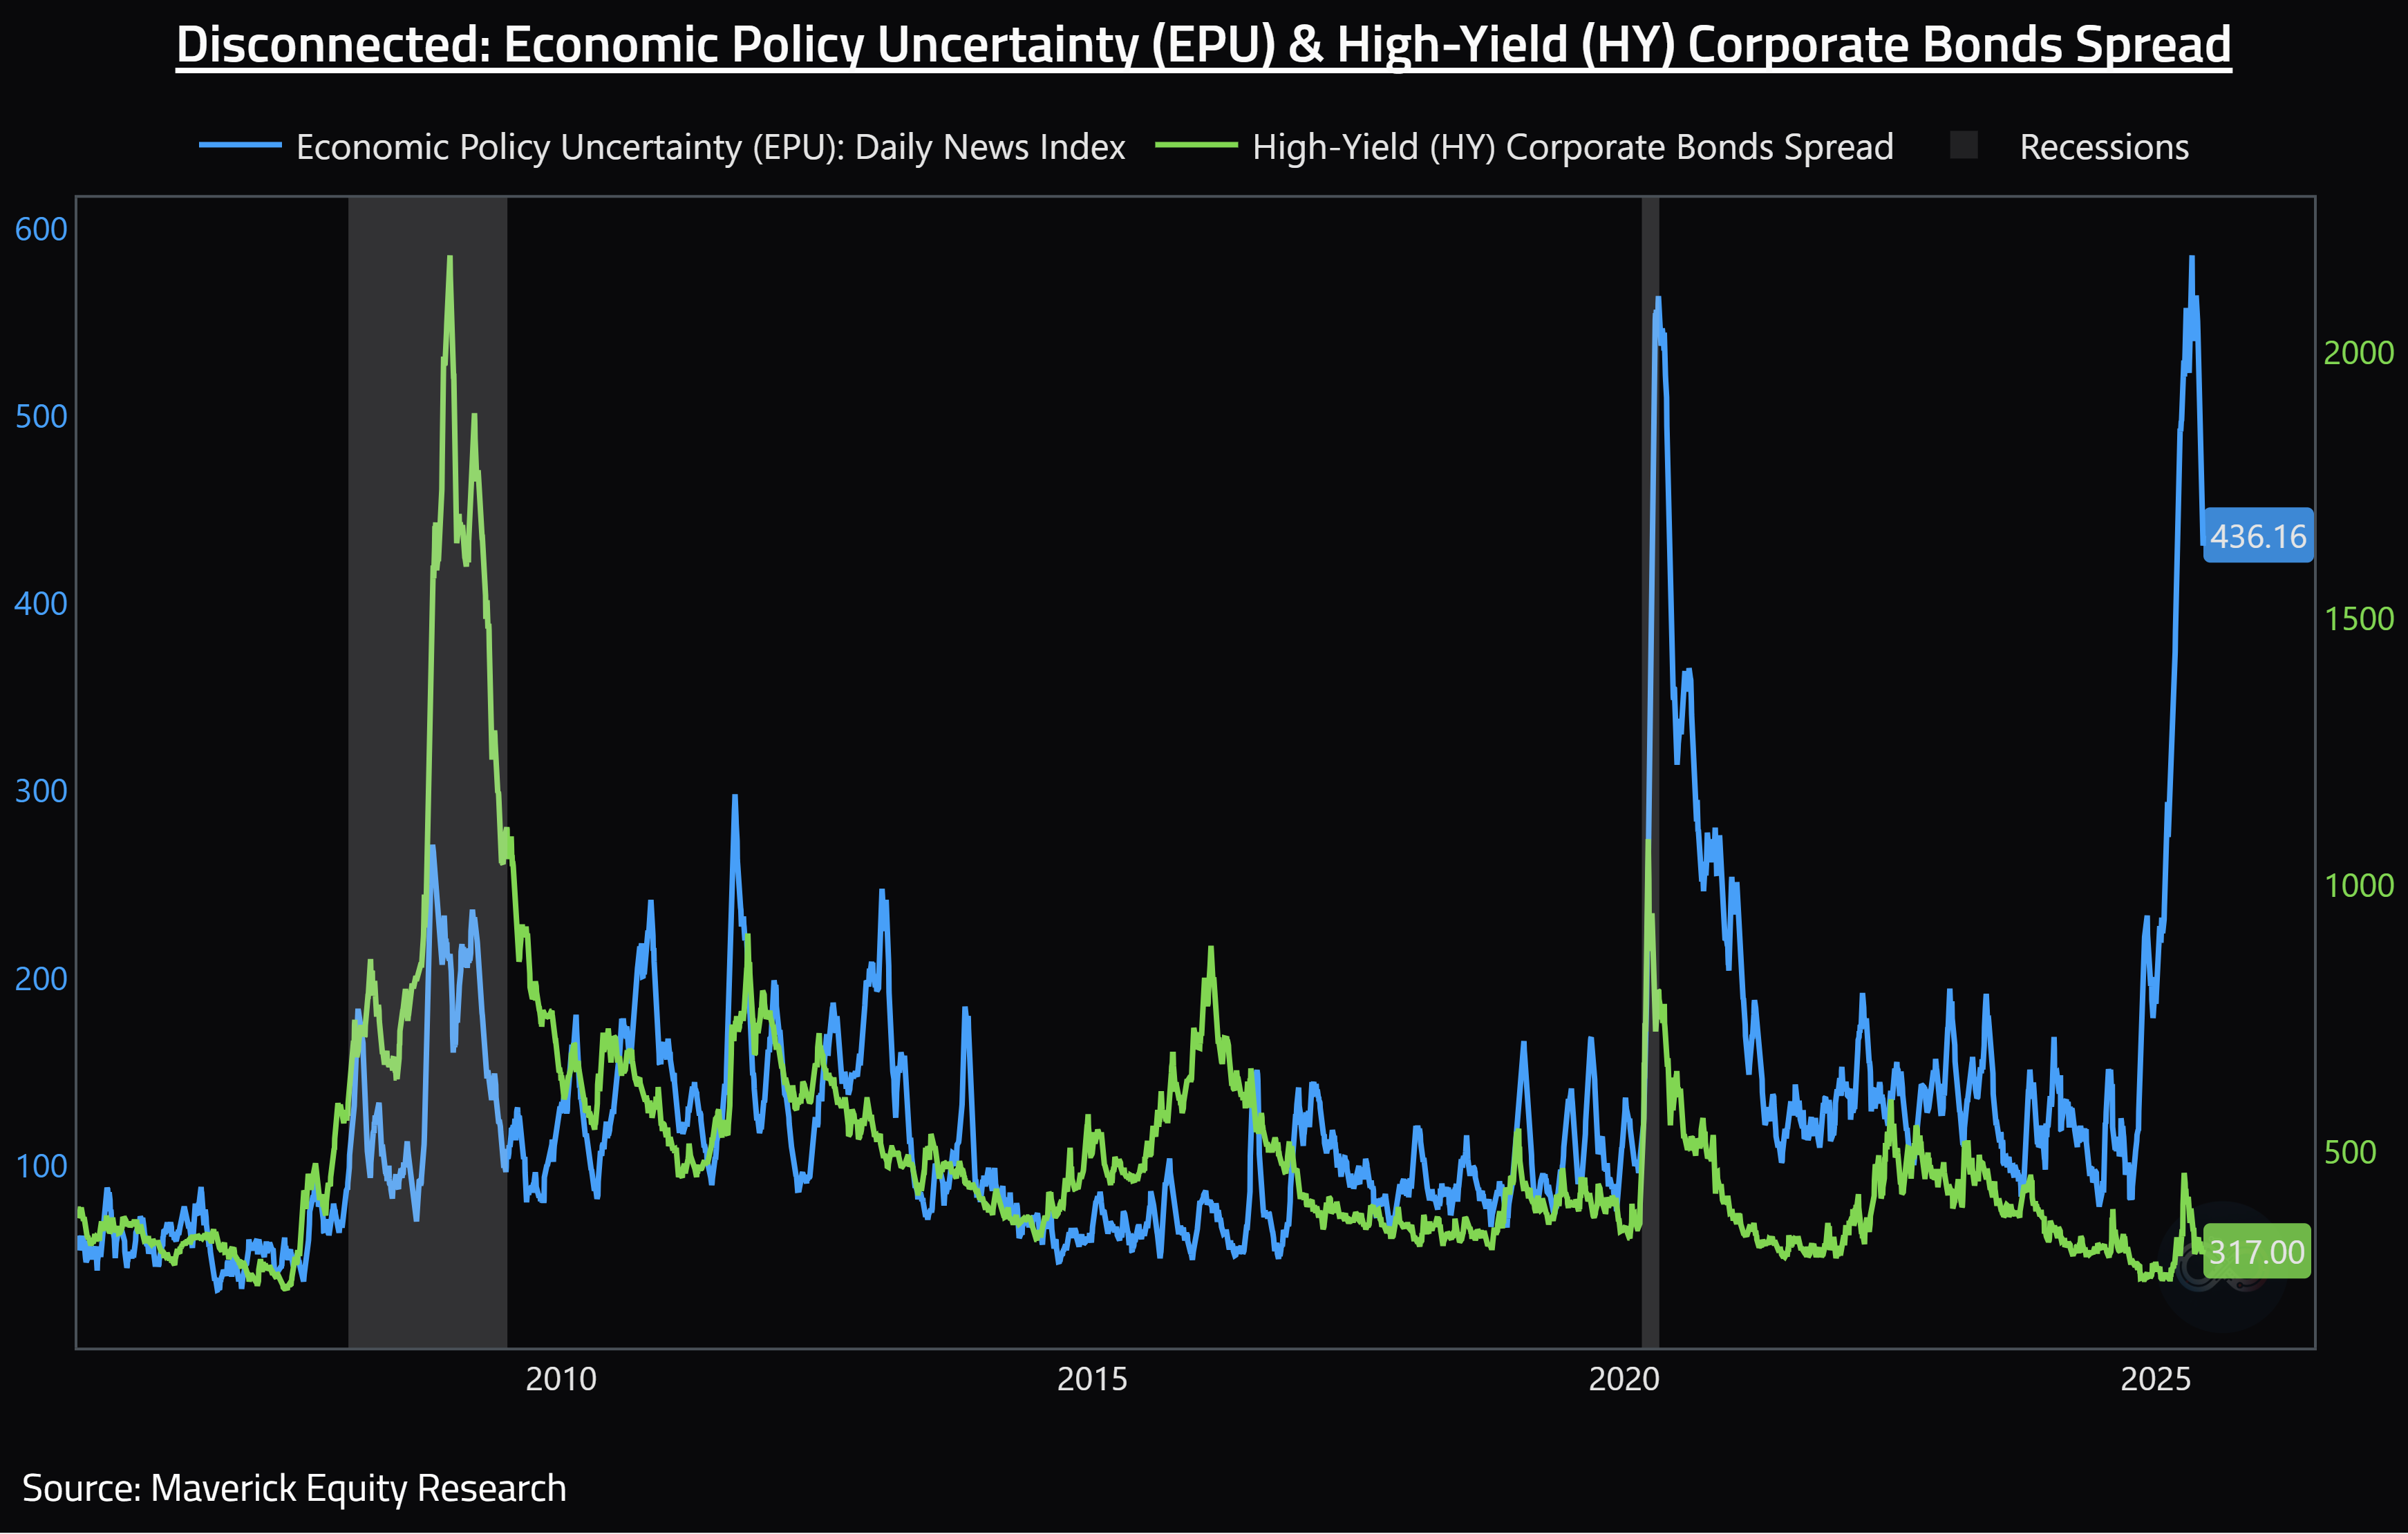
Disconnected: U.S. Economic Policy Uncertainty (EPU): Daily News Index (blue) & U.S. High Yield (HY) Corporate Bonds Spread (green), Recessions (grey):
👉 HY bond spreads at 317 back to BELOW pre-Liberation/Tariff Day (2nd of April)
👉 Economic Policy Uncertainty (EPU) index cooling off also at 436 (from a 585 peak)
For way more in terms of my key rationale during those first 2 hectic weeks, there it is:
✍️ Maverick Special Report #5: Disconnected - Economic Policy Uncertainty & Corporate Bonds Spread (IG & HY) (especially the section with the takeaways and mindset overall)
In short:
as long as spreads don’t go up parabolically, overall things are quite fine - note: surely as well that this it is not the single thing to monitor …
you will also find there a recall with exactly the playbook I foresaw and happened right after: negotiations, kick the can down the road, blame the FED …
as always, being cool, calm and collected is and will always be key …
N.B. key metrics to watch do change naturally in time, while for the future you can expect that I’ll provide you various key updates via the following Maverick mantra:
“What to watch during this volatile period? A key metric & Maverick Chart = 10,000 words!“
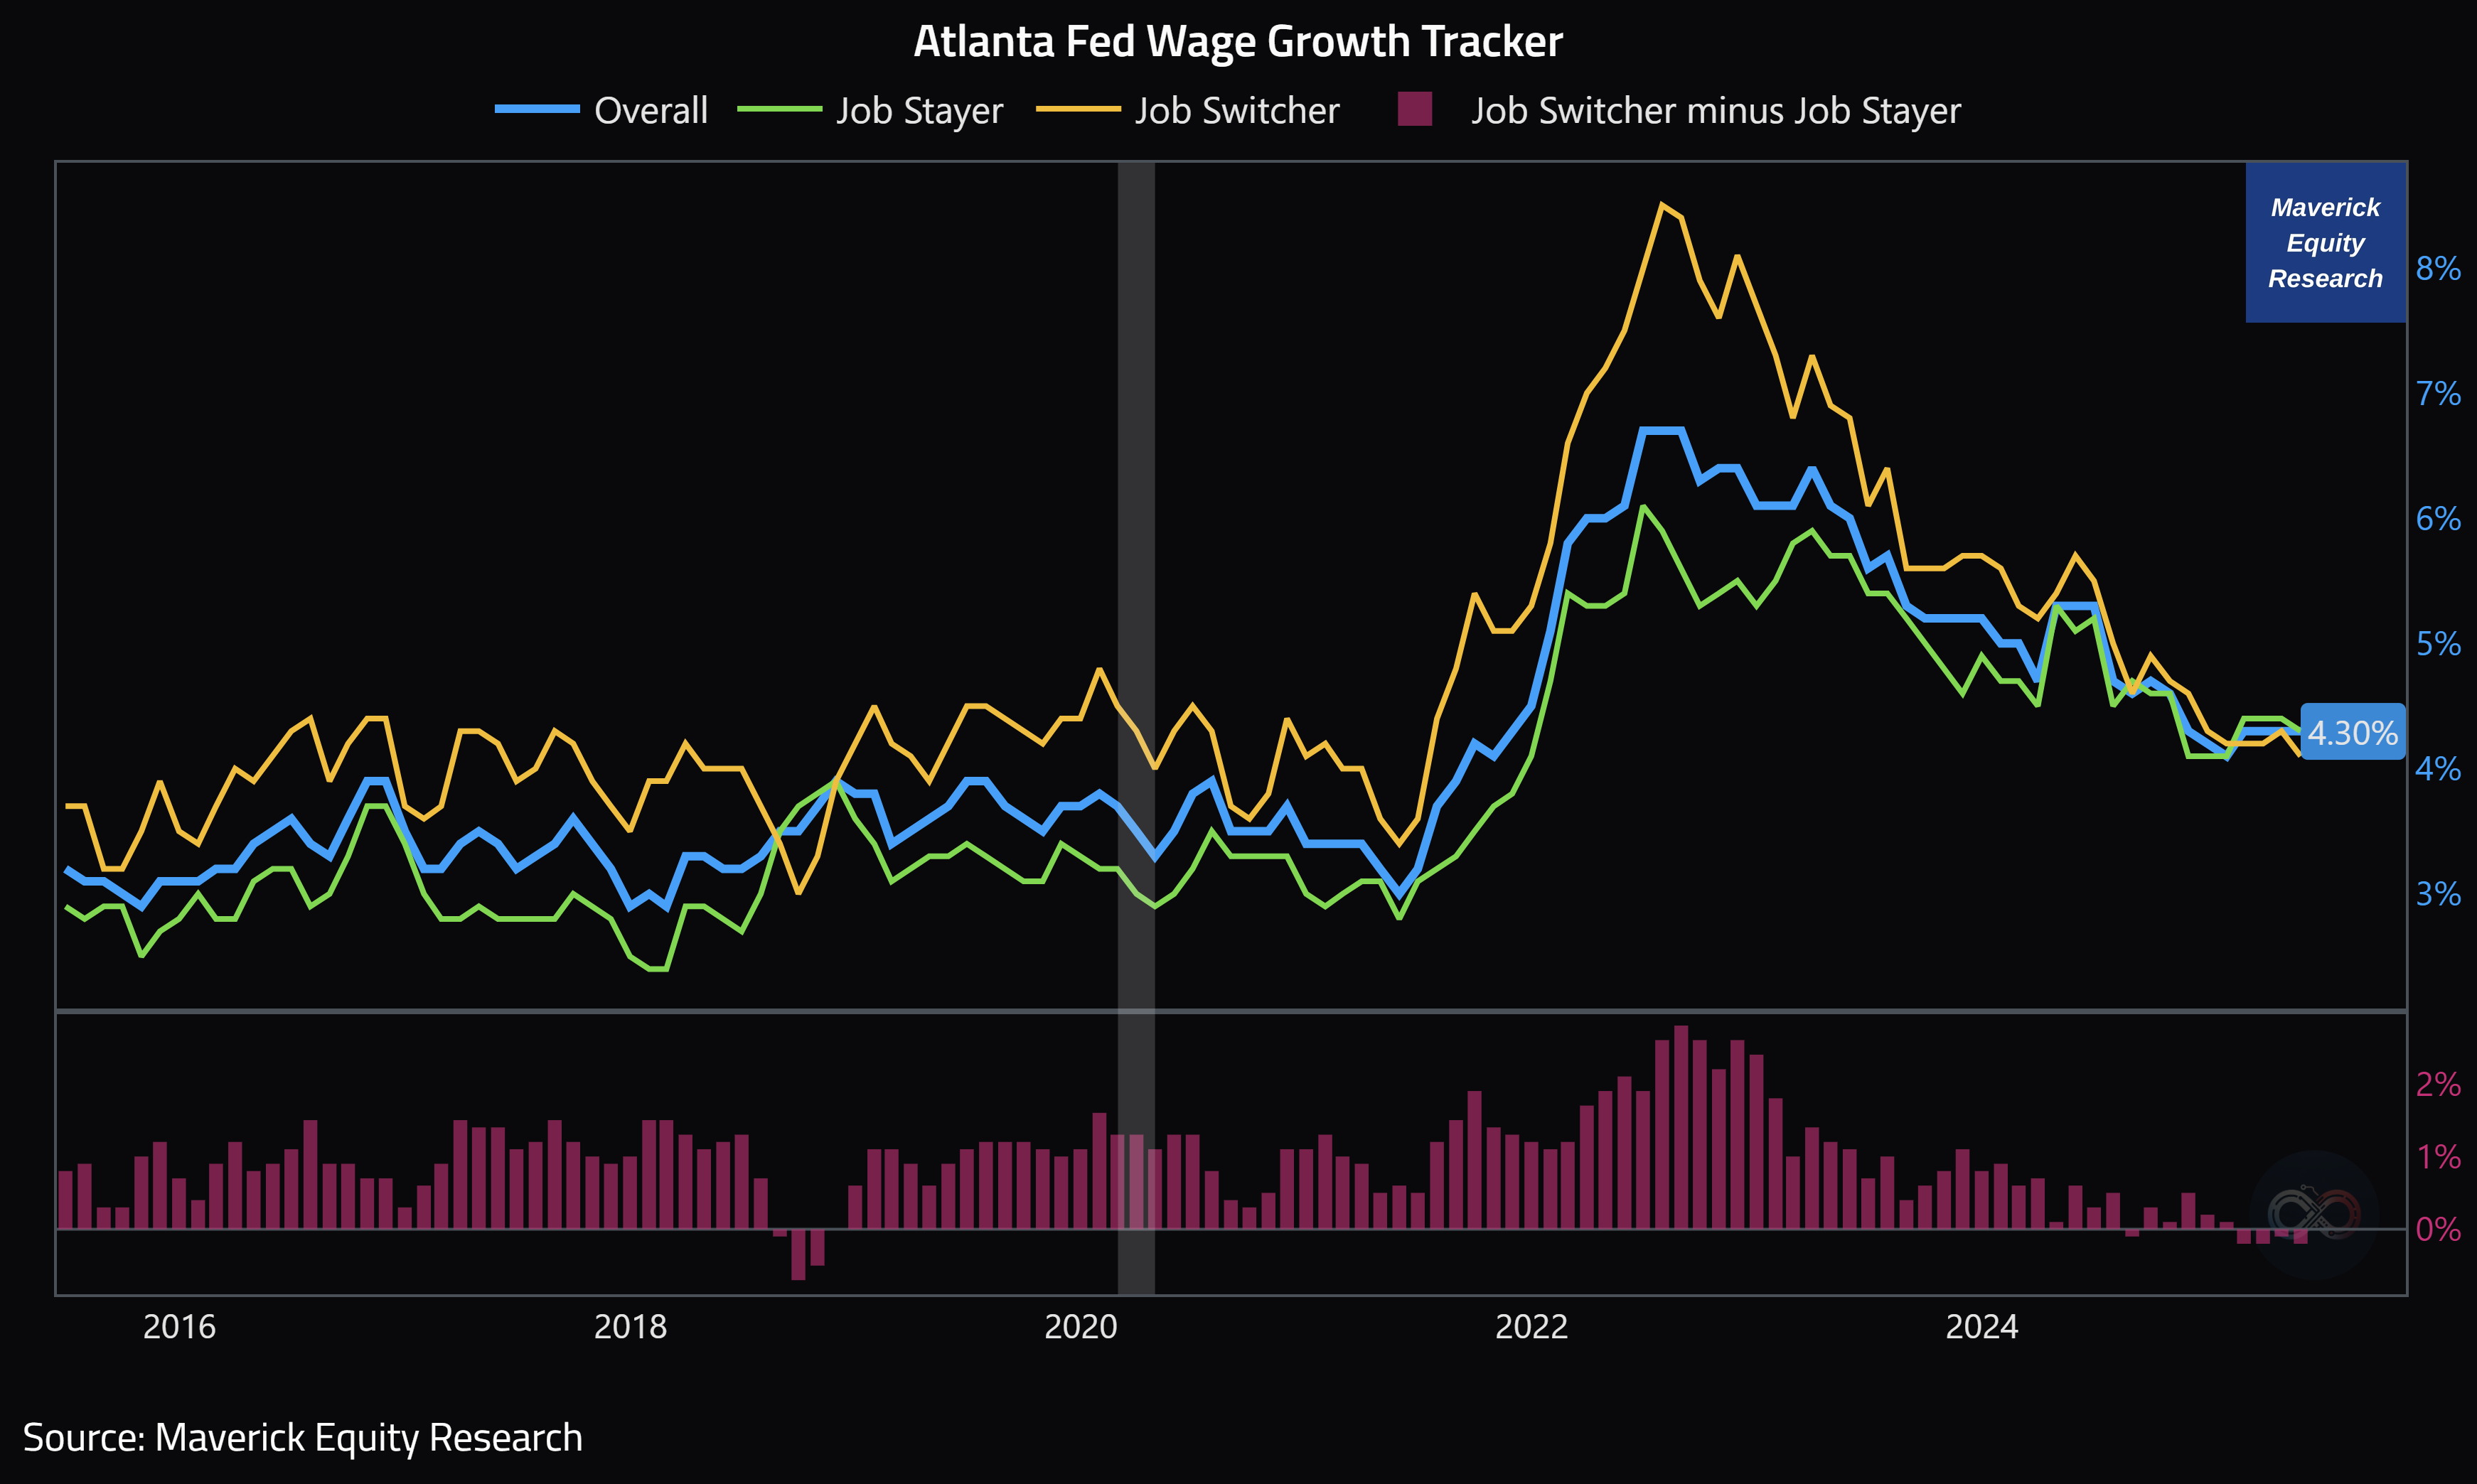
U.S. Wage Growth Tracker via Atlanta FED - after hot, a stabilisation period:
👉 4.3% unchanged in May (blue) - note, way above the 2.4% CPI = REAL wage growth
👉 for job switchers (yellow) wage growth declined from 4.3% to 4.1%, while for job stayers (green) declined from 4.4% to 4.3%
👉 Job Switchers minus Job Stayers = slightly negative as expected in a cooling labor market from a very hot one - people enjoying/appreciating the same job these days
Maverick’s take:
👉 wage growth trending down as expected towards before 2020 pre-covid & pre-unexpected inflation spike levels: 2021-2024 very likely outliers
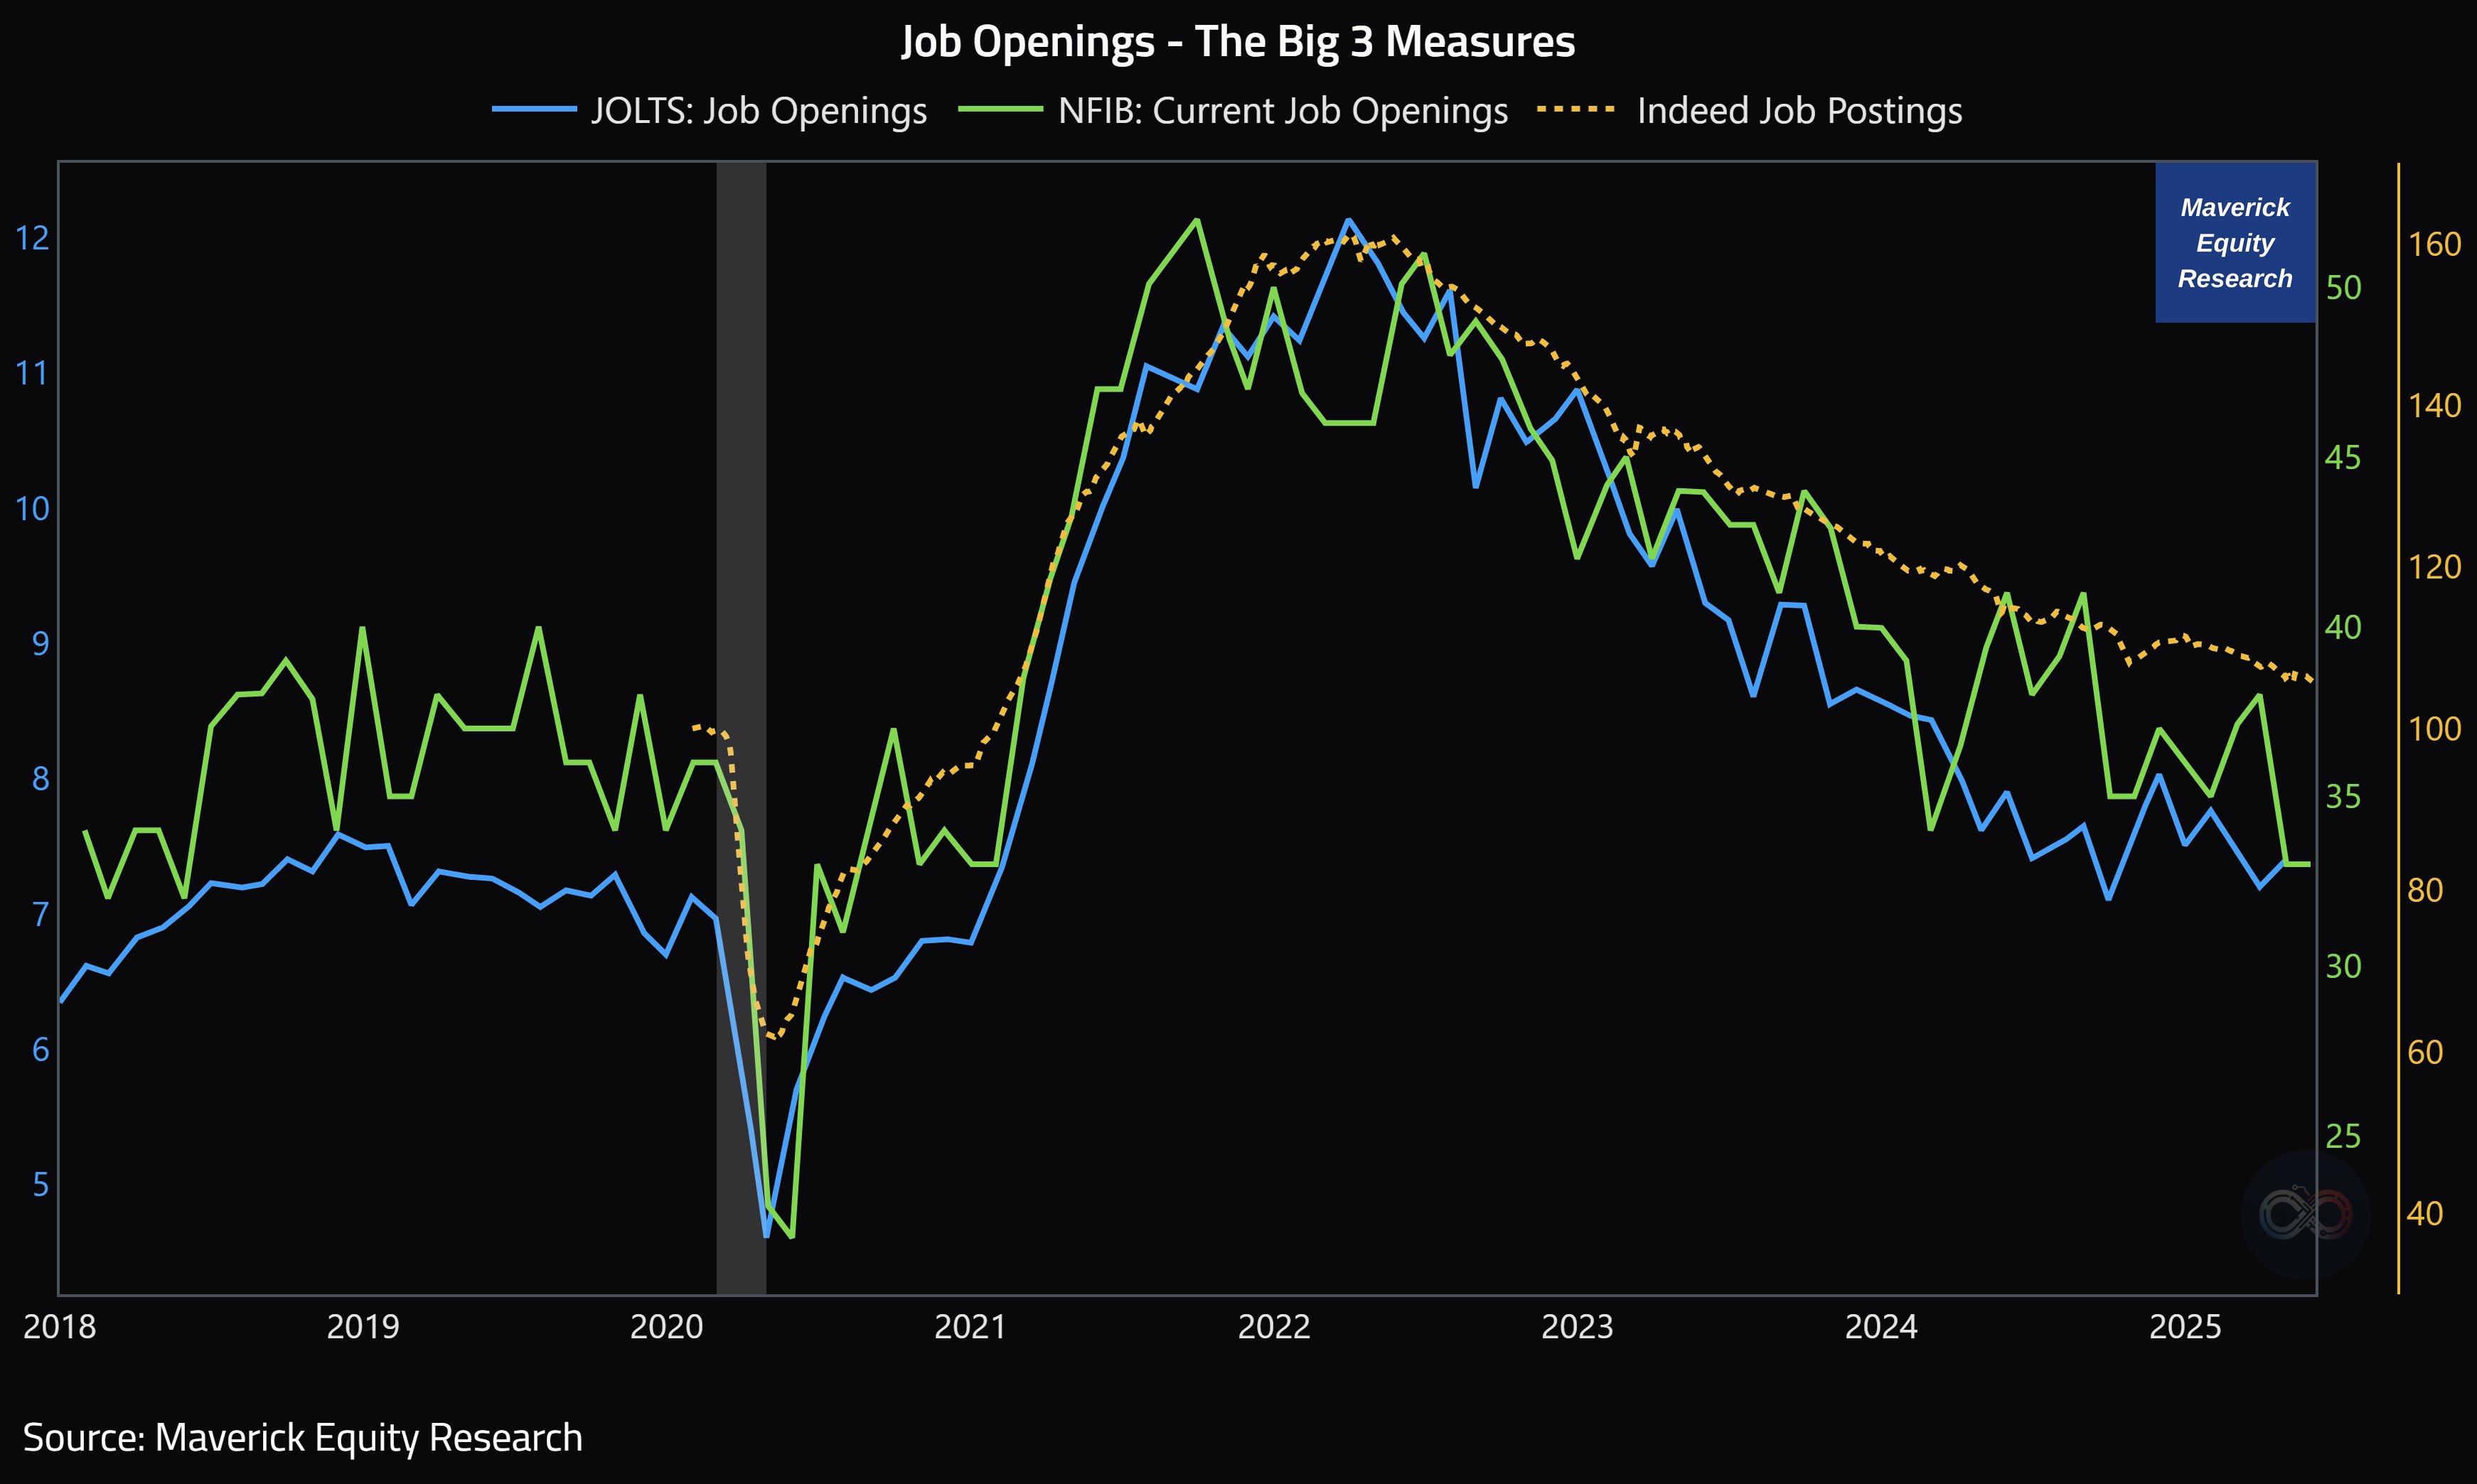
What about Job Openings as a very complementary dataset to Wage Growth?
👉 all the Big 3 Job Openings Measures (JOLTS, NFIB and Indeed) in one Maverick chart: they do reinforce each other and confirm the cooling/stabilising labor market
👉 the previous very hot labor market with plenty of jobs explains also how people could get consistently high wage growth (even above CPI levels)
Way more on the U.S. economy with a view on both the short and long-term via my dedicated report which is work in progress and coming with further improvements!
✍️ The State of the US Economy in 75 Charts, Edition #4
📊 S&P 500: Earnings & Revenue Growth + Earnings Calls Chatter 📊
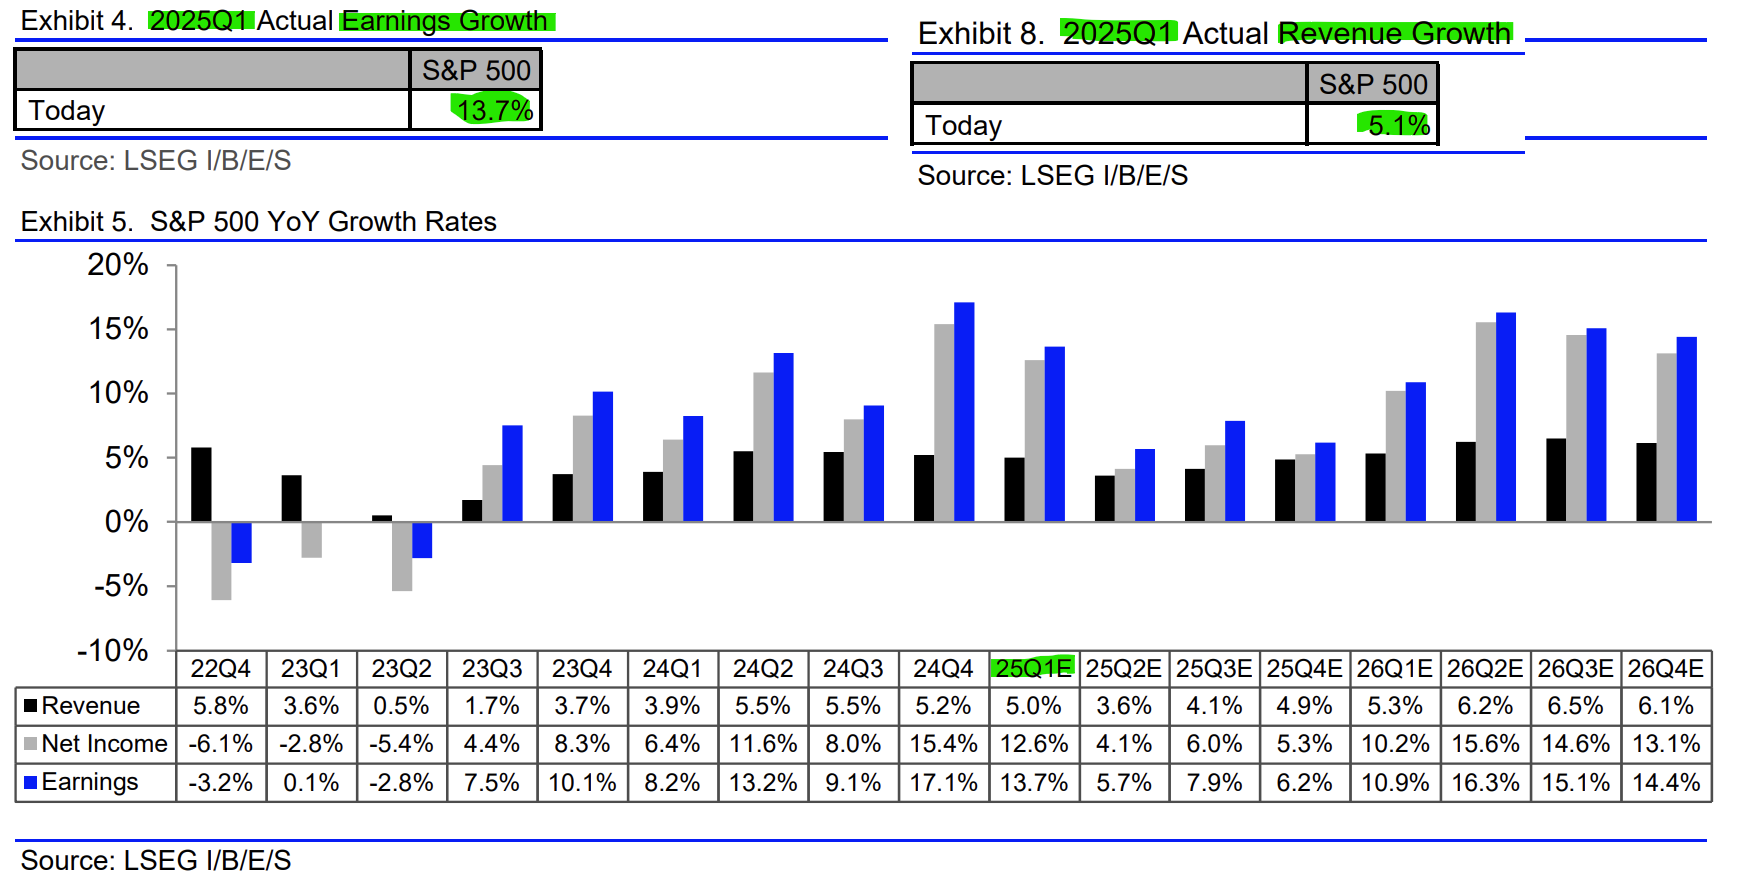
S&P 500 Q1 2025 Earnings & Revenue growth scorecard (fresh, June 13th):
👉 earnings growth +13.7% (not bad ... at all ...)
👉 revenue growth +5.1% (not bad ... at all either ...)
N.B. Tariffs/Trade war effects to be seen rather in Q2/Q3 - to be covered in more detail via my 2025 distinct S&P 500 comprehensive reports which will get more even more improvements (both structure + insights), and with some special metrics you rarely see!
✍️ S&P 500 Report #6: Valuation, Fundamentals & Special Metrics
✍️ S&P 500 Report #6: Performance, Profitability, Sentiment & More
S&P 500 Q1 2025 Earnings calls chatter:
6 & 7. AI edition: how many companies cite “AI“?
👉 +40% of S&P 500 companies cited “AI” for the 5th straight quarter
👉 less than the top from Q4 2024, though quite similarly like in the last 6-8 quarters

👉 sectors wise, top 3 %: tech, communication services and financials

8, 9 & 10. Inflation edition: are more S&P 500 companies citing “Inflation” in Q1 via concerns as what the tariffs effects might be? No, not really, at least not for now:
👉 228, the same number in the last 5 quarters, and also marks the 5th straight quarter in which less than 250 S&P 500 companies cited it
👉 below the 5-year average of 254 (well above the 10-year average of 189)

👉 would you be surprised that they just follow the CPI? 😉 There you go:

👉 sectors wise, top 3 %: Consumer Staples, Materials and Consumer Discretionary

Research is NOT behind a paywall and NO pesky ads here unlike most other places!
Did you enjoy this by finding it interesting, saving you time and getting valuable insights? What would be appreciated?
Just sharing this around with like-minded people, and hitting the 🔄 & ❤️ buttons! That’ll definitely support bringing in more & more independent investment research: from a single individual … not a corporate, bank, fund, click-baity media or so … !
Like this, the big positive externalities become the name of the game! Thank you!
Have a great day! And never forget, keep compounding: family, friends, hobbies, community, work, independence, capital, knowledge, research and mindset!
With respect,
Mav 👋 🤝

Thank you!