


✍️ Maverick Charts of the Week #8: Markets & Trade War, Switzerland, Money Market Funds, S&P 500, YouTube, S&P Global & Snowflake
10 Maverick charts that say 10,000 words, one which already had +100,000 views + incoming Maverick-esque research

Dear all,
10 Maverick Charts of the Week that I diligently cherry picked for both data-driven insights + valuable food for thought!
Table of contents:
📊 Maverick Charts: Financial Markets & Trade War, Switzerland, Money Market Funds, S&P 500, YouTube, S&P Global, Snowflake
✍️ Incoming Maverick-esque research!
Delivery is in typical fashion, via Maverick charts that say 10,000 words or more!
📊 Maverick Charts: Financial Markets & Trade War, Switzerland, Money Market Funds, S&P 500, YouTube, S&P Global, Snowflake 📊
2025 thematic of the year so far without a doubt - the voice of the narrator:
👉 ‘What is driving the markets in 2025 Mav’? The U.S./POTUS trade war
👉 ‘We know that Mav, can you visualise it via your Maverick charts that say 10,000 words?’
Sure! 2025 chart of the year candidate: both the S&P 500 & U.S. 10-year yield (blue) driven by the Trade War Intensity tracker (green, dotted, inverted)! The latest:
May 23: POTUS “recommending a straight 50% Tariff on the EU” from June 1st saying trade negotiations stalled - Trade War Intensity tracker has re-intensified
May 25: POTUS announced that the 50% tariffs on EU will be postponed to July 9 - Trade War Intensity tracker eased

👉 Maverick forward looking view on Financial Markets and the Trade War:
trade war topic and impact on the markets will be a central theme in 2025
a key question: how long (months) it takes on average for the U.S. to sign a trade deal? What about time to implement it once done? 18 months with 45 months - likely to happen faster in the current setup, but except volatility going forward: quite likely not going away very soon, maybe easing off a bit going into the 4th quarter
clearly a key Maverick chart to watch in 2025 which already had +100,000 views as I did post it on Twitter/X occasionally … which I’ll update here going forward …
Global Returns Leaderboard since Trump election (11/5/2024) - assessing the impact of the new POTUS policies & narrative/talk via global winners & losers:
👉 Winners: Bitcoin, German stocks, Gold and Euro Area stocks
👉 Losers: US Dollar, U.S. REITs, U.S. Small Caps, Crude Oil
N.B. naturally, it is not just POTUS that drove all those moves, yet a material factor …

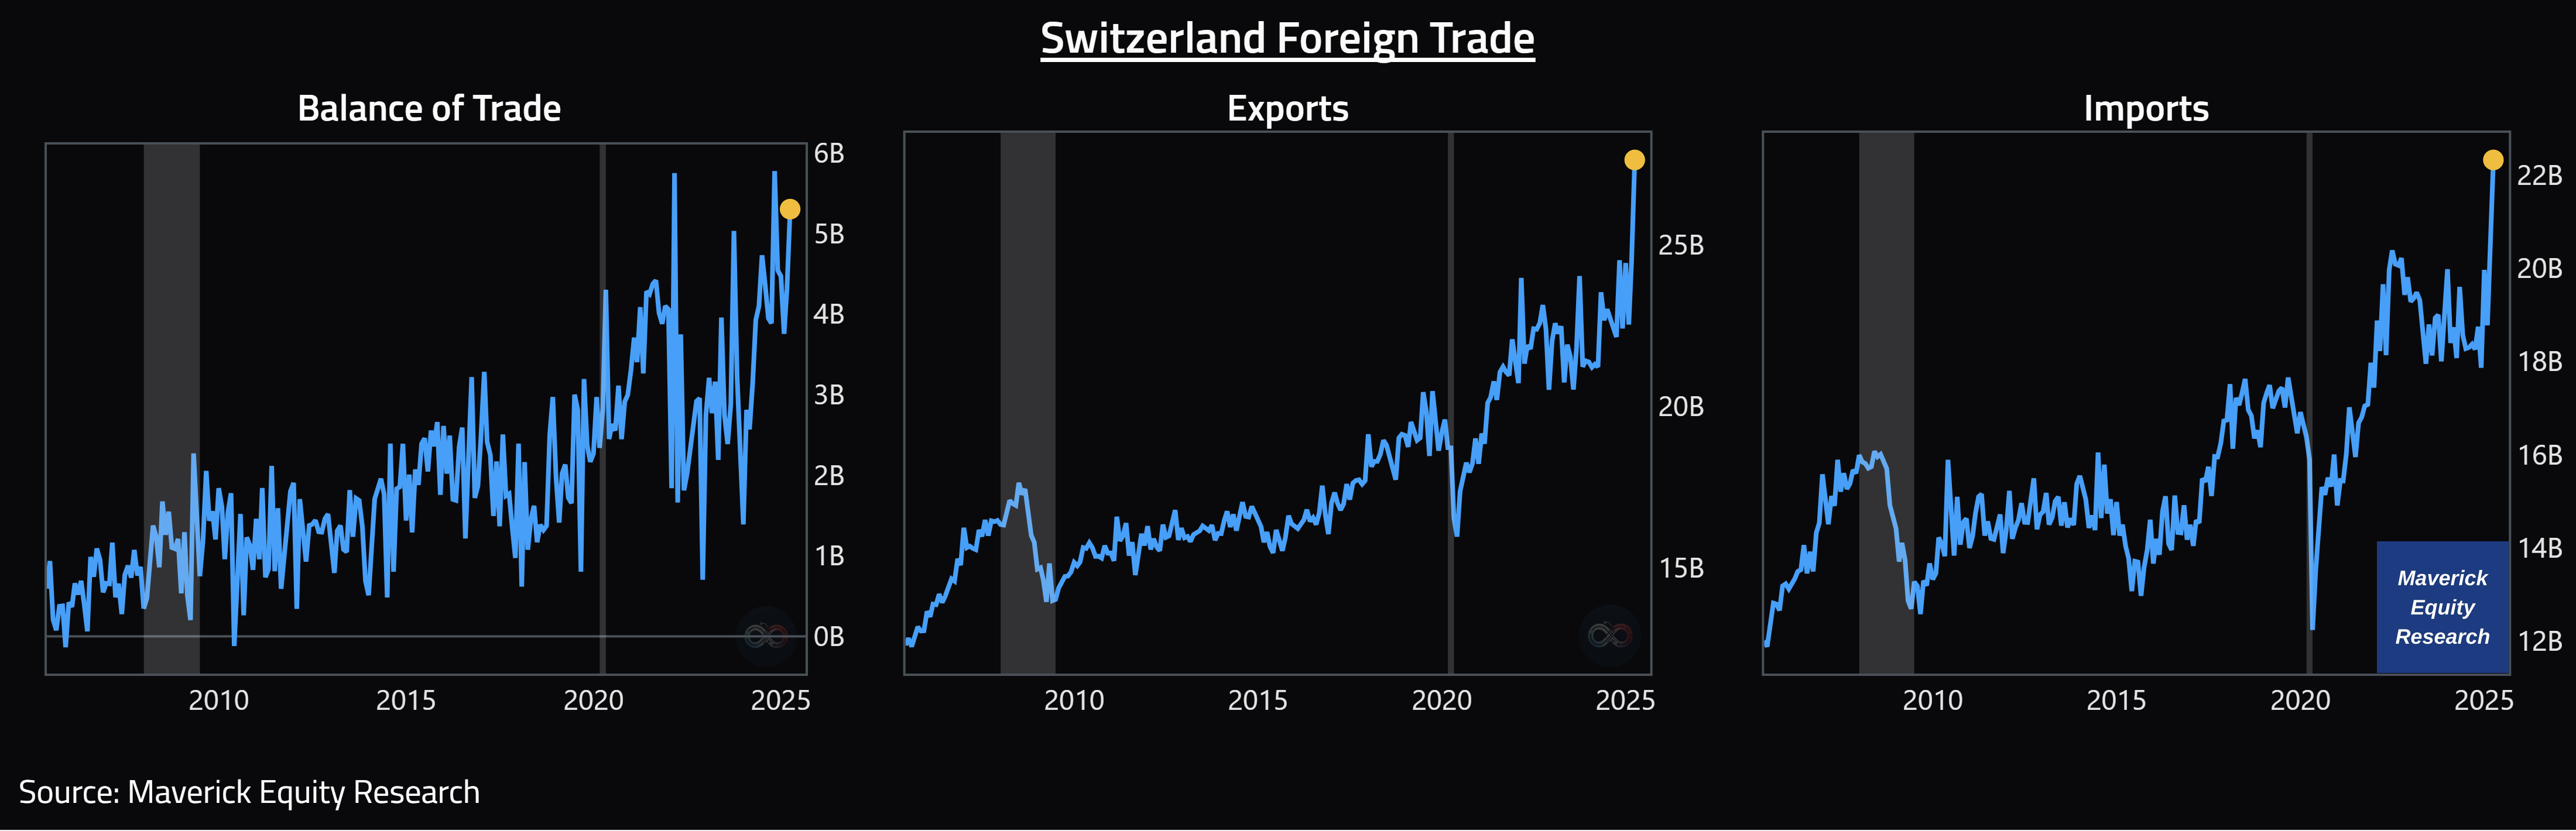
Switzerland Foreign Trade since 2005:
👉 looking very solid … with a positive $5.3 billion balance of trade
Switzerland Industrial Production since 2005:
👉 very solid also: growth is there, trending up and up
Just like I do with The State of the U.S. Economy reports, in the future I am thinking to cover in a similar fashion the Swiss economy as well - U.S. & Switzerland for the win! How does that sound to you? Let me know … !

U.S. Total Money Market Funds (MMFs) & FED Funds Rate:
👉 $7.24 trillion = a record, a vey solid dry powder - now the Risk Free rate gives a decent level of interest for the first time since 2007 (pre-GFC)
👉 with high interest rates, only normal for MMFs to increase (same the other way)
Key question = how long after the 1st cut from the FED do MMFs assets peak?
Answer: about 9 months looking at the past 5 cycles, in other words, inflows to MMFs continue for 9 months after that 1st FED interest rate cut

U.S. Retail Money Market Funds (MMFs) & FED Funds Rate:
👉 $2.18 trillion = also a record from Retail - a way better pay than bank deposits

S&P 500 Q1 Earnings Scorecard - freshly updated as of May 23rd:
👉 earnings growth +12.9% (not bad ... at all ...)
👉 revenue growth +4.7% (not bad ... at all either ...)
N.B. in 2025 my distinct S&P 500 comprehensive reports will get further improved, and this time materially with some special metrics you rarely see … stay tuned!
✍️ S&P 500 Report #6: Valuation, Fundamentals & Special Metrics
✍️ S&P 500 Report #6: Performance, Profitability, Sentiment & More

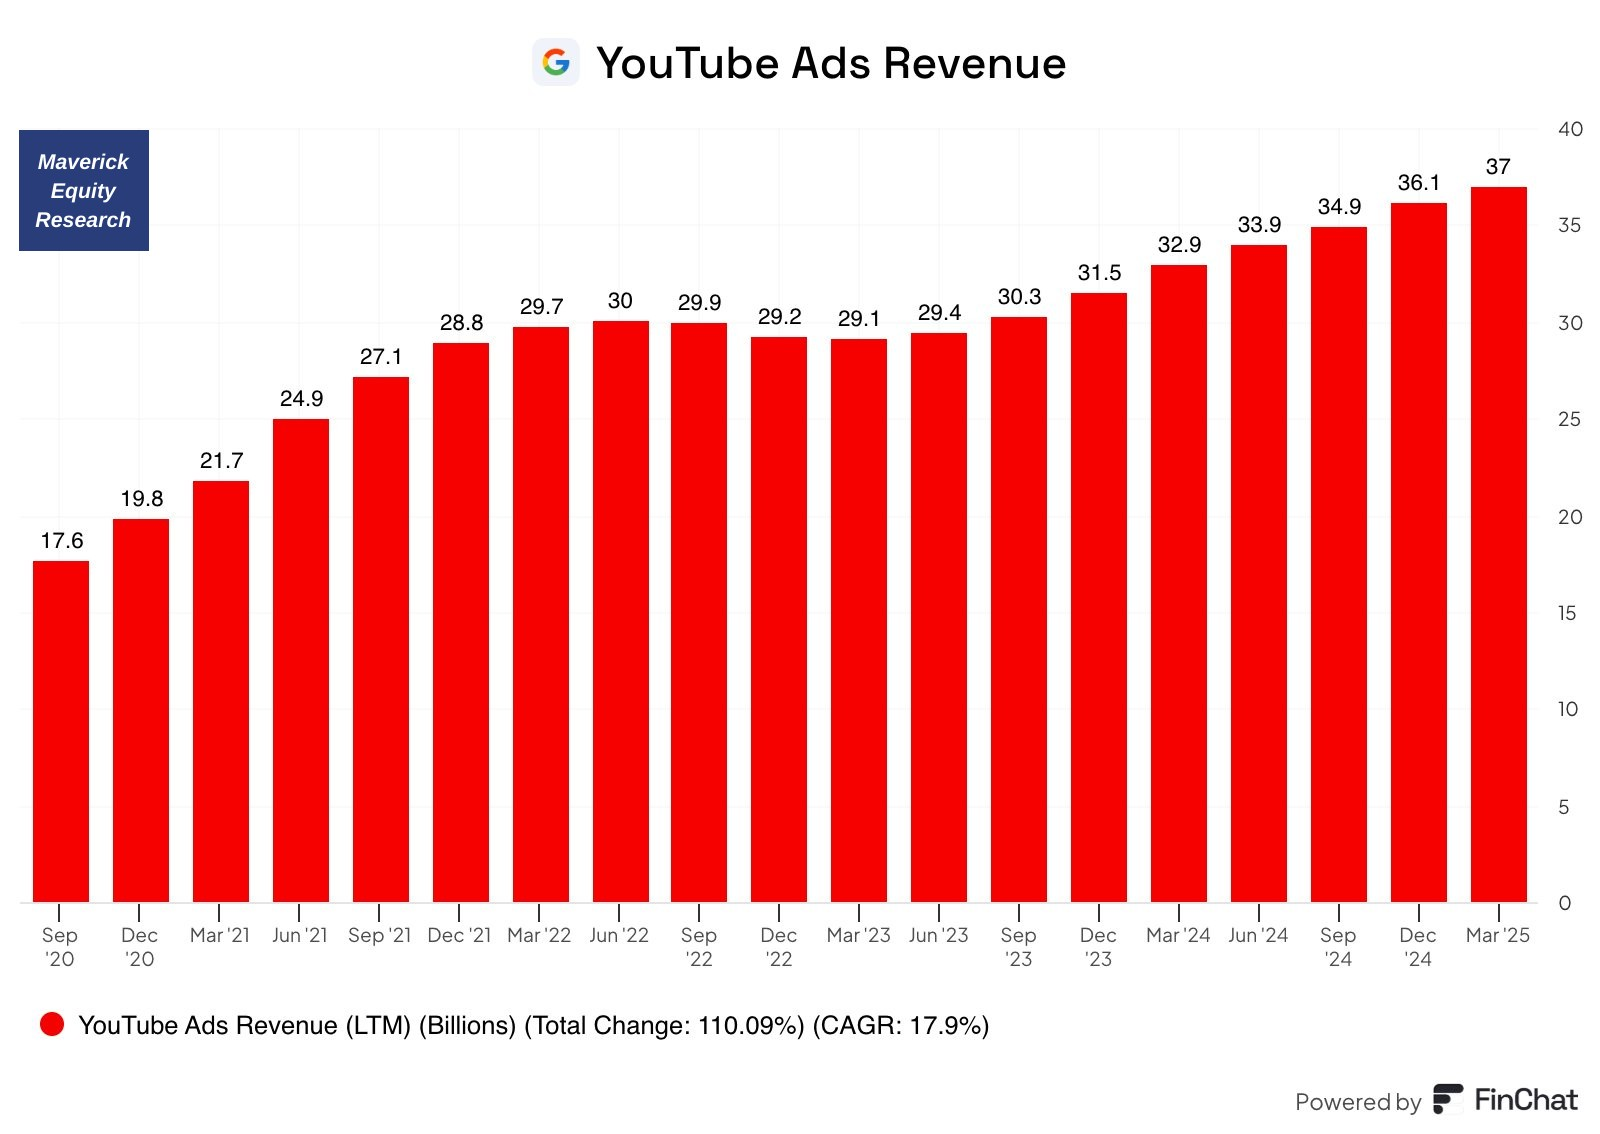
YouTube Ads Revenue - $17.6 bn in September 2020 to $30 bn in March 2025:
User Generated Content (0 production costs)
2nd largest search engine behind Google (owner) itself
100+ million Premium Subscribers
#1 brand in CTV for time spent
S&P Global (SPGI) - Indices division:
👉 known for its Ratings business, but its Indices division is a quite an unknown gem
👉 68% operating margins, Indices requires very little reinvestment in order to grow

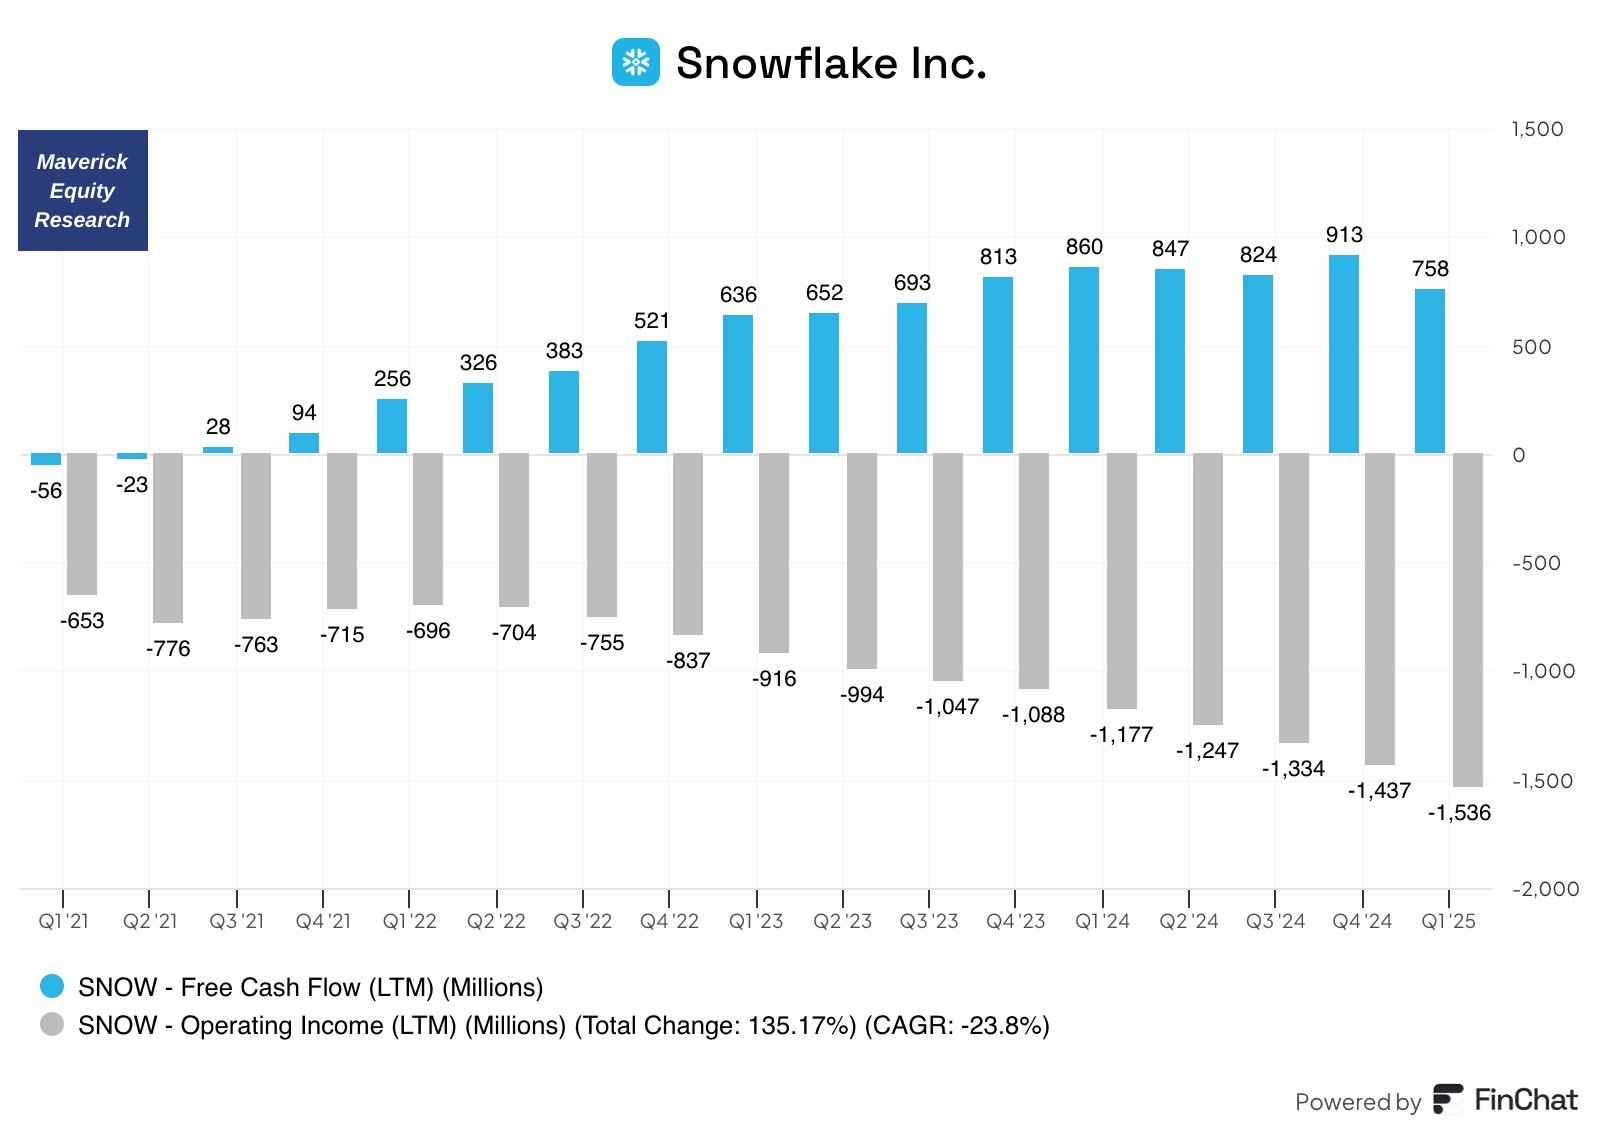
Snowflake (SNOW) - Free Cash Flow (FCF) vs. Operating Income:
👉 FCF very good trend, yet Operating Income very bad trend - why, what’s going on?
👉 Stock based compensation (SBC), the CAPEX of tech companies as I call it is quite a factor there …
👉 for now not really how a software company is supposed to scale, but let’s give it a bit more time …
✍️ Incoming Maverick-esque research! ✍️
What is coming next through the independent investment & economic research here? Many drafts are work in progress - below a few selected ones:
✍️ Full Equity Research
section start where I will cover in details single businesses/stocks aka deep dives
✍️ Why Independent Investment and Economic Research = Paramount Nowadays!
common sense is not so common, independent research for the win!
✍️ The State of the US Economy in 75 Charts, Edition #4
coming up with further improved coverage charts + recession probability metrics
✍️ Maverick Special Situation #7
how to hedge, lock in the gain or speculate on a very popular stock nowadays
✍️ S&P 500 Report #6: Valuation, Fundamentals & Special Metrics
coming up with further improved metrics via sleek Maverick charts as always
✍️ Maverick Special Report #7: Big Volatility & Drawdowns = Juicy Returns
the price for high returns = digesting and taking advantage of volatility
✍️ Maverick Special Report #8: U.S. Manufacturing = A Bad Wet & Fake Dream
manufacturing is romantic, but not realistic for good reasons for the U.S.
✍️ Maverick Special Report #7: Harvesting Geopolitical Risk Premium Through The 2025 Trade War
taking advantage of the ‘Trade War 2.0’ which drives volatility these days
✍️ Top 50 Maverick Charts to Watch in 2025 and Beyond
sleek Maverick charts with many insights & food for thought for now & the future
Research is NOT behind a paywall and NO pesky ads here unlike most other places!
Did you enjoy this by finding it interesting, saving you time and getting valuable insights? What would be appreciated?
Just sharing this around with like-minded people, and hitting the 🔄 & ❤️ buttons! That’ll definitely support bringing in more & more independent investment research: from a single individual … not a corporate, bank, fund, click-baity media or so … !
Like this, the big positive externalities become the name of the game! Thank you!
Have a great day! And never forget, keep compounding: family, friends, hobbies, community, work, independence, capital, knowledge, research and mindset!
With respect,
Mav 👋 🤝

Excellent work, as always