✍️ Maverick Charts - Stocks & Bonds - September 2023 Edition #11
30 Sleek charts that say 10,000 words ... save precious time & provide insight!
Dear all,
your monthly Top 25 Stocks & Bonds charts from around the world + 5 Bonus!
US Stocks & Bonds in 2023: stocks good, bonds punished except short term ones
👉 Nasdaq 100 (QQQ) with a new bull market, +33.61% in 2023 alone
👉 S&P 500 (SPY) with a new bull market, +11.31% in 2023 alone
👉 SHV (short-term government bonds 1-year or less, cash proxy) +3.58%
👉 IEF (intermediate-term government bonds 7-10 year maturities) -4.17%
👉 TLT (long-term government bonds 20-year+ maturities) -12.47%
👉 AGG (investment grade: treasuries, corporate, MBS, ABS, munis) -2.45%
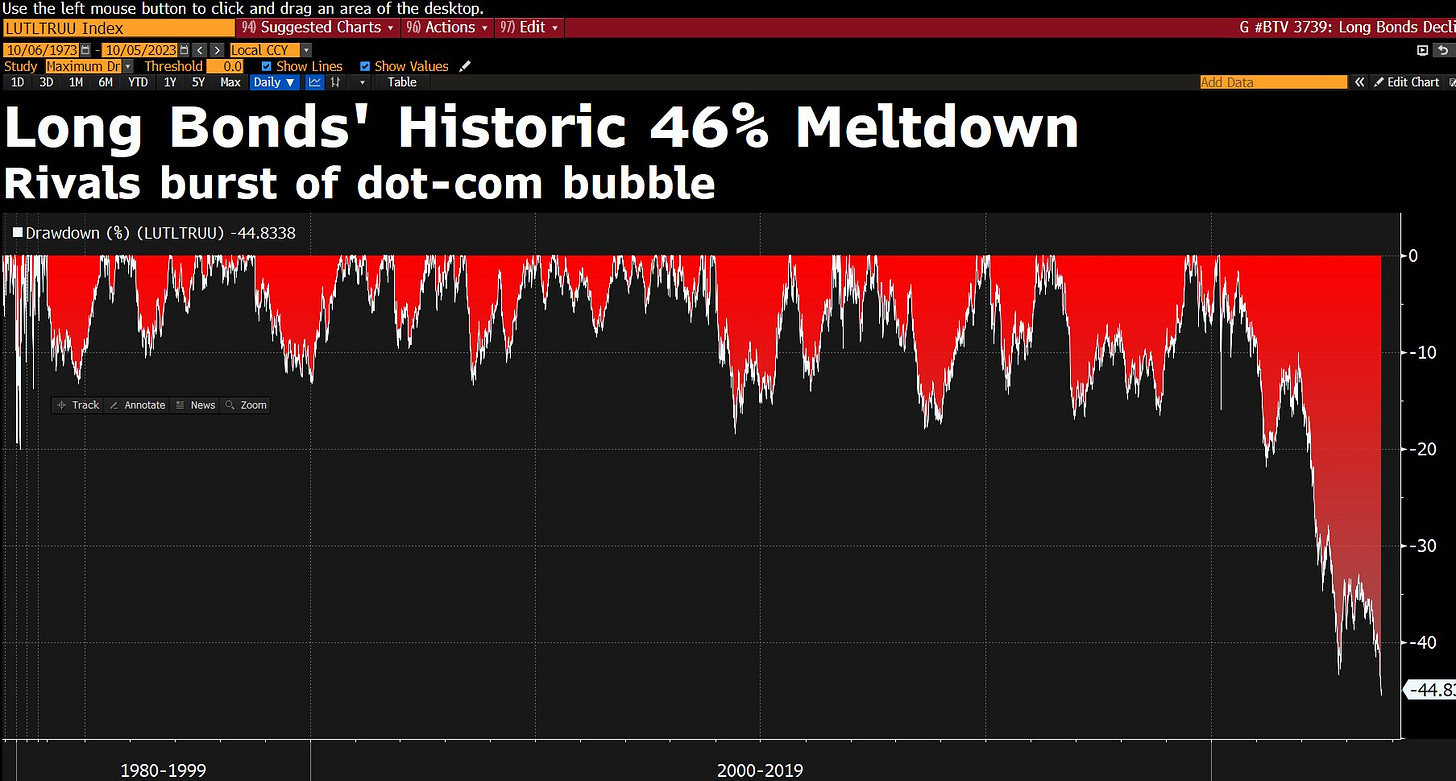
A big talking point in the world of bonds is TLT, that’s 20+ Year Treasury Bonds
since ketchup inflation came to town, FED naturally hiked rates and did so via the fastest rate hiking cycle in 4 decades
TLT aka long term bonds getting hammered more & more, but rather sooner than later I will watch and join the opportunity here
yet, crazy inflows keep coming into the ETF with $16 billion in 2023 alone, which ranks in the 2nd place ETF inflows, only VOO (S&P 500) attracting more flows
Similar drawdown when we look at US bonds maturing in 10 years or more:
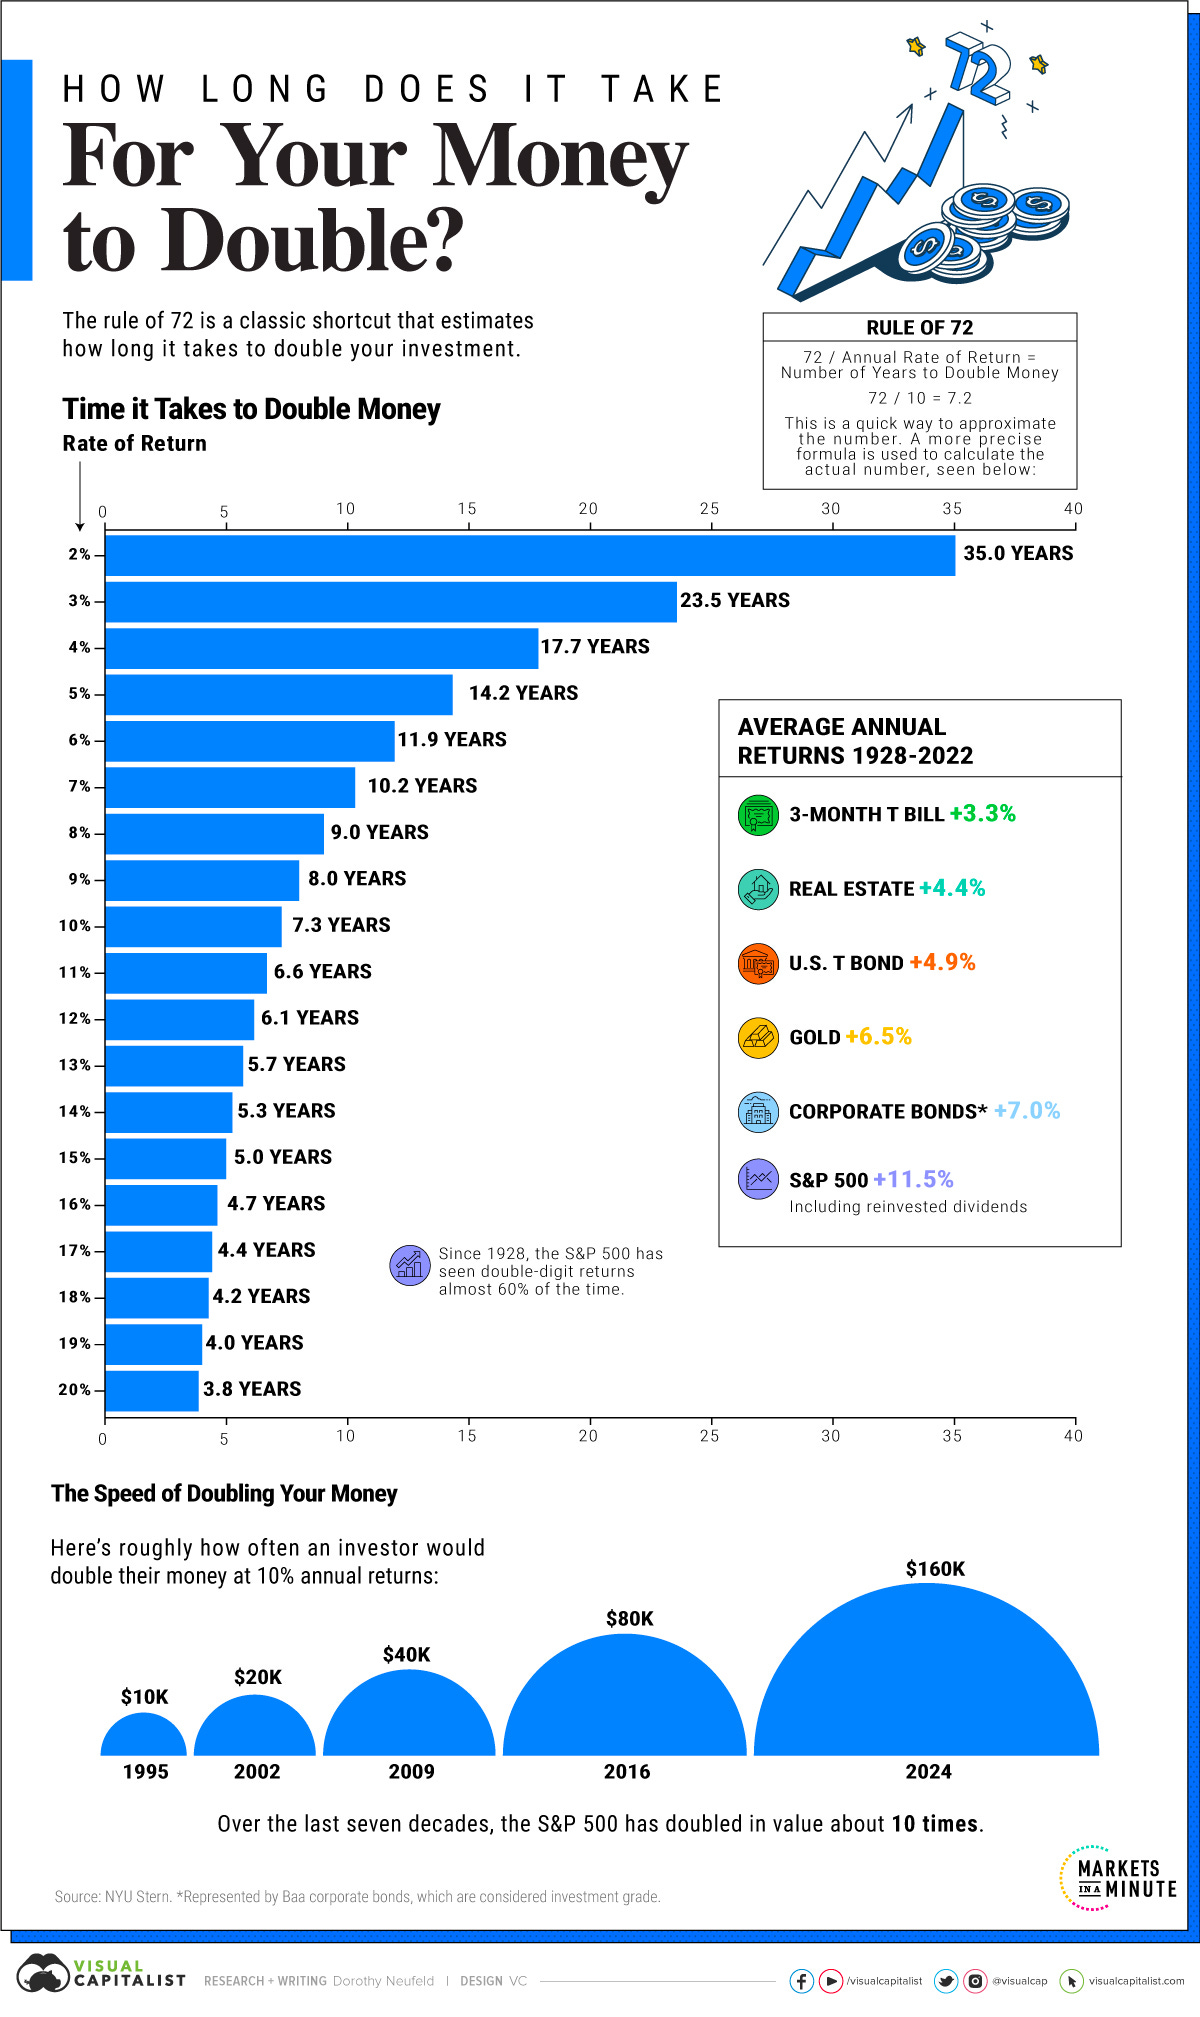
Reminder: how long does it take to 2x your money for any given rate of return?
one can aim for 5-15% CAGR (can be more) depending on many factors that will be subject of a distinct and more detailed coverage
‘spoiler alert’: lower is not necessarily less good and higher is not necessarily better, investing is very personal, like very very very…
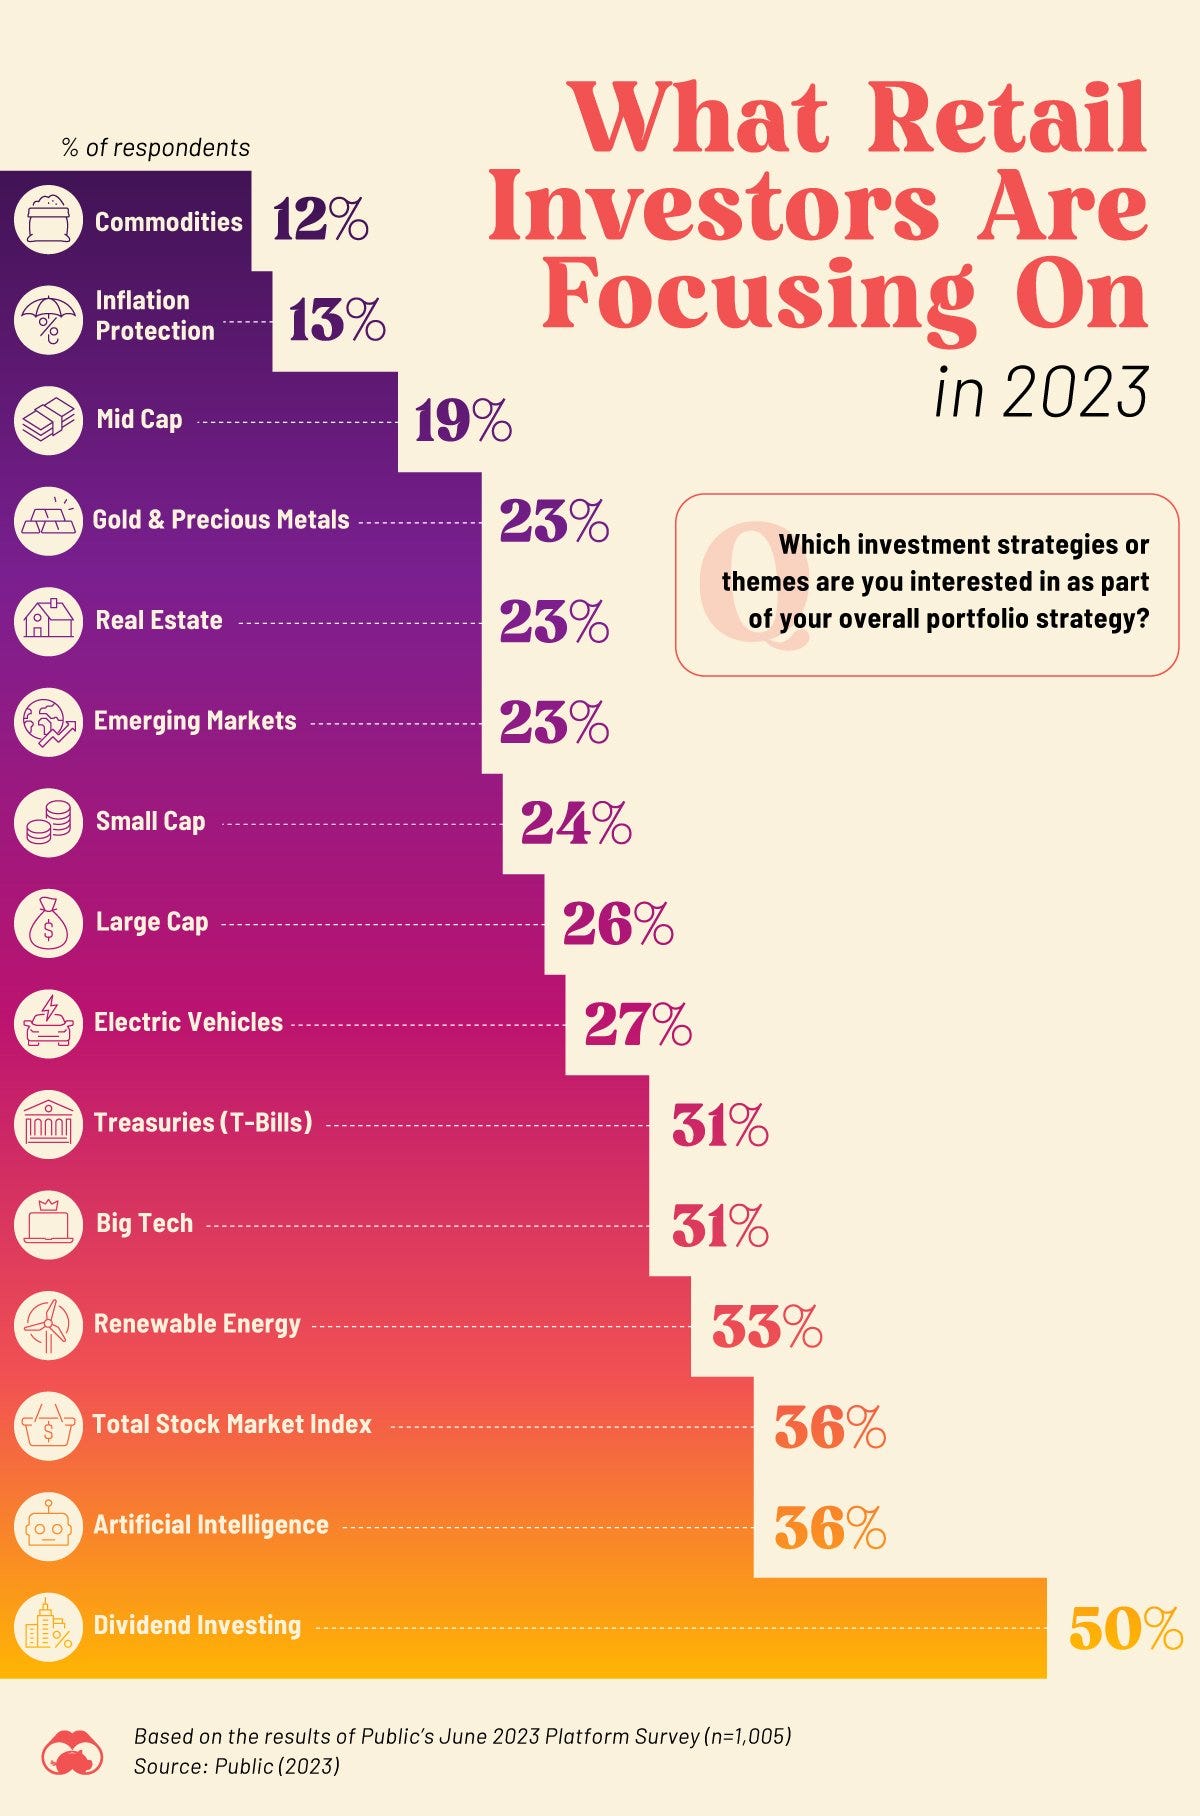
What are Retail Investors Interested in Buying in 2023? Strategies & themes:
dividend investing & AI the most, commodities & interestingly inflation protection the least
Retail investors performance in 2023 via JPM: "We estimate retail investors’ performance at +8.9%YTD, underperforming the S&P 500 (+11.3%)."
A key side note from my side:
underperforming or so does not mean much, investing is not a pissing contest & only institutional investors have to worry & have the big limitation to have a benchmark & other constraints. As a private/retail investor one is fully free, enjoy!
+8.9% or 11.3% can be great if done via super solid & relatively safe companies or bad if done with some flipping the coin 'trades' where half worked by chance, or by taking very high risks with some narrative or after reading some fancy slides from a company as many claim to be 'leaders' & ‘innovators’ in the field or so …
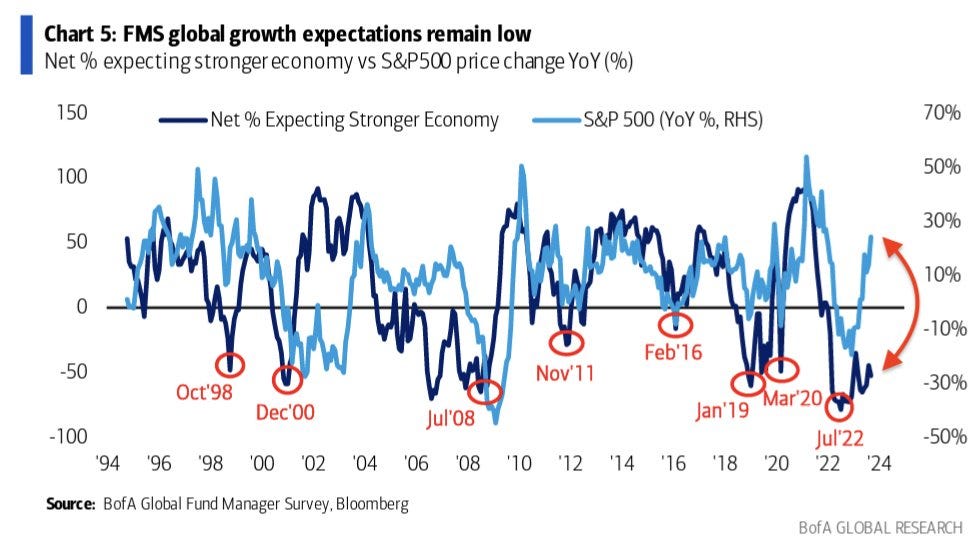
Quite a peculiar divergence when it comes to Global Fund Managers expecting:
53% expecting a weaker economy over the next 12 months (up from 45% in August), though optimism when it comes to the stock market
Possible/partly rationale for the optimism in stocks? Likely interest rate cuts in 2024 among other factors (improving earnings)
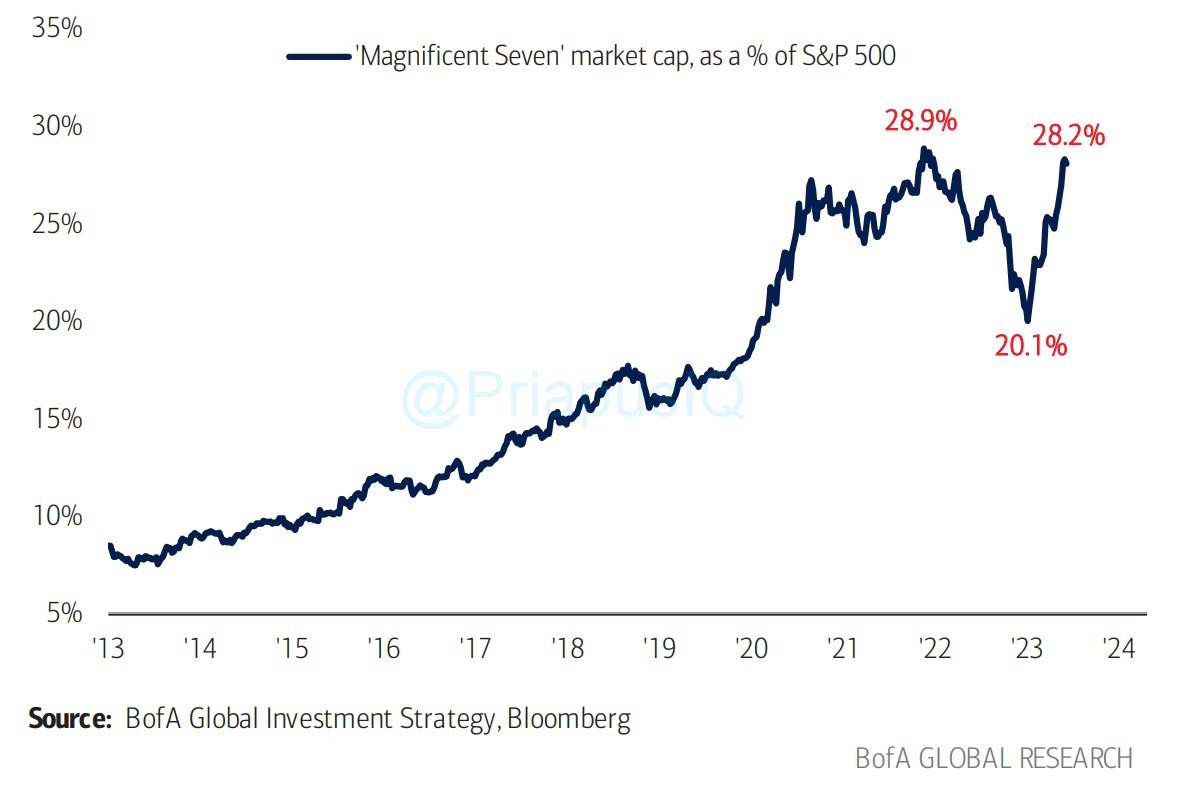
The M7 tech stocks and the S&P 500: Apple, Nvidia, Microsoft, Amazon, Meta/Facebook, Tesla & Google/Alphabet
account now for a staggering 28.2%, close to the 28.9% high as the FED was starting to embark on a very fast interest rates hiking cycle
20.1% was a local recent low which was pre-Covid levels
US Small Caps have recently hit a 22-year low compared to large caps
to me that’s where opportunities are to be found for the next 5-10 years
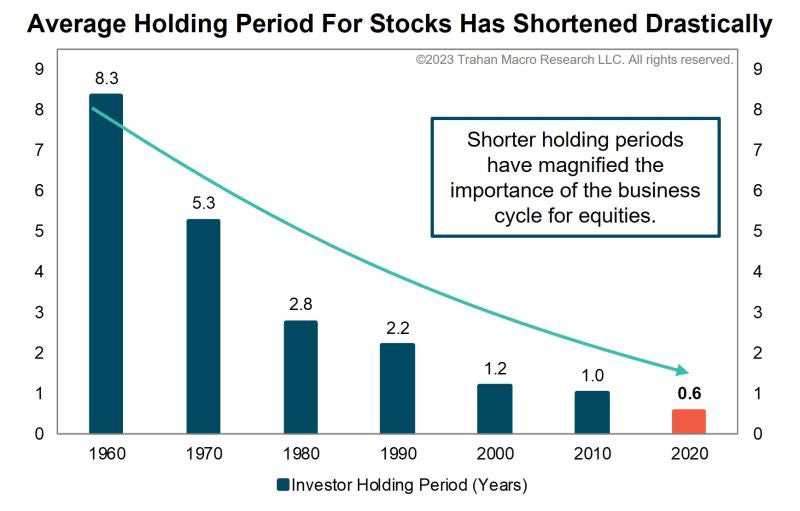
The average holding period for stocks since 1960:
it has never been shorter: technological progress brought very low-cost trading platforms and HFT (high frequency trading), and mixing it with social media and that is the result … is this good or bad?
an advantage for an investor with a great plan and a solid portfolio because one can get occasionally great companies at cheaper or dirt cheap prices
“The stock market is a device for transferring money from the impatient to the patient.” - Warren Buffett
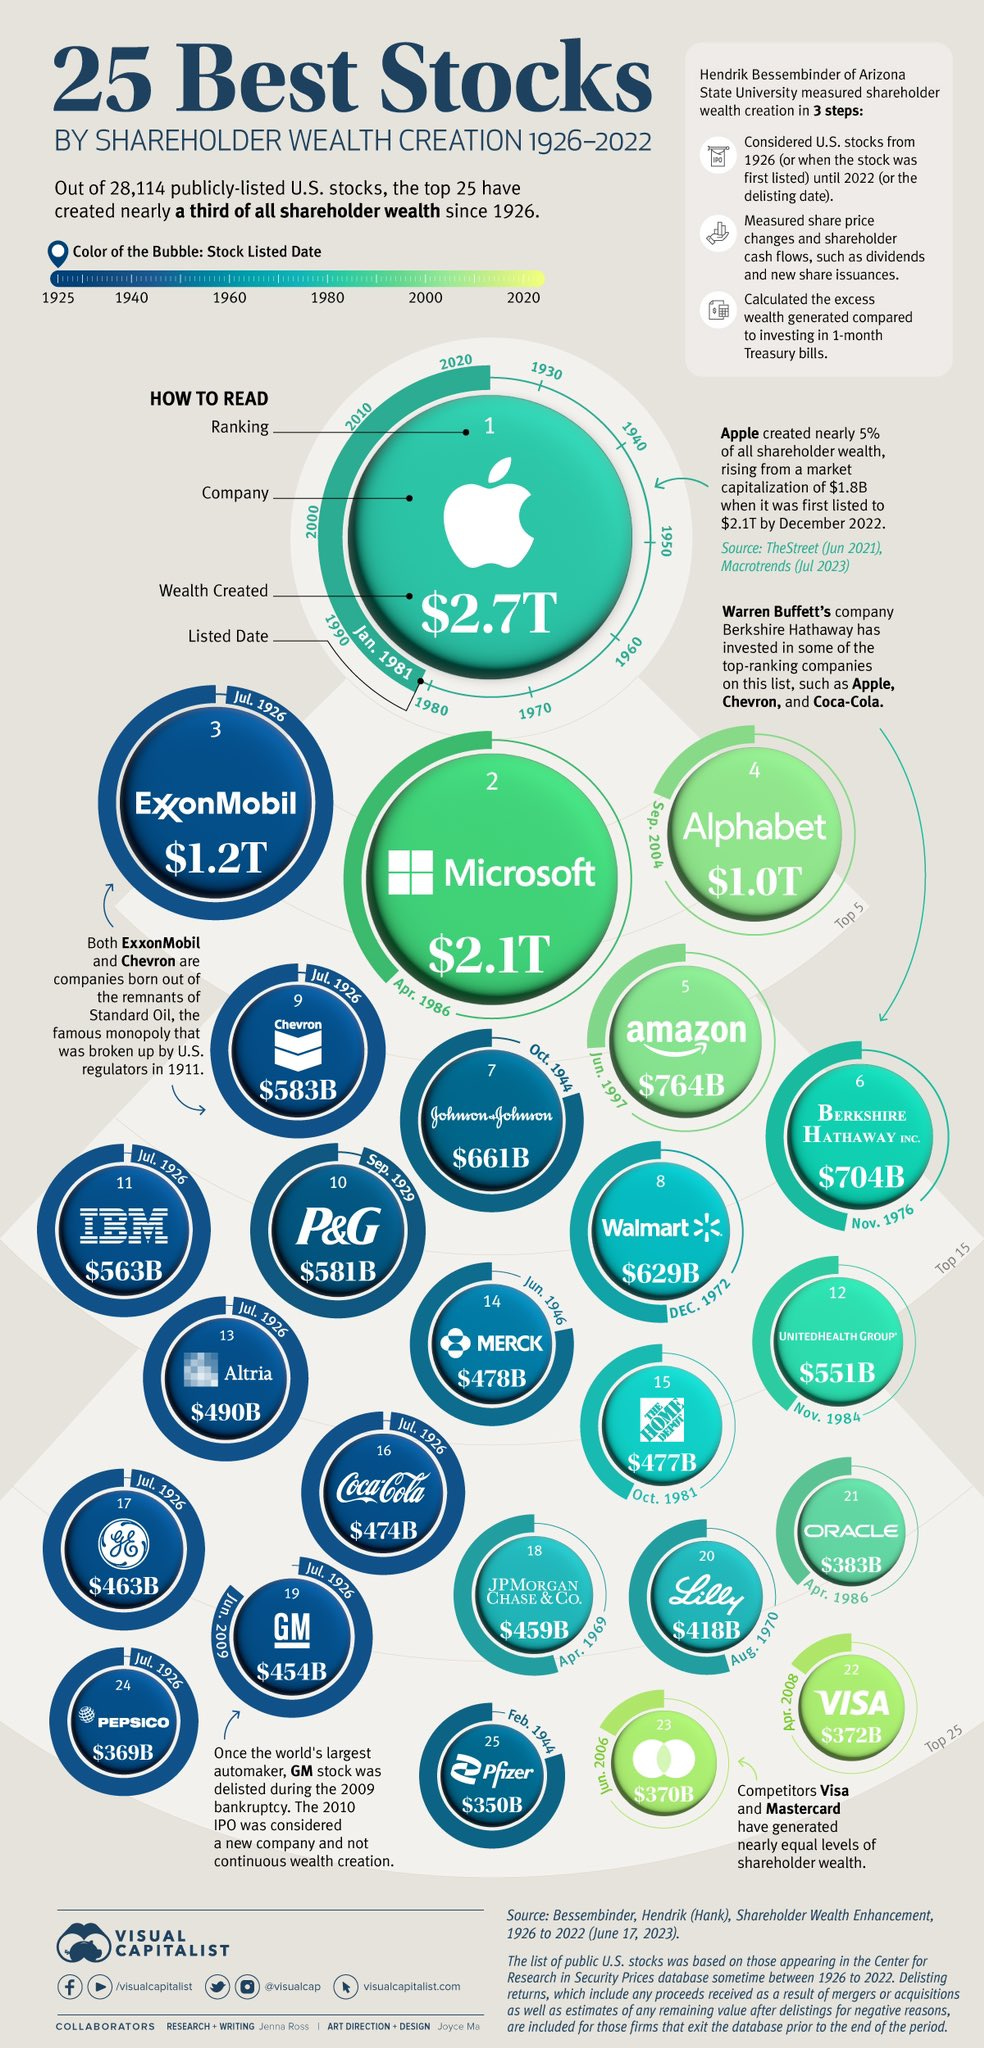
The best stocks of the past century:
"Out of 28,114 publicly-listed U.S. companies analyzed over past century, 25 best stocks have created nearly 1/3 of all shareholder wealth; put another way, just 0.1% of stocks have added over $17.6 trillion to investors’ wallets."
The main stages of the stocks cycle: from despair, hope, growth & optimism
12 & 13. Weekly equity fund flows: "Flows to stocks turned positive this past week with a +$7.61bn inflow, after recording a year-low -$18.96bn outflow the previous week."
Money Market Flows continue to flow smoothly on course for a record year
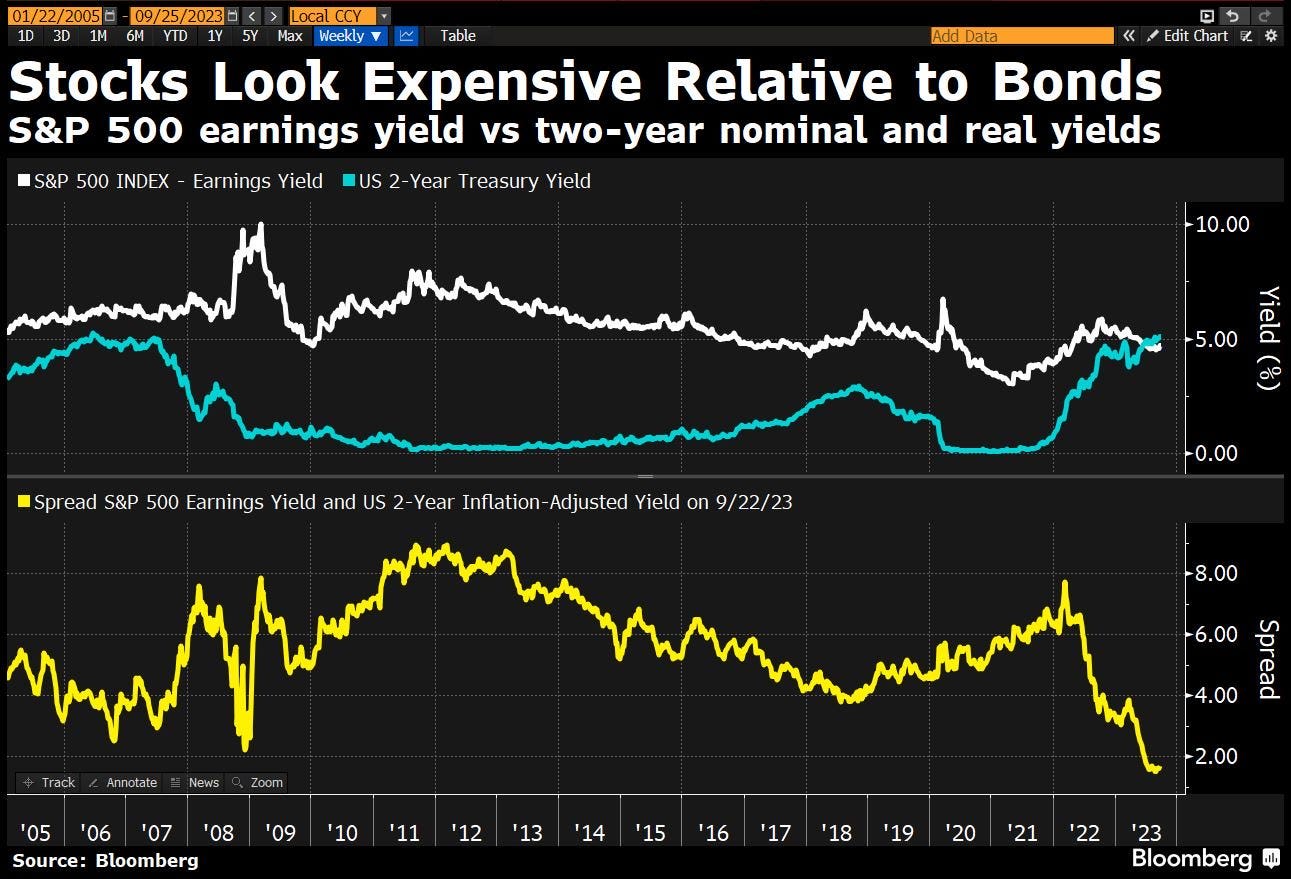
Stocks look expensive relative to bonds via the:
lens of the S&P 500 earnings yield and the 2-year nominal and real yields …
same via the 3-month Treasury bill that now exceeds the S&P 500 earnings yield (the inverse of the price/earnings ratio) which happens for the first time since the dot-com bubble burst at the beginning of this century
Note: there is a lot more to the story & I’ll do once a deep dive into bonds & stocks!
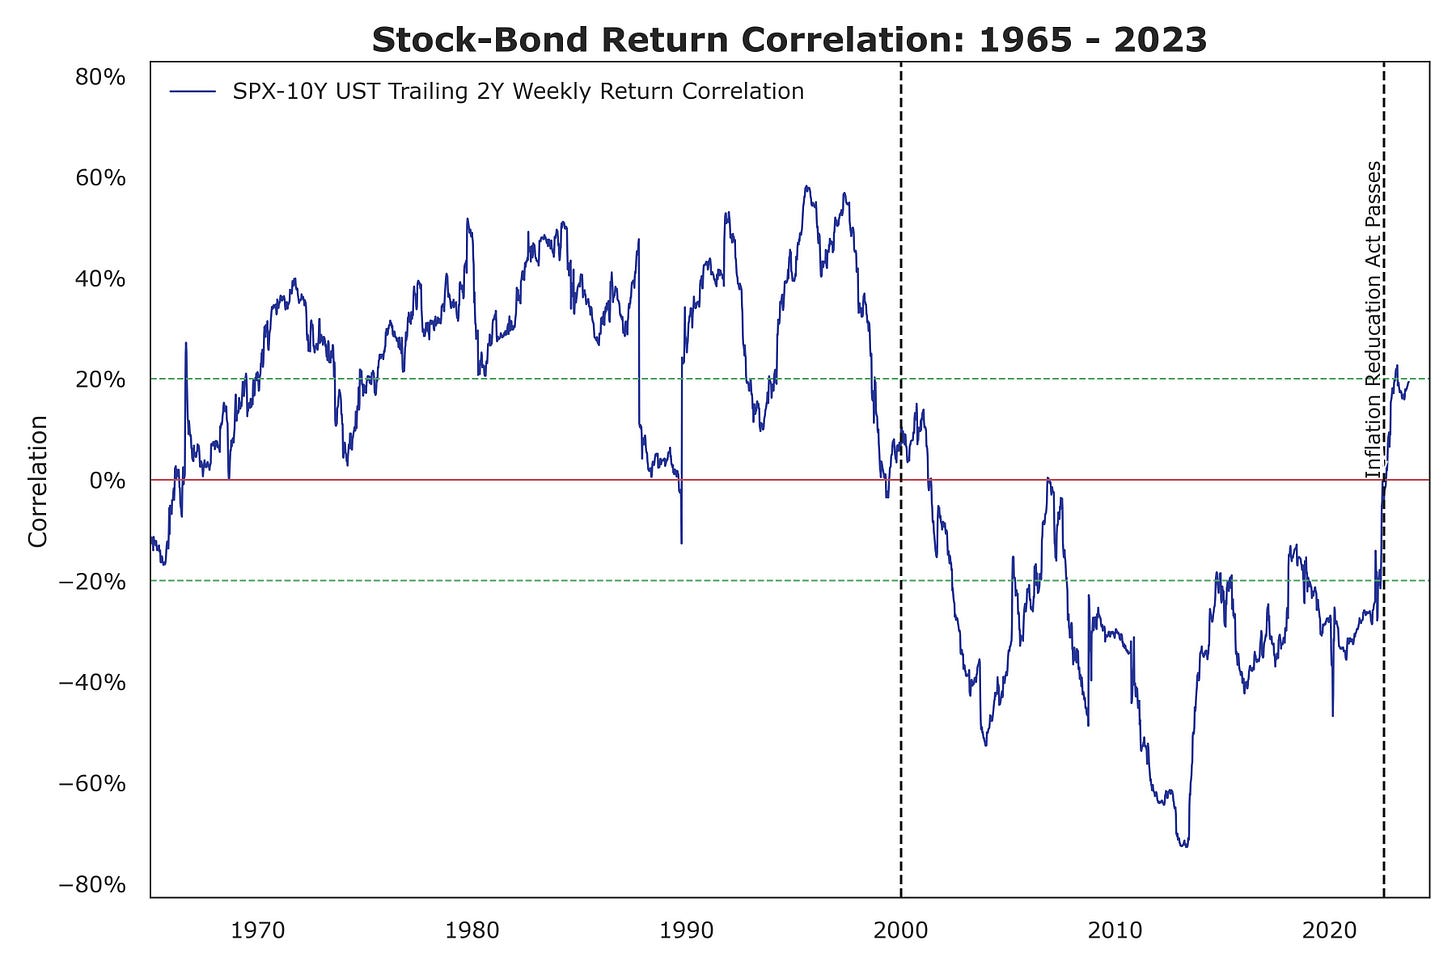
Stock-bond correlation continues to climb into the positive
Pre-2000 stock-bond correlation was consistently positive, where Treasury bond supply drove bond yields higher with more positive stock-bond corr. It flipped & stayed negative in 2000. We seem to be exiting that paradigm.
Global value of bonds since 2017:
quite an increase and a decrease as high inflation and interest rates came to town
as we are now into the base case scenario of ‘higher for longer’ interest rates, bonds are just being repriced for that
Century Austrian government 100-year bond:
trading at 36 currently, down 82% from its 2021 peak!
I was involved directly with the issuance, quite a story & a case for any investor to immerse into ... be it investing or just learning ... student of life mode is on ...
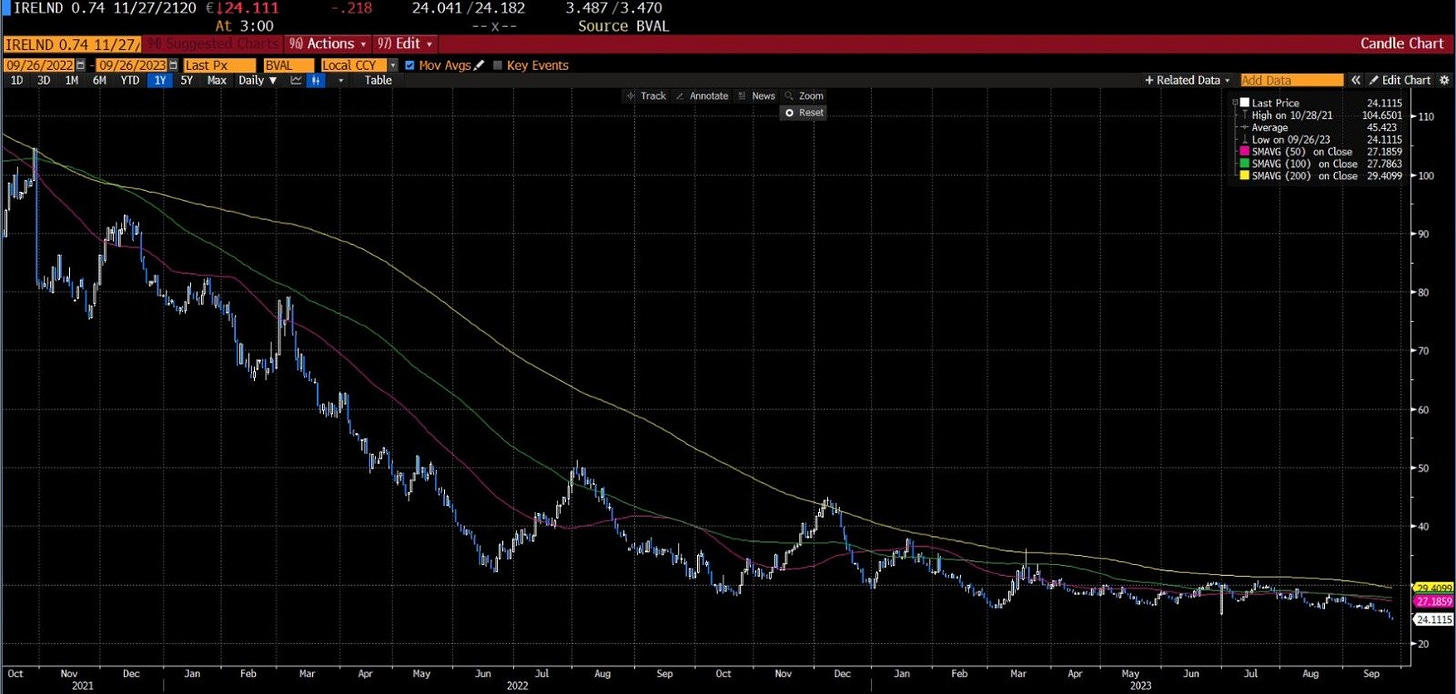
Check also the under followed & covered Ireland government 2120 bond at 24…
US Treasuries, who is long and who is short?
Asset managers = record level Long
Hedge funds = record level Short
Thoughts? ;))
Bondholders (US Treasuries) in pain since 2021 with the FED hiking rates at the highest pace in decades: TLT ETF duration effect ... is durable ...
Key note: never in the history of the US republic have 10-year treasuries return fallen 3 years in a row: never say never, but I aim it will NOT happen now in 2023
Which sectors have the highest & lowest share of bonds maturing in 2024 and 2025?
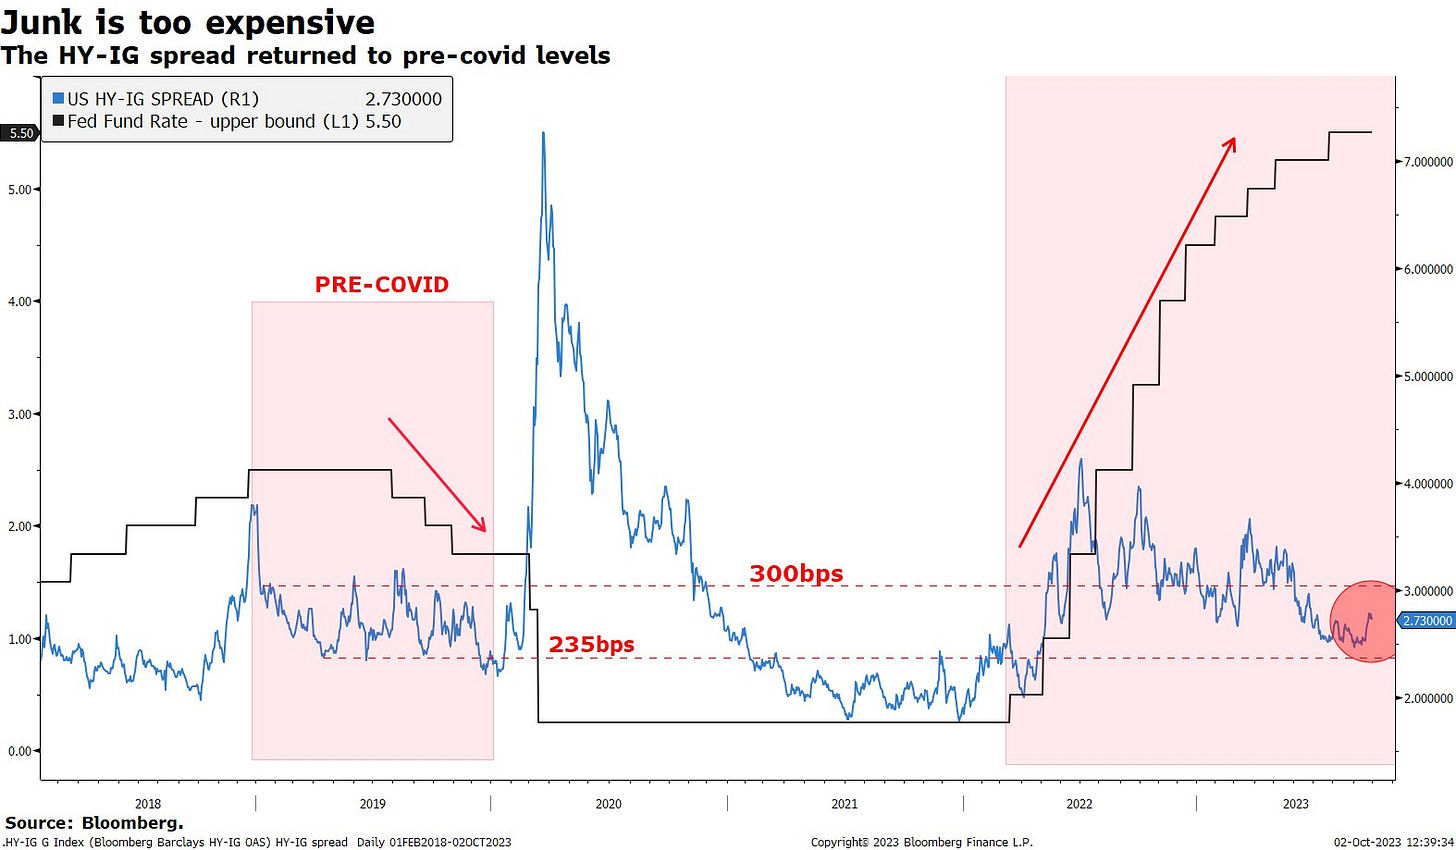
Junk Bonds (non-investment grade):
look expensive as they only pay 273 (2.73%) bp over IG (investment grade) bonds while FED fund rate is more than double it was pre-Covid in 2019
Junk bonds the first fat to melt on a more material economic slowdown
A key chart in this context: "Many companies locked in exceptionally low rates that were available immediately after the COVID shock." Hence, we have a corporate finance buffer.
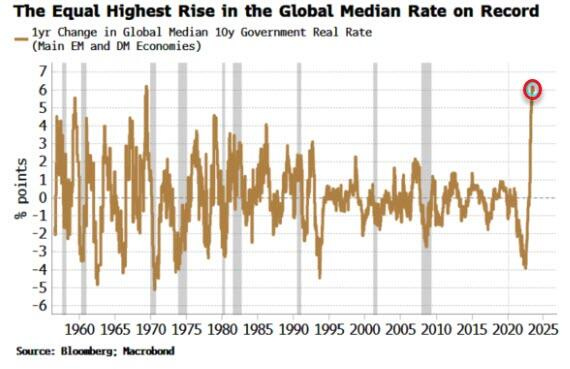
Bonds continue to look oversold after the equally-sharpest rise in the global median real yield seen in at least 60 years
5 Bonus charts:
Love is a low interest rate phenomenon: Bumble stock hits record low at $14.57
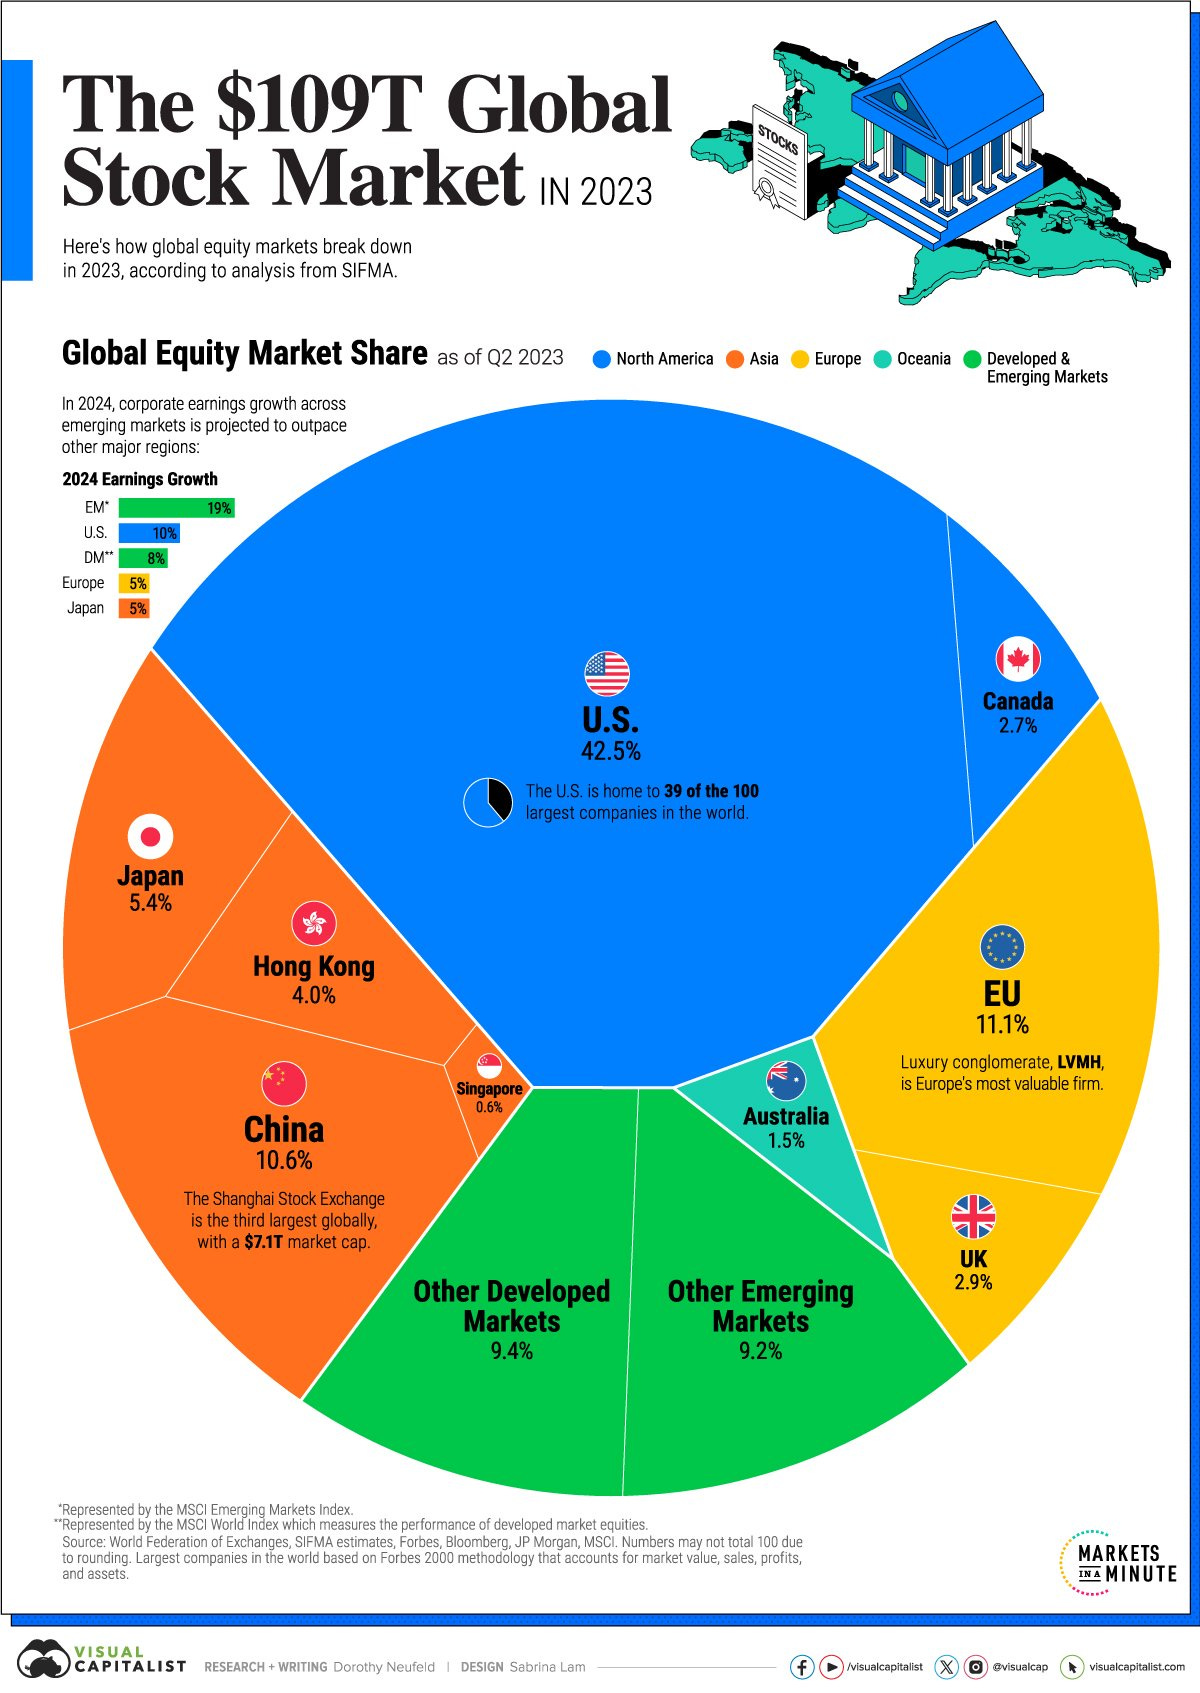
How does the $109 trillions Global Stock Market look like in 1 single chart?
US, EU & China taking the big share
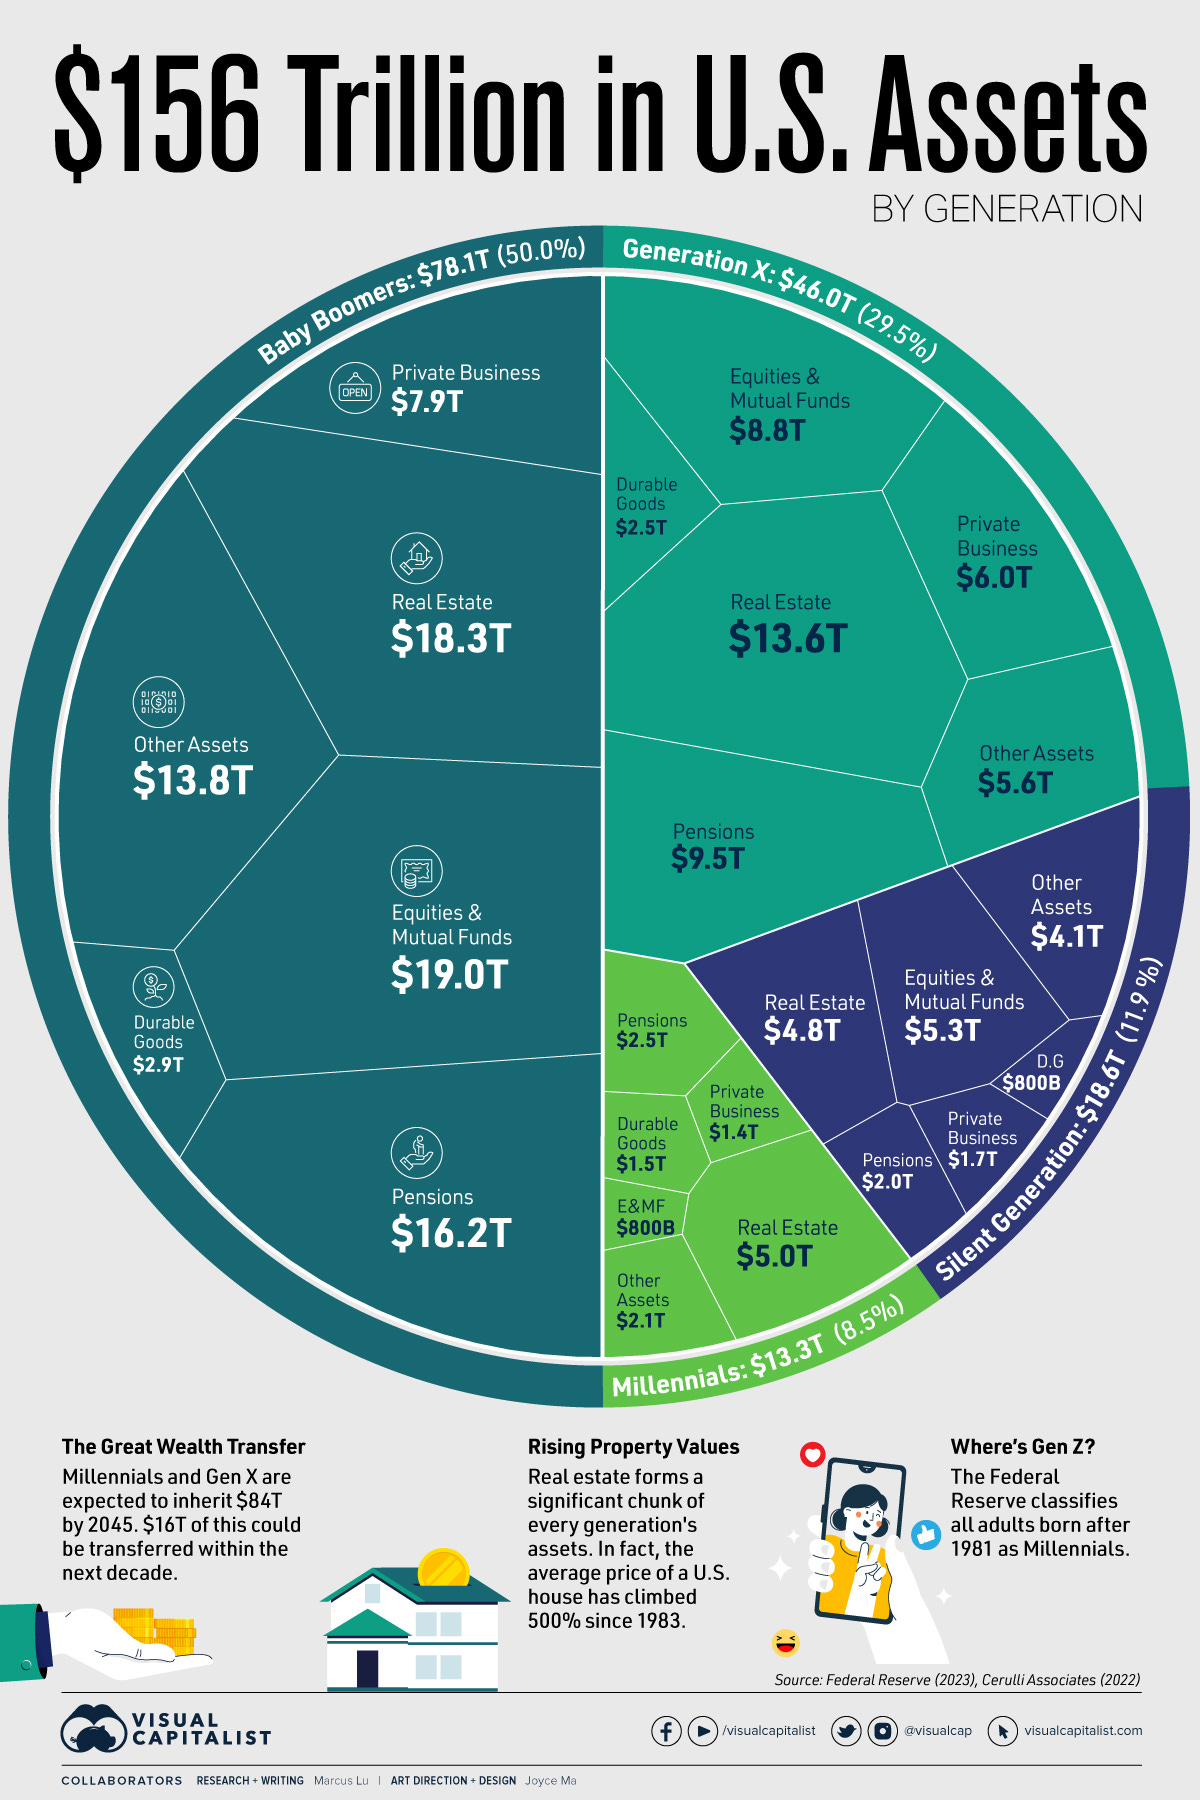
Visualizing $156 Trillions in U.S. Assets by Generation as of Q4 2022:
‘baby boomers’ own half of the nation’s $156 trillion in assets despite making up 21% of the country’s population
Millenials and Generation X are expected to inherit $84 trillion by 2045 with $16 trillion expected to be transferred within the next decade
Complementary, asset classes by generation:
Baby boomers’ biggest category of assets is Equities & Mutual Funds where they own 56% of the national total. Millennials, on the other hand, represent just 2%
Where millennials do have more wealth is Real Estate, with 12% of the national total. This suggests that millennials have, for the most part, foregone investing in financial assets in order to purchase a home
Share of Household Financial Wealth, how do European investors compare to their US counterparts? Some of the difference are STARK:
households’ direct share ownership in Europe is much lower than in the US
European households keep more of their wealth in banks. On the flip side, US investors use capital markets much more for investments in the form of regulated funds. US markets overall have more active retail investors than Europe.
Key difference also in how companies on get their financing:
Eurozone corporates get <30% from listed securities
The US gets more >67% from listed securities
Then there's the fragmented market structure. Europe has:
over 30 currencies
over 20 different languages
more complicated clearing than the US
Can the old continent ever catch up? Food for thought …
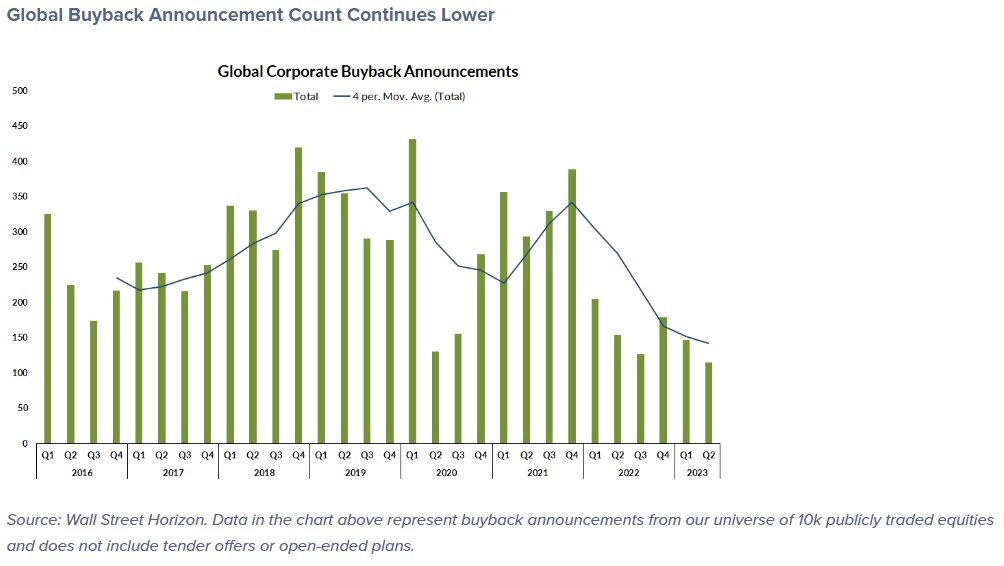
Stock buybacks, global view:
👉 first quarter of 2020 was the all-time high, Covid crash was a great opportunity to buy cheap basically
👉 currently, share repurchase plans are modest
👉 USA: among the 11 S&P 500 sectors, just two are responsible for the bulk of notional buybacks: Communication Services $XLC and Information Technology dominate $KLK
Fed’s zero-interest rate policy drew many corporate executives to reduce equity financing in lieu of relatively cheap deb ... during such times, shifting the capital structure more towards debt can actually increase total firm value ... while these days likely he opposite given high rates ...
Research is NOT behind a paywall & no pesky ads here. What would be appreciated?Just sharing it around with like-minded people. In case not already, 1-click subscribe to get all the future research straight to your inbox. Twitter thread can be found here.
Thank you & have a great day!
Mav















This must've been a time-consuming endeavor. Those are some insightful charts.
Amazing collection of insights, thanks for sharing!