✍️ Maverick Equities Charts of the Week #14: 2025 Global Returns, Market Concentration, S&P 500, Sentiment + Bonus
Maverick Charts that say 10,000 words
Dear all,
15 cherry picked Maverick Charts of the week say 10,000 words or more = the ‘How’!
Table of contents = the ‘What’:
📊 Maverick Charts: 2025 Global Returns, Market Concentration, S&P 500, Sentiment
📊 Bonus: Global Equity Market, Investor Allocations, Households & Stocks
✍️ Incoming Maverick-esque research!
Objective: both data-driven insights + valuable food for thought = the ‘Why’!
📊 2025 Returns, Market Concentration, S&P 500, Sentiment
1 & 2. 2025 Global asset returns leaderboard (fresh as of July 4, 2025):
👉 Leaders: German, Euro Area equities, Gold and UK equities
👉 Laggards: U.S. Small Cap, CAD, Crude Oil and USD
Maverick’s net take:
who would have thought in 2025 European equities will do as well as they did?
going forward: the lagging U.S. small caps (and international) will be the focus of my research via the dedicated Full Equity Research section - value to be found there in an overall pricey U.S. market
by small caps I also include the U.S. REITs laggards which are valued at an average 18.8% discount to NAV as of 5/30/25 - value to be found there also
✍️ Full Equity Research
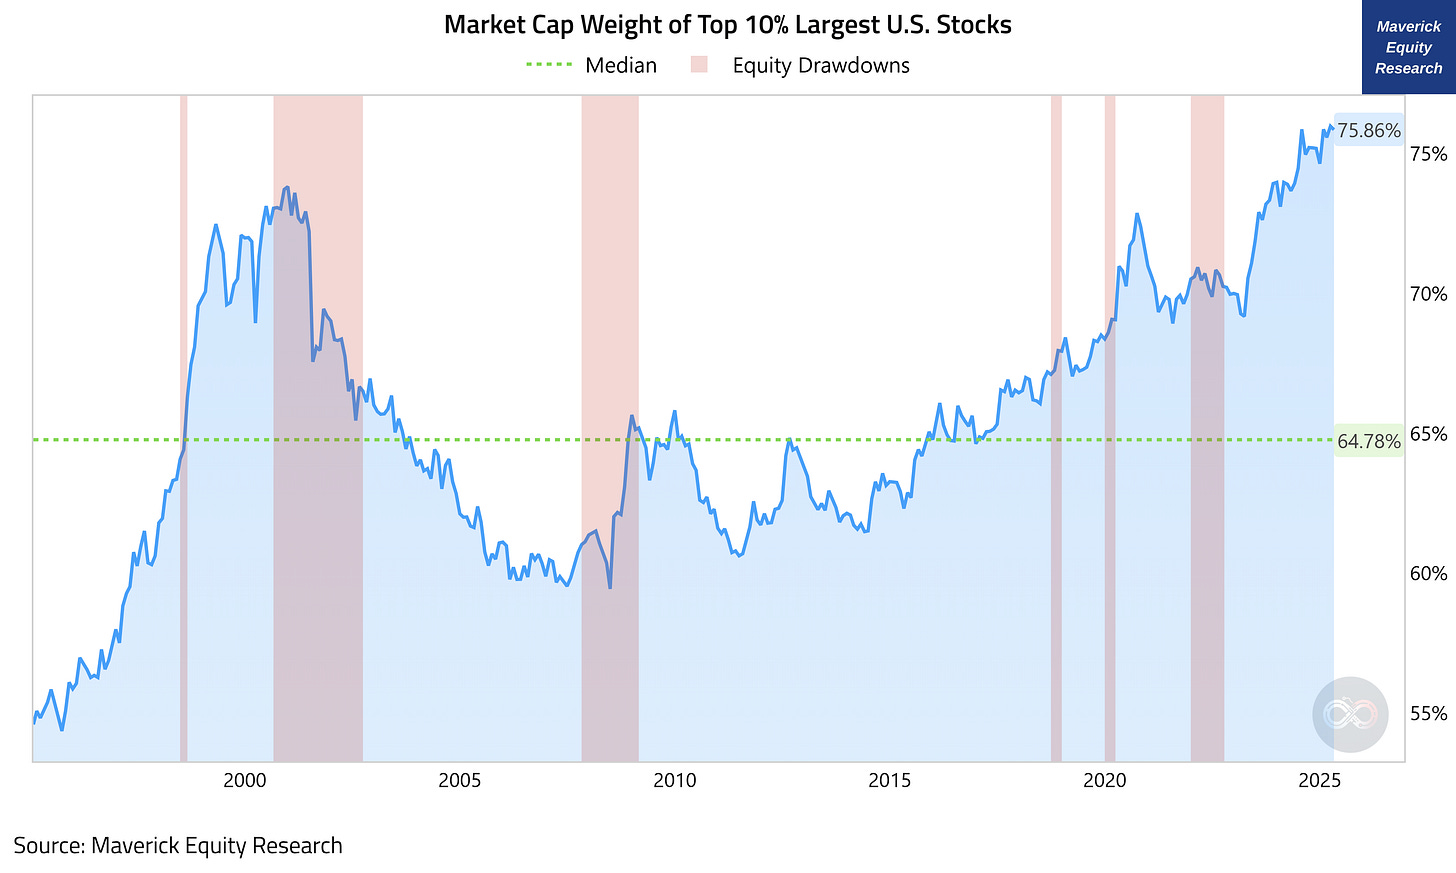
3 & 4 & 5. U.S. Equities Market Concentration via one Maverick 100 Years Chart - by market cap weight of the top 10% largest stocks:
👉 75.86% record level, above even 2000s Dot-Com bubble & 1930s Great Depression
👉 64.45% historical median value
‘Does extreme market concentration foresee a recession and/or a market correction?’ A key question to be covered via a Maverick Special Report. Previous special reports here.
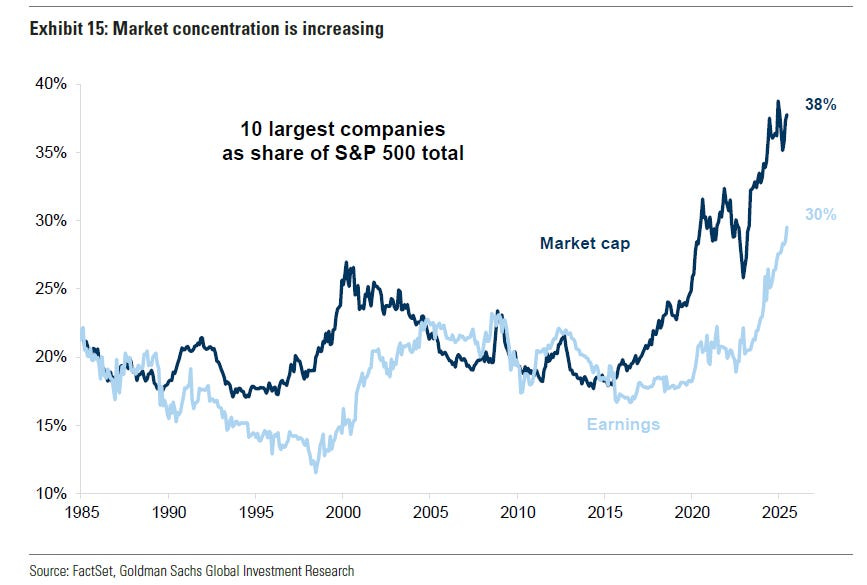
👉 until then, a teaser Maverick chart with the same as the above, though where the red areas are equity drawdowns (not grey for recessions as before)
👉 additionally, a 2nd teaser chart via Goldman Sachs - market cap & earnings:
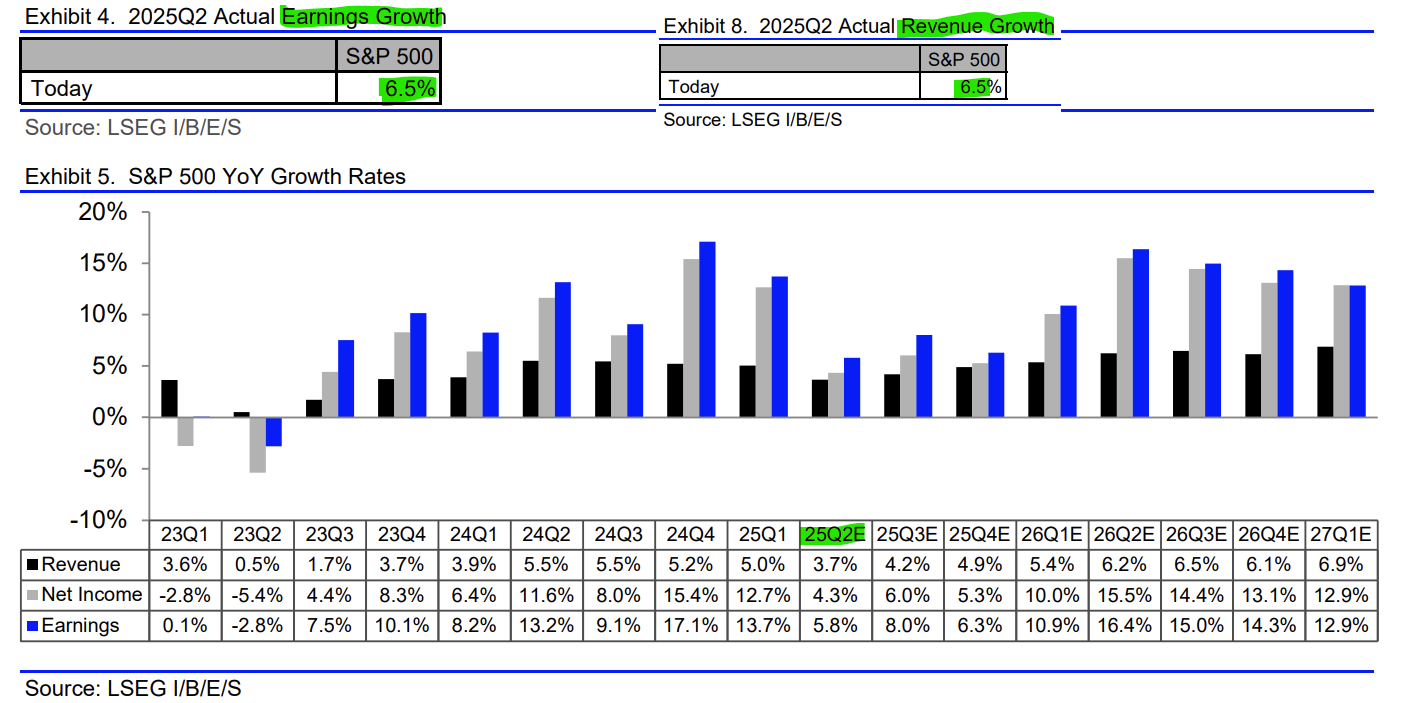
S&P 500 Q2 2025 Earnings & Revenue growth scorecard (fresh update, July 3rd):
👉 earnings growth +6.5% (not bad ... at all ...)
👉 revenue growth +6.5% (not bad ... at all either ...)
7 & 8. S&P 500 companies guidance:
👉 more S&P 500 companies issuing positive EPS guidance for Q2 than average
👉 at the sector level, at 29 the Information Technology sector has the highest number of companies issuing positive EPS guidance of all 11 sectors
S&P 500 ratings: of the 12,319 ratings on the individual stocks, how many are Buy, Hold and Sell ratings?
👉 56.4% are Buy
👉 38.7% are Hold ratings
👉 4.9% are Sell ratings
Fear & Greed Index = 78, above my discretionary 75 threshold
👉 moved back into "Extreme Greed" territory
👉 not surprising given that the U.S. main equity indices are at all-time highs
Maverick’s net take:
in general & going forward for a Maverick-esque contrarian approach, consider the 25 (green) & 75 (red) discretionary levels for ‘Buying Fear’ and ‘Selling Greed’ …
coupled naturally with other key metrics/indicators + a good Macro understanding
📊 Bonus: Global Equity Market, Investor Allocations, Households & Stocks
The Global Equity Market composition = $81 trillion in total:
👉 the U.S. S&P 500 with the massive share of the pie at 64%, for $52 trillion
👉 Europe & U.K. 2nd with 15%, Japan 5%, China 5%, Canada 3%, India 2%
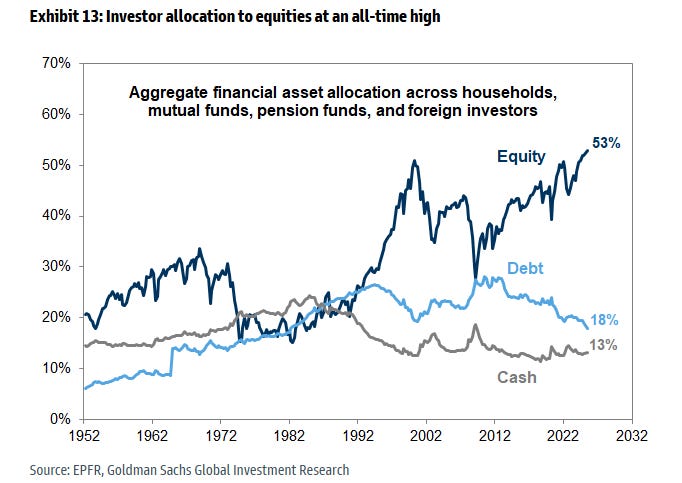
Investor allocation to equities (aggregate: households, mutual funds, pension funds, and foreign investors):
👉 Stocks at 53% = an all-time high to be noted - risk appetite is clearly there
👉 Debt at 18% = trending down
👉 Cash at 13% = quite stable in the last 10 years
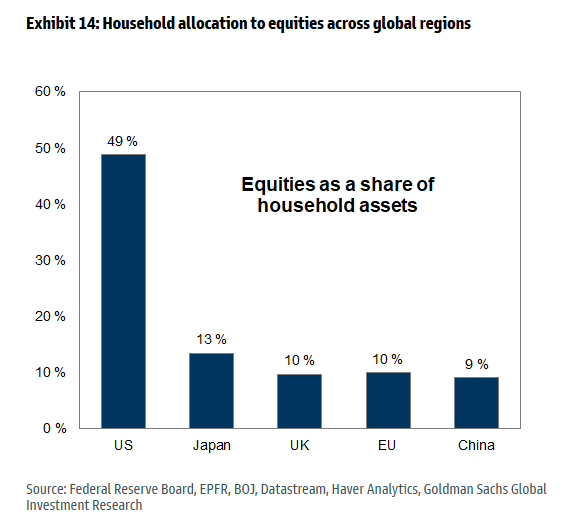
Household allocation to equities across global regions:
👉 U.S. = Land of the Free = Home of Stockholders, leading by far with a whooping 49%, relative to others at around just 10%
Breakdown of household equity and mutual fund ownership by generation:
👉 Baby Boomers with the biggest ownership at 53%
👉 Millennials own close to nothing (3%) while GenX 27%
Equity ownership across the wealth distribution - give it a guess:
👉 how much does the top 1% own of stocks? They own 51%
👉 what about the bottom 50%? They own 1%
Maverick’s takeaway for a positive mindset for the win: own stocks (not tickers), start early, discipline, earn more via higher skills, stick to the plan … guess what? it works!
✍️ Incoming Maverick-esque research!
What is coming next through the independent investment & economic research here What’s next for you? Many drafts are work in progress - below a few selected ones:
✍️ Why Independent Investment and Economic Research = Paramount Nowadays!
common sense is not so common, conflicts of interest are very common, hence independent research for the win!
✍️ Full Equity Research
section start where I will cover in details single businesses/stocks aka deep dives
✍️ S&P 500 Report #6: Valuation, Fundamentals & Special Metrics
coming up with further improved metrics via sleek Maverick charts as always
✍️ The State of the US Economy in 75 Charts, Edition #4
major improvements: leading indicators + recession probability metrics
Research is NOT behind a paywall and NO pesky ads here unlike most other places!
Did you enjoy this by finding it interesting, saving you time and getting valuable insights? What would be appreciated?
Just sharing this around with like-minded people, and hitting the 🔄 & ❤️ buttons! That’ll definitely support bringing in more & more independent investment research: from a single individual … not a corporate, bank, fund, click-baity media or so … !
Like this, the big positive externalities become the name of the game!
Have a great day! And never forget, keep compounding: family, friends, hobbies, community, work, independence, capital, knowledge, research and mindset!
With respect,
Mav 👋 🤝






Thank You!