


✍️ Maverick Special Report #6: U.S. Public Debt Reduction = Hard but Feasible
A “beautiful deleveraging”, European style debt reduction & rare Maverick charts!

Dear all,
the U.S. debt pile has been, is and will be quite a topic going forward. While it is an important issue, one that definitely needs to be addressed, my take here will focus that for now it is not as dramatic as the media and many economists claim it to be.
The theme is naturally complex, yet in just 10 charts I will ‘say’ 10,000 words or more!
Table of contents:
📊 Have other developed countries with high debt done it before?
📊 The U.S. debt case - key question: a Revenue or a Spending problem?
💡 Solutions & food for thought - Maverick charts you rarely see!
📊 Have other developed countries with high debt done it before? 📊
First of all, yes and many! Just check the recent history European public debt reduction episodes - off the charts given both magnitude & how fast:
👉 Greece in 5 years slashed almost 60%, Ireland in 11 years
👉 Cyprus in 5 years with 50%, Belgium in 12 years

So, if it was in these 9 cases, why not the U.S.? Not easy at all, but feasible I believe! At least we cleared that one out! Way more on that below as we progress further!
Bonus: I personally asked on Twitter/X last week Danielle DiMartino Booth (former adviser to the president of the Dallas Fed) about any real reason(s) why U.S. could not do an European style debt reduction? Below her valuable feedback:

Thanked her naturally for her take, and added the note it is also in a way what Buffett was saying in other words:

Fresh from Buffett via yesterday’s Berkshire's 2025 annual shareholder meeting:
"I wouldn't want the job of trying to correct what's going on in revenue & expenditures of the United States with roughly a 7% gap, when probably a 3% gap is sustainable. And the further away you get from that, the more you get to where the uncontrollable begins … It's a job I don't want, but it's a job I think should be done and Congress does not seem good at doing it."
📊 The U.S. debt case - key question: a Revenue or a Spending problem? 📊
Let’s do a walkthrough of the US debt step by step, and then at the end show you charts on the topic that you rarely see … which also sends the main message!
U.S. General Government Total Debt (blue, 000s) & Recessions (grey) since 1965:
👉 $35 trillion as of the end of 2024, with $36.79 trillion the latest in April
👉 has been going up a lot starting with the 2000s, and especially once we had the 2007-2009 GFC recession, and then going parabolic since the 2020 Covid pandemic as fiscal stimulus is a lever to get out of a recession

U.S. Government Debt as % of GDP (yellow) & Recessions (grey) since 1965 (total $ amounts is the most basic way to show debt levels, so as % of GDP = an improvement)
👉 developed economies are carry higher debt burdens than others, with an average debt-to-GDP ratio of 110%, compared to 74% for emerging and developing economies.
👉 U.S. at 121.85% is definitely high and ranks #8 from the IMF’s WEO 186 countries

Combining the 2 charts above for an initial decent overview as we keep building here: U.S. debt (blue, L, 000s) and as % of GDP (yellow, R, %) & Recessions (grey) since 1965
👉 one major direction and that is up for both as we expected
👉 though note that as a % of GDP (yellow) it has been going DOWN since the 2020 Covid peak at 132.85% (since 2023 going back up)

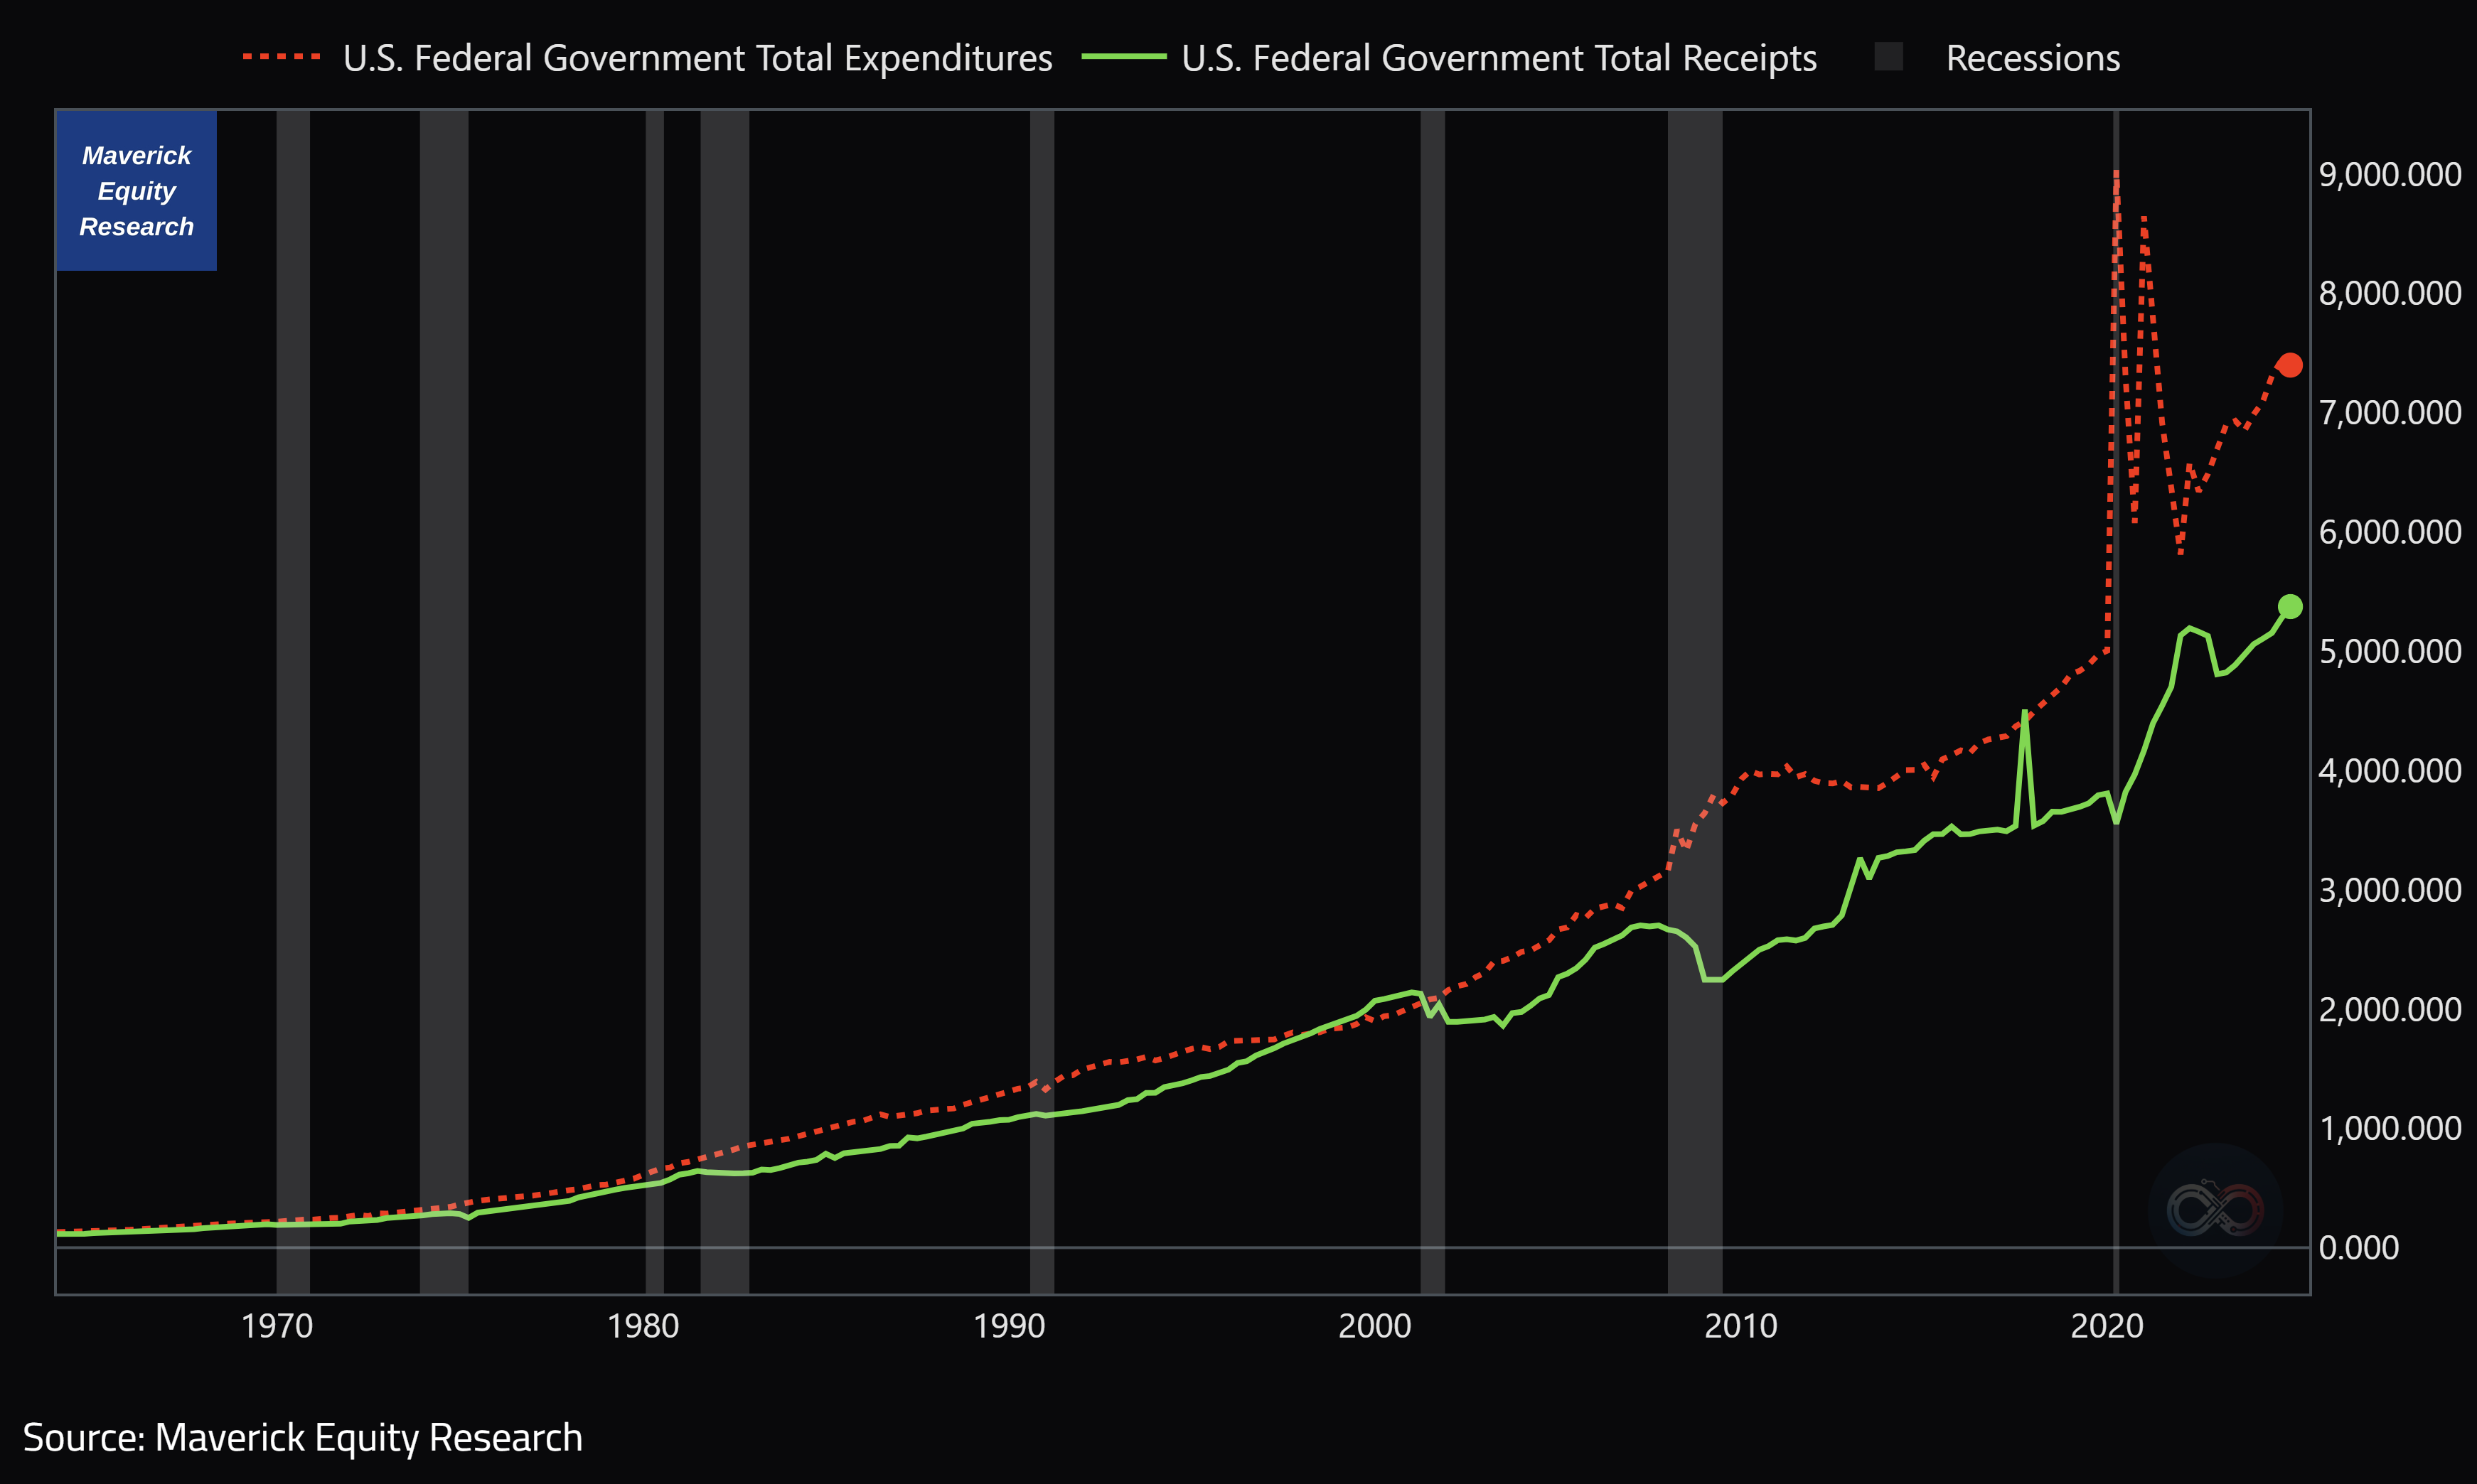
A key question is: does the U.S. have a Revenue problem or a Spending one? Charting: U.S. Federal Government Total Expenditures (red dotted, 000000s) & Receipts (green)
👉 the bad news: they decoupled materially starting with the 2000s, the 2007-2009 GFC created the first big gap, while the 2020 - 2021 Covid made it for a huge gap (between 2015-2020 note it was quite decent, could have become a balanced budget)
👉 the good news: Revenue is there and growing well, hence the U.S. does NOT have a Revenue problem, but a big spending one (also like other countries & couples lol 😉)
Curious how are the U.S. federal expenditure doing in 2025 vs the previous 2 years?
👉 higher … I’ll update this chart in my next extensive research on the U.S. economy
Generally, a revenue problem is harder to engineer and address than a spending one: you have way more control and quicker to act upon on the latter than on the former. Issue is that is a statement rather valid in the private sector than the government one.

💡 Solutions & food for thought - Maverick charts you rarely see! 💡
What happens at high debt levels is that the higher it gets, the harder it is to fix it in a manner minimizing economic pain & avoiding a severe recession and unemployment. Kicking the can down the road ‘works’ .. until ugly deleveraging (not orderly and not gradual) is necessary as debt levels become unsustainably high relative to income.
What are the 4 main intertwined ways one can reduce debt aka deleverage?
Defaulting on its debt and/or debt restructuring is the most painful one given how deflationary that is with a recession and high unemployment basically a given - it would also take a lot of time to get back to growth / potential GDP
Austerity via big spending cuts & savings via rising taxes are also ugly given how deflationary and detrimental are to growth (corporate capex & consumer spending)
Wealth transfers (from the wealthy to the less wealthy): you do that too much, and investment and growth will suffer … though some can be helpful overall
Debt monetization (QE central bank "printing money") & lower interest rates: stimulative for the economy (growth, higher revenues) though inflationary
A “beautiful deleveraging” has to be the goal and approach:
“A “beautiful deleveraging” happens when the four levers are moved in a balanced way so as to reduce intolerable shocks and produce positive growth with falling debt burdens and acceptable inflation. More specifically, deleveragings become beautiful when there is enough stimulation (i.e., through “printing of money”/debt monetization and currency devaluation) to offset the deflationary deleveraging forces (austerity/defaults) and bring the nominal growth rate above the nominal interest rate—but not so much stimulation that inflation is accelerated, the currency is devaluated, and a new debt bubble arises.” Ray Dalio
Highlighting ‘Bring the nominal growth rate above the nominal interest rate’:
Nominal Growth (GDP) above Interest Rates (cost of funding) is one key indicator for assessing U.S. debt sustainability - a hallmark of a ‘beautiful deleveraging’ given that it allows the debt burden to shrink relative to income as the economy grows
also the subject of the following charts that you rarely see (as mentioned above). They were also part of an online course offered by the IMF which I did more than 10 years ago, called ‘Debt Sustainability Analysis (DSA)’ with their overall framework. Finally, after many years I make use of that course, and especially do my own charts with my conditional coloring and all (‘art work’ is a key part of the job basically 😉):
Chart = 10-year Treasury Yield (R) minus Nominal GDP Growth (G) as Red & Green bars and areas, and the U.S. debt as % of GDP (yellow line) since 1965
👉 when R < G (green bars & shading in the chart) = GOOD: economic growth is outpacing the interest rate the government is paying to raise debt, which is a sign that government spending is driving economic growth effectively. Meanwhile, increased tax revenue from a growing economy also helps sustain or reduce the national debt burden. As an example, after the 2008 financial crisis, the low interest rate environment that lasted for 8 years allowed the U.S. government to borrow at a lower cost while the economy continued to recover, preventing the debt-to-GDP ratio from entering a vicious upward cycle, at times the ratio even went down - overall, an example of a nice orderly and gradual adjustment
👉 when R > G (red bars & shading in the chart) = BAD: government’s borrowing costs are higher than the rate at which the economy is growing. With high interest expenses, the debt burden swells and can even result in a self-reinforcing debt spiral. An example is the 1980s when then Fed chairman Paul Volcker had to raise interest rates aggressively to curb inflation, which pushed interest rates above economic growth causing the national debt-to-GDP ratio to climb and creating significant fiscal pressure - an example of a hard decision that had to be made versus a more ideal approach via an orderly & gradual adjustment
As of the end of 2024 (like in the chart), R < G = GOOD:
10-year Treasury yield was at 4.5%, and U.S. nominal GDP growth stands at 5.0%
this means that we still have a negative spread, hence green bars and shading
under this mix, the gap between the two indicators is not expanding, indicating that for now the U.S. debt has not fallen into a dangerous vicious cycle

Bonus chart: the exact same chart upgraded with with Recessions as grey bars:
👉 when recessions come, higher Debt/GDP ratio is next via fiscal spending/stimulus
N.B. as of 1st Quarter 2025 (U.S. BEA April 30th Advance Estimate), R > G = BAD:
10-year Treasury Yield at 4.2%, while U.S. nominal GDP growth stands at 3.5%
this means that we have a positive spread, hence red bars and shading
under this mix, the gap between the two indicators back again expanding, indicating that the U.S. debt really needs to be addressed
N.B. I will update these charts in my next extensive research on the U.S. economy
✍️ The State of the US Economy in 75 Charts, Edition #4 (3rd edition here)

Above I used the 10-year Treasury yield given it is a widely referenced benchmark for government borrowing costs, though let’s give that an upgrade and use the average interest rates the U.S. government pays
Chart = Average Interest Rates (R) minus Nominal GDP Growth (G) as Red & Green bars and areas, and the U.S. debt as % of GDP (yellow line) since 2000
The same interpretation as before:
when R < G (green bars & shading in the chart) = GOOD
when R > G (red bars & shading in the chart) = BAD

Bonus chart: the exact same chart upgraded with with Recessions as grey bars:
👉 when recessions come, higher Debt/GDP ratio is next via fiscal spending/stimulus

Maverick 2 key takeaways:
👉 looking ahead, investors should continue to keep an eye on the gap between the two indicators to monitor U.S. debt sustainability: as long as Fed policy stays accommodative, trade war does not escalate, fiscal expenditures and waste are addressed (DOGE), the job market stays good, and most importantly, the U.S. economic growth remains resilient, the U.S. debt risk should not be a cause for excessive concern
👉 All in all, when/if nominal growth (GDP) is > Bond Yields (cost of funding), that is when a "Beautiful Deleveraging" can be engineered, hence a more sustainable public debt is on the horizon
After a “beautiful deleveraging” was presented as an ideal solution, more nuances:
👉 basically, it is a ‘game’ of deflationary and inflationary forces that needs to be mixed properly, orderly and gradually for a decent final outcome
👉 all this to work requires a very good balancing act between the fiscal policy (U.S. government) and the monetary policy via the independent FED - currently they are not in very much sync given POTUS just the other week said (ordered rather) that the FED should cut interest rates … but yeah, not the 1st time, should be all right with the next narrative change and focus
👉 Inflating the debt away: tricky to play with as inflation can suddenly become ‘ketchup inflation’ as you can get way too much at once, and also it can feed on itself
Fresh from Buffett via yesterday’s Berkshire's 2025 annual shareholder meeting: "We still have very substantial inflation in the United States, but it's never been runaway…yet. And that's not something we want to try and experiment with, because it feeds on itself."
👉 DOGE: the idea behind this bold fiscal reform is new and excellent
results are starting to come as inefficiencies and waste & fraud are present as expected: recall that Musk did lay off 80% of the Twitter/X workforce which given the private sector should be more efficient than the public government side: and Twitter still works, some say even better than before or let’s say, issues present, but progress has been made I would say
now in any major restructuring (be it in a government or a corporation) there will be collateral damage where good and competent people will take a short term hit, (it sucks big time, it happened to me personally also), yet those will find a way also sooner or later somewhere else
👉 lowering taxes is often very good idea with a net benefit (boosting growth G)
👉 deregulation, innovation, efficiency & political gridlock should be in focus in order for growth (G) to be there and allow room for lower debt
👉 cut spending / austerity:
this is a path the U.S. is very foreign of, a way that was not taken for decades now, but rather the opposite: every recession was addressed by higher and Q.E. …
the crux of the issue is … politics! The name of the game is kicking the can down the road given that any austerity would mean the ones that decided on it will lose their seats in the next election cycle - maybe now as POTUS is addressing it soon in the 1st year of the presidential term could make it work … but let’s see …
All in all, there you go:
👉 the most important thing: the U.S. does not have a problem of being able to tackle this issue, though albeit tricky, a willingness one, politically specifically …
👉 Is it or will it be easy? Definitely not. ‘But why is it not easy Maverick’? Because … politics buddy! But if many European countries could do it materially in 5-12 years as those 9 examples from the 1st chart, then U.S. can also ... also in Europe losing the next elections was/is always an issue which is the main crux of the issue everywhere
👉 I do not think the economic structure is that different: US does not have such a big revenue/income problem, but a spending one ... European countries have/had bigger revenue/income issues overall given lower growth or no growth at all …
👉 the U.S. economy is very fluid & flexible, the human and intellectual capital is very high, and it attracts the highest hungry and talented people on the planet. All that wealth there will not just fly or disappear out of the blue …
👉 even if there is a recession (which happens every 6-8 years since WW2), the U.S. will come out of it stronger just like it did after the 2007-2009 Global Financial Crisis (the 2nd worst since the Great Depression from the 1930s) - recall that a recession brings lower stock prices, many opportunities to buy value/quality at discounted prices
👉 way more on the U.S. economy via my dedicated and extensive research on it:
✍️ The State of the US Economy in 75 Charts, Edition #4 (3rd edition here)
Maverick overall simple ‘algo’:
government debt issue needs to be addressed? Yes, definitely!
is the current state dramatic? No!
will there be a solution one way or the other? Yes!
Long U.S. and many other countries where investing opportunities are always there! Many of them I will cover in detail in the future, stay tuned!
Research is NOT behind a paywall and NO pesky ads here unlike most other places!
Did you enjoy this special report? Found it interesting, saving you time and getting valuable insights? What would be appreciated?
Just sharing this around with like-minded people, and hitting the 🔄 & ❤️ buttons!
That’ll definitely support bringing in more & more independent investment research: from a single individual … not a corporate, bank, fund, click-baity media or so … !
Like this, the big positive externalities become the name of the game! Thank you!
Have a great day! And never forget, keep compounding: family, friends, hobbies, community, work, capital, knowledge, research and mindset!
Mav 👋 🤝
“Compound interest is both the ultimate and biggest natural hedge!” Maverick Equity Research

P.S. if you are into piano music, there you go with another thematic recommendation for a calm and relaxing Sunday … note the 2:34 and 3:55 tempo changes! Enjoy, cheers!
Great article, though comparing European deleveraging to the US is unreasonable in our current state. The US has massive entitlement programs, the largest military in the world, and the least healthy & least skilled constituents; which all 3 of these are incredibly difficult to dial back. I definitely believe it’s possible, but it could take decades (time we don’t have). We haven’t seen enough from DOGE, and tariffs will likely curb GDP growth. I’m hopeful because I live here, but the situation is dire and likely more similar to German hyper-inflation (previously Zimbabwe, bad example!), not Ireland.
Loved your joke about the comparison between countries and couples. Combined with this article it completely shifted my thinking about household finance. 🤯📉📈