✍️ Maverick Valuations #1 - Europe: 50 stocks + GRANOLAS
Sleek visuals & analytics via Price & Valuation scatterplots … because they say 10,000 words ... and ... further food for thought ...
Dear all,
welcome to the 1st edition of the ‘Maverick Valuations’ report covering Europe.
This report is unique, hence quite ‘Maverick-esque’ as I tried to find it served by banks, overall media, or independent investment researchers like myself, but none. Therefore, I decided to create it myself and also plan to improve it going forward.
Report is NOT behind a paywall & there are no pesky ads here. It would only be highly appreciated you just spreading the word around to likely interested people.
Report structure is the following:
📊 50 European stocks 📊
📊 GRANOLAS = The European FAAMG 📊
📊 Goldman Sachs Key Charts on Europe 📊
What are the various likely use cases provided by this report & visual analytics? Research for market leaders & laggards, likely un/warranted cheap or expensive stocks, peers analysis, stock screener, outliers, positive or negative momentum, relative strength, full equity research on single stocks & general market assessment.
My favorite use cases:
finding future winners via further deep dives / full equity research
finding stocks that did well across past tough times, hence resilient winners … which are likely also going forward to be future winners
Great to have at hand at least 8 times per year: before & after each of the 4 quarterly earnings. An overall yearly recap is also very interesting. Let’s see after most Q4 2022 earnings are out & usefully compare going forward with the future editions. Check your stocks & also outliers in the scatterplots, it can get interesting & food for thought.
📊 50 European stocks 📊
What’s inside? European coverage via 50 businesses diversified across sectors & industries, market cap (size), and both value & growth (style). How? Via sleek visuals & analytics, namely price & valuation scatterplots because they say 1,000 words. Full names, tickers with sectors & industries to begin with:
6 visuals total now from my side, 3 on price & 3 on valuation:
Price action views:
2023 YTD Winners & Rebounders from their 52-week low
2023 YTD Winners & Total Return for 2022 to answer the research question: which stocks were positive both in the 2022 bear market and up to today in 2023?
Here on recent performance returns, it is quite interesting at times to plot it like this: 1 year past returns with Earnings/EPS growth. Rationale? We want to spot companies with declined stock price, but still strong expected growth
Valuation views via:
Sales/Revenue aka ‘Top-line’ view: P/S multiple & Revenue growth (next year estimates). Interpretation: Forward P/S multiple the stock is trading at for the given level of estimated Sales growth
Profitability aka ‘Bottom-line’ view: P/E multiple & Earnings/EPS growth (next year estimates). Interpretation: Forward P/E multiple the stock is trading at for the given level of estimated Earnings/EPS growth
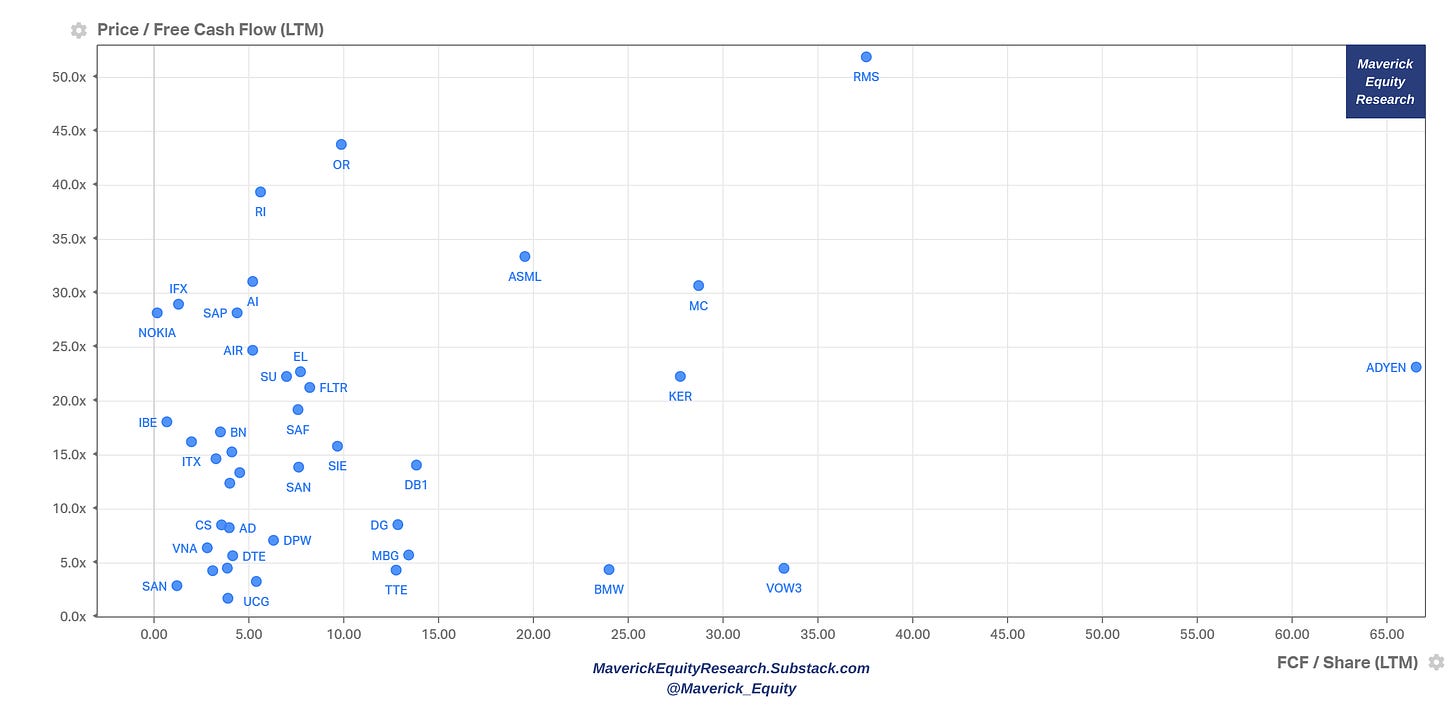
Free Cash flow aka ‘cash’ view: P/FCF multiple & FCF/Share (last twelve months). Interpretation: P/FCF multiple the stock is trading at for the given level of FCF/Share
📊 GRANOLAS = The European FAAMG 📊
Who are the ‘GRANOLAS’? Not many heard given not much covered, but they are Europe’s large-cap/blue chips Compounders: GlaxoSmithKline, Roche, ASML, Nestle, Novartis, Novo Nordisk, L’Oreal, Louis Vuitton, AstraZeneca, SAP & Sanofi
6 visuals total now from my side, 3 on price & 3 on valuation:
Price action views:
2023 YTD Winners & Rebounders from their 52-week low
2023 YTD Winners & Total Return for 2022 to answer the research question: which stocks were positive both in the 2022 bear market and up to today in 2023?
Here on recent performance returns, it is quite interesting at times to plot it like this: 1 year past returns with Earnings/EPS growth. Rationale? We want to spot companies with declined stock price, but still strong expected growth
Valuation views via:
Sales/Revenue aka ‘Top-line’ view: P/S multiple & Revenue growth (next year estimates). Interpretation: Forward P/S multiple the stock is trading at for the given level of estimated Sales growth
Profitability aka ‘Bottom-line’ view: P/E multiple & Earnings/EPS growth (next year estimates). Interpretation: Forward P/E multiple the stock is trading at for the given level of estimated Earnings/EPS growth
Free Cash flow aka ‘cash’ view: P/FCF multiple & FCF/Share (last twelve months). Interpretation: P/FCF multiple the stock is trading at for the given level of FCF/Share
📊 Goldman Sachs Key Charts on Europe 📊
16 visuals total now from Goldman Sachs with key notes:
The ‘Compounders’ - Europe’s big caps the GRANOLAS vs. FAAMG companies in the US – first look at this…
… then this:
…and finally this – FAAMG margins are under pressure but GRANOLAS enjoy cont’d premium margins:
The secular underperformance of value vs growth has shifted, and we think this trend is likely to continue - should benefit Europe given mostly value-stocks
Valuation - Europe relative to the US: Europe’s discount to the US is especially large. All sectors in Europe are currently on a discount to the US. Europe is cheap vs the US also when adjusting for sector composition:
Using Global sector weights Europe & UK trade on a large discount to the US market
US & Europe valuation differential is not fully justified by expected growth rates:
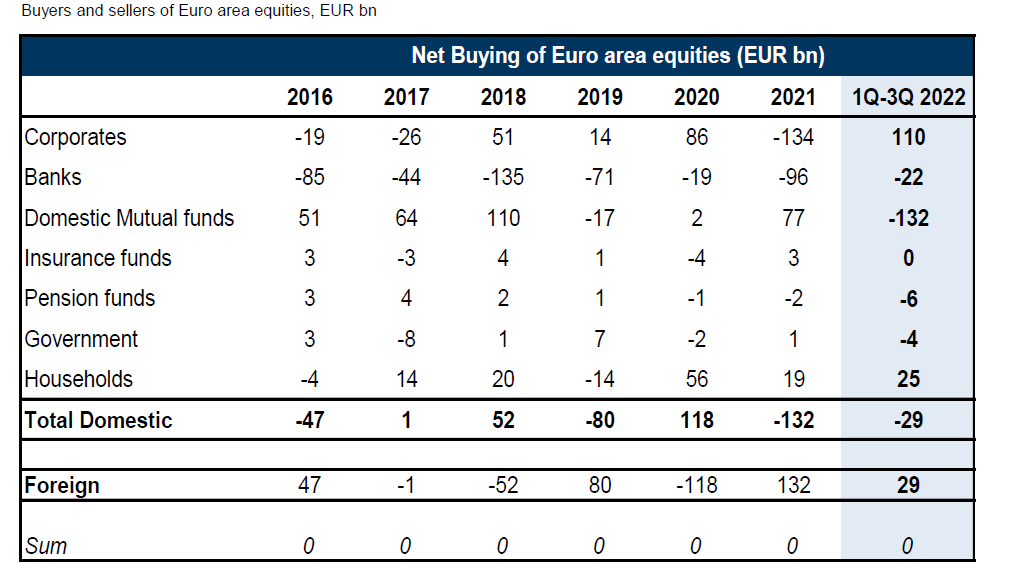
There’s still room for foreign buyers to step in / increase exposure. They haven’t actually bought much yet – the big buyers of Europe have been corporates:
Even ahead of the recent distressing events, the discount for European Banks was wide versus the history of the post-GFC period & it’s widened since. Sure, EU banks have seen a great deal of momentum before recently – but looking at the sector over a few years it still looks relatively cheap:
This is a chart we show to non-European investors. Europe’s exposure to Europe is actually much less significant vs other regional indices. In fact, NorthAm, China, LatAm are sizeable regional exposures, and Luxury & Tech have caught up with Banks & Energy in terms of market share:
I hope you enjoyed this extensive research & it would be great to hear your feedback! Should you have found this endeavour interesting and valuable, just subscribe & share it around with likely interested people. Thank you!
Have a great day!
Maverick Equity Research
P.S. in case you missed: my 2022 European Stock Screener and the 2023 update


GRANOLAS, that’s so cool … had no clue about this group, will study some more … thanks a lot!
GRANOLAS, never heard ... quite cool & unique coverage, nice to see ... most newsletter just recycle what all the others do, it gets annoying and a waste of time ... time to clean-up ... thanks!