


✍️ Maverick Valuations #1 - USA: Dow Jones, S&P 500 & Nasdaq 100
Sleek Visuals & Analytics via Price & Valuation scatterplots … because they say 1,000 words ... and ... further food for thought ...

Dear all,
welcome to the 1st edition of the ‘Maverick Valuations’ report covering USA, namely the big 3: Dow Jones, S&P 500 & Nasdaq 100 indices. That is 30 + 500 + 100 = 630 stocks in one report. How? Via Sleek Visuals & Analytics via Price & Valuation scatterplots and more … because they say 1,000 words.
This report is unique, hence quite ‘Maverick-esque’ as I tried to find it done & served somewhere else (comfy, no?), be it by banks, overall media, or independent investment researchers like myself. Therefore, I decided to create it and plan to improve it as we move forward. Was willing to pay for a good regular service straight to my inbox, yet none, but if you find similar somewhere, please let me know.
Report is NOT behind a paywall & there are no pesky ads here. It would only be highly appreciated if you just spread the word around to likely interested people.
Report structure = the big 3 stock indices + bonus:
📊 Dow Jones … aka ‘The Dow’ 📊
📊 S&P 500 … aka ‘The Market’ 📊
📊 Nasdaq 100 … aka ‘Tech’ 📊
= 30 + 500 + 100 = 630 stocks via sleek visuals
🏦 Bonus Charts 🏦
What are the various likely use cases provided by this report & visual analytics? Research for market leaders & laggards, likely un/warranted cheap or expensive stocks, peers analysis, stock screener, outliers, positive or negative momentum, relative strength, full equity research on single stocks & general market assessment.
My favorite use cases:
finding future winners via further deep dives / full equity research
finding stocks that did well across past tough times, hence resilient winners … which are likely also going forward to be future winners
finding ‘Pick & Shovel’ businesses that span across industries with many use cases which can make tick 2 boxes in the same time: limited downside risk though still keeping good potential upside
Great to have at hand at least 8 times per year: before & after each of the 4 quarterly earnings. An overall yearly recap is also very interesting. Let’s see now after Q4 2022 earnings & usefully compare going forward with the future editions. Check your stocks & the outliers in the scatterplots, it can get interesting & food for thought.
Introduction before anything, the 10 years Total Return & CAGR of the big 3 indices:

📊 Dow Jones … aka ‘The Dow’ 📊
Let’s start with the Dow Jones Industrial Average (DJIA). Created in 1896, is one of the oldest and most widely recognized stock market indices in the world, and is made up of 30 blue-chip stocks that are considered to be leaders in their respective industries. 4 visuals total:
Price action view: 2023 YTD Winners & Rebounders from their 52-week low

Sales/Revenue aka ‘Top-line’ view: P/S multiple & Revenue growth (next year estimates). Interpretation: Forward P/S multiple the stock is trading at for the given level of estimated Sales growth

Profitability aka ‘Bottom-line’ view: P/E multiple & Earnings/EPS growth (next year estimates). Interpretation: Forward P/E multiple the stock is trading at for the given level of estimated Earnings/EPS growth

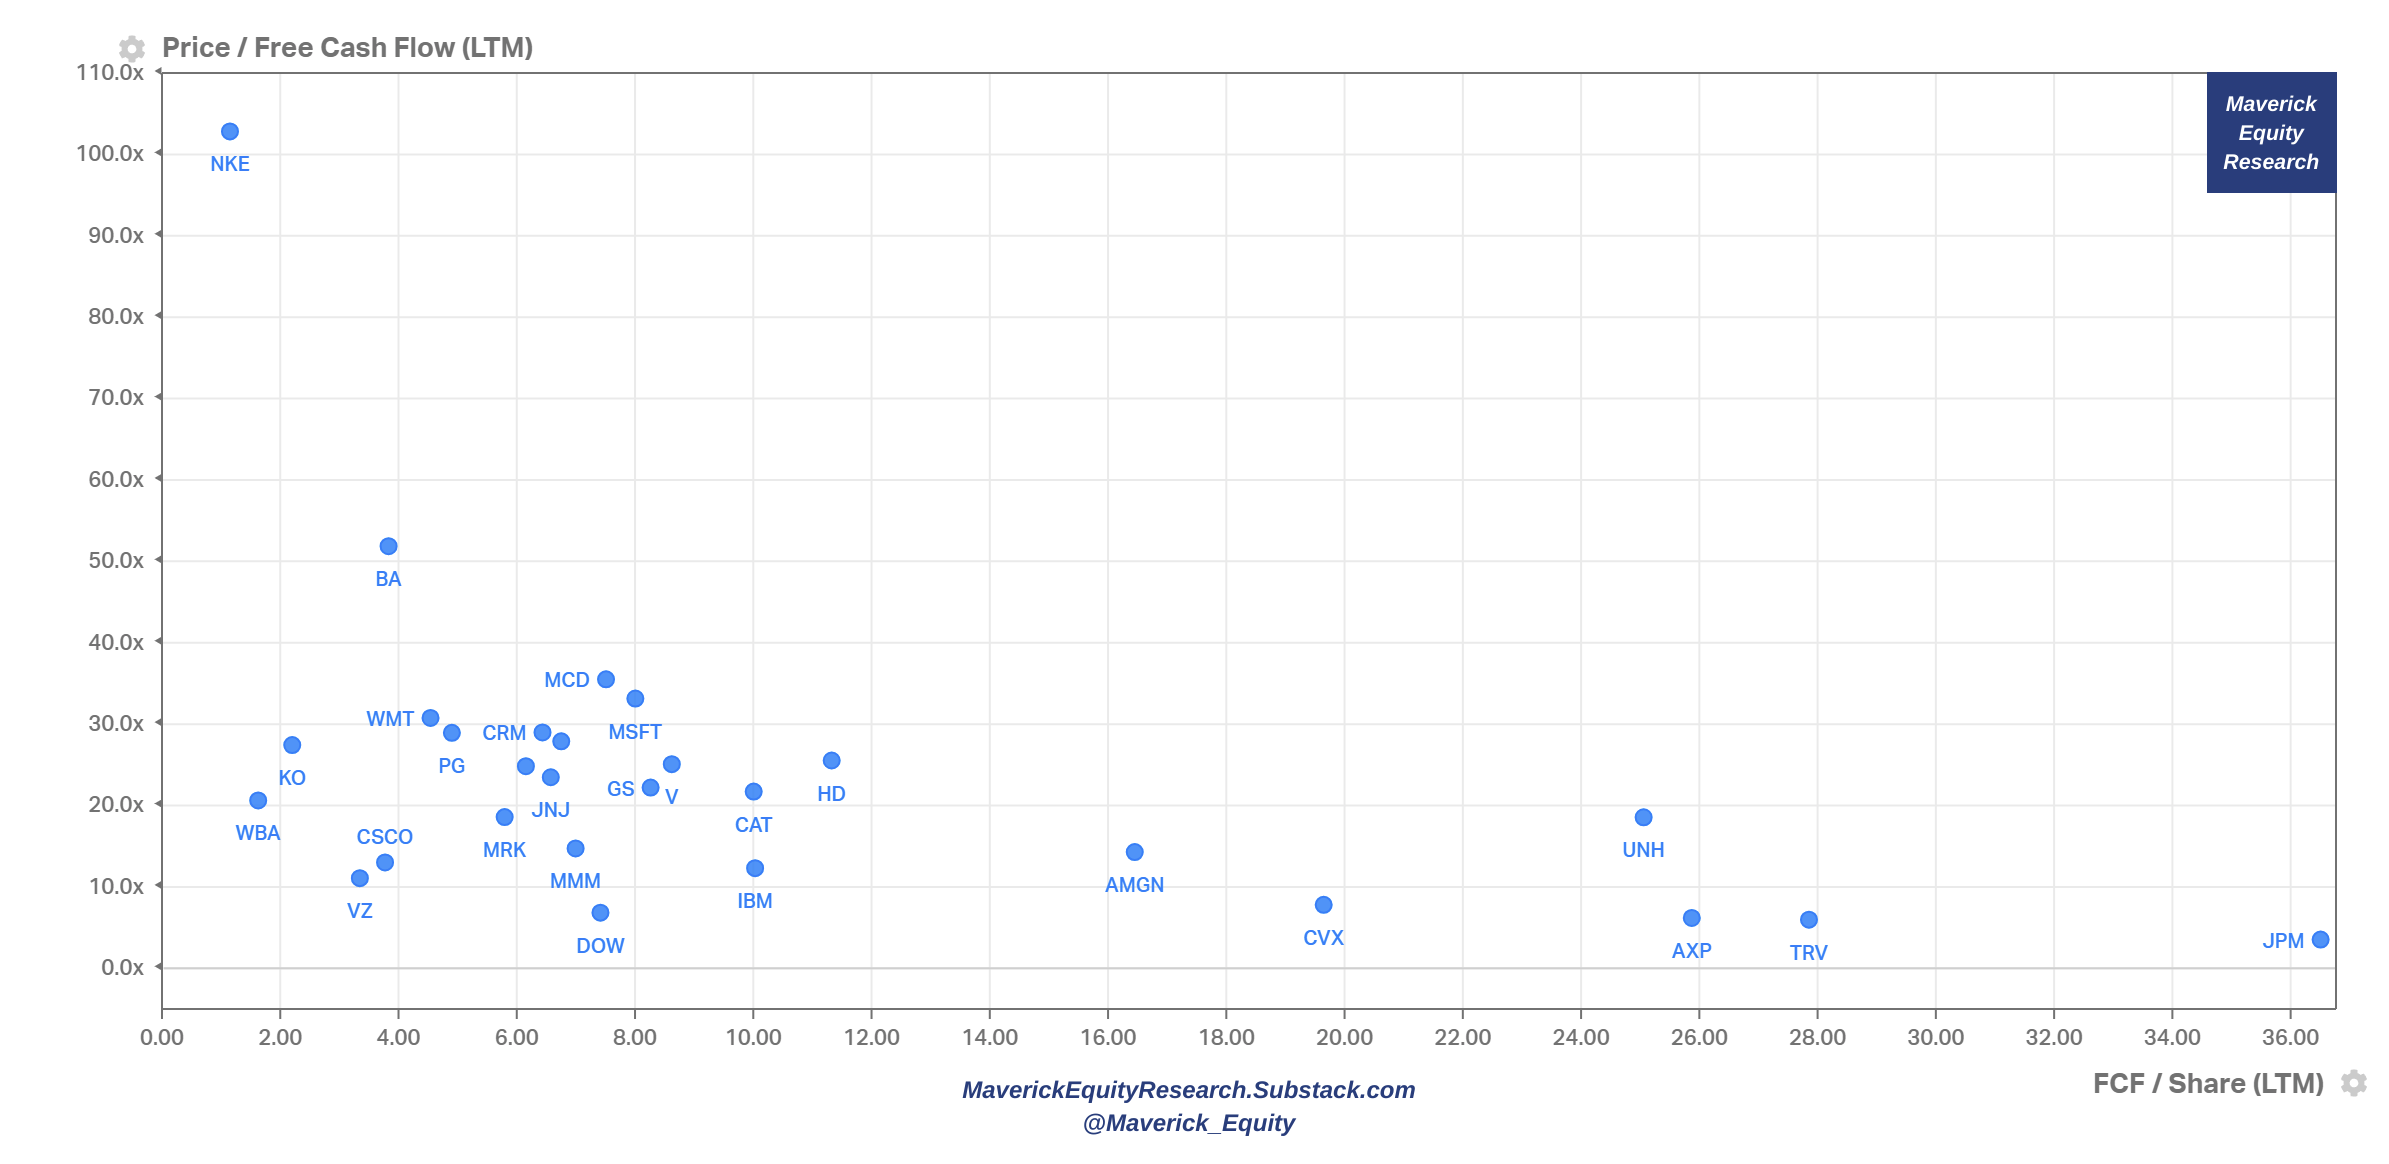
Free Cash flow aka ‘cash’ view: P/FCF multiple & FCF/Share (last twelve months). Interpretation: P/FCF multiple the stock is trading at for the given level of FCF/Share
Dow Jones Sector Breakdown (Source: PlantDollar):
")
📊 S&P 500 … aka ‘The Market’ 📊
Moving on to the mighty S&P 500 aka ‘The Market’. First introduced in 1957 has become one of the most widely followed and cited indices in the world, and tracks the performance of the 500 largest publicly traded companies in the US.
Let’s start with four S&P 500 overall index views & then going more granular into the index via five single stocks view. 9 visuals total:
S&P 500 forward P/E: the forward 12-month P/E ratio is 17.2x which is below the 5-year average of 18.5x and below the 10-year average of 17.3x

S&P 500 forward EPS & price - after price decoupled strongly since 2020, now the price & EPS are back aligned … quite a wild ride that was lately

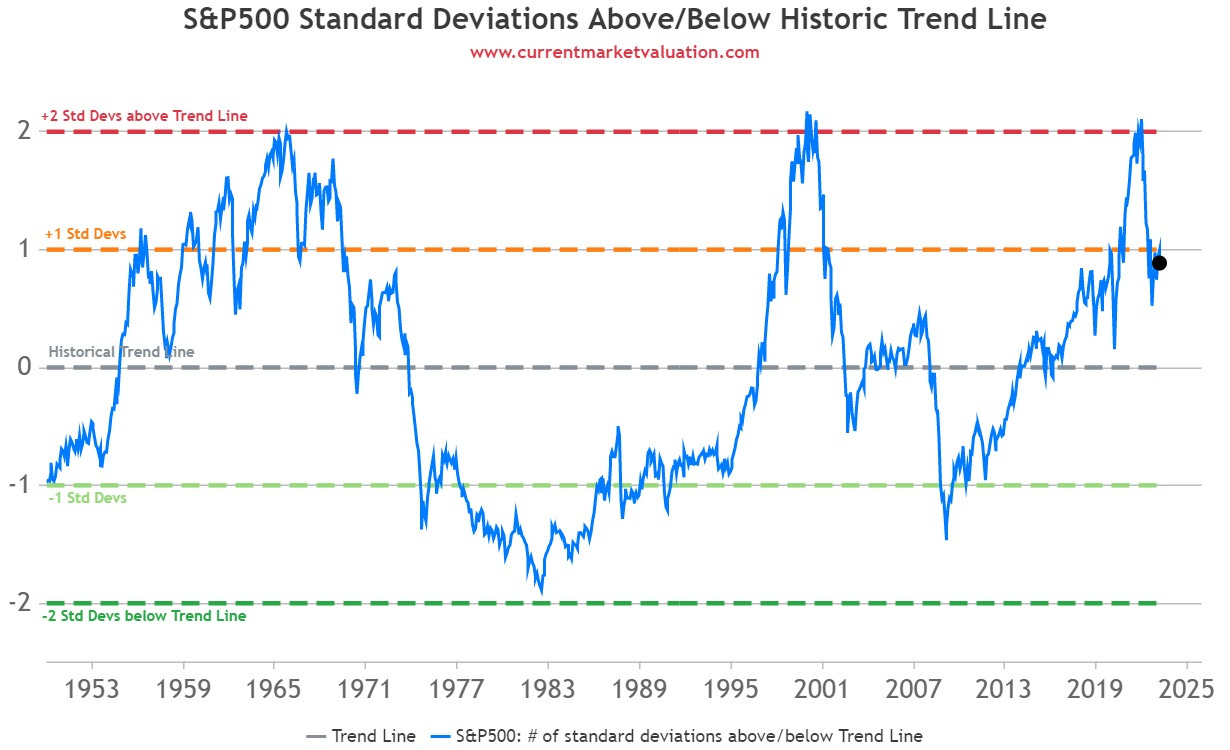
Interest Rates valuation view: as of March 10, 2023, the 10Y Treasury bond rate was 3.70%, which is 0.7 standard deviations below normal. Likewise, the S&P500 value of $3,862 is 0.9 standard deviations above its own respective trendline. Summed together, this gives a composite value of 0.2 standard deviations above normal, indicating that stocks are currently Fairly Valued.

Mean-Reversion valuation, similar: S&P500 is currently 0.9 standard deviations above its historical trend line, suggesting the market is currently Fairly Valued.
Price action 1, single stocks view: 2023 YTD Winners & Rebounders from their 52-week low
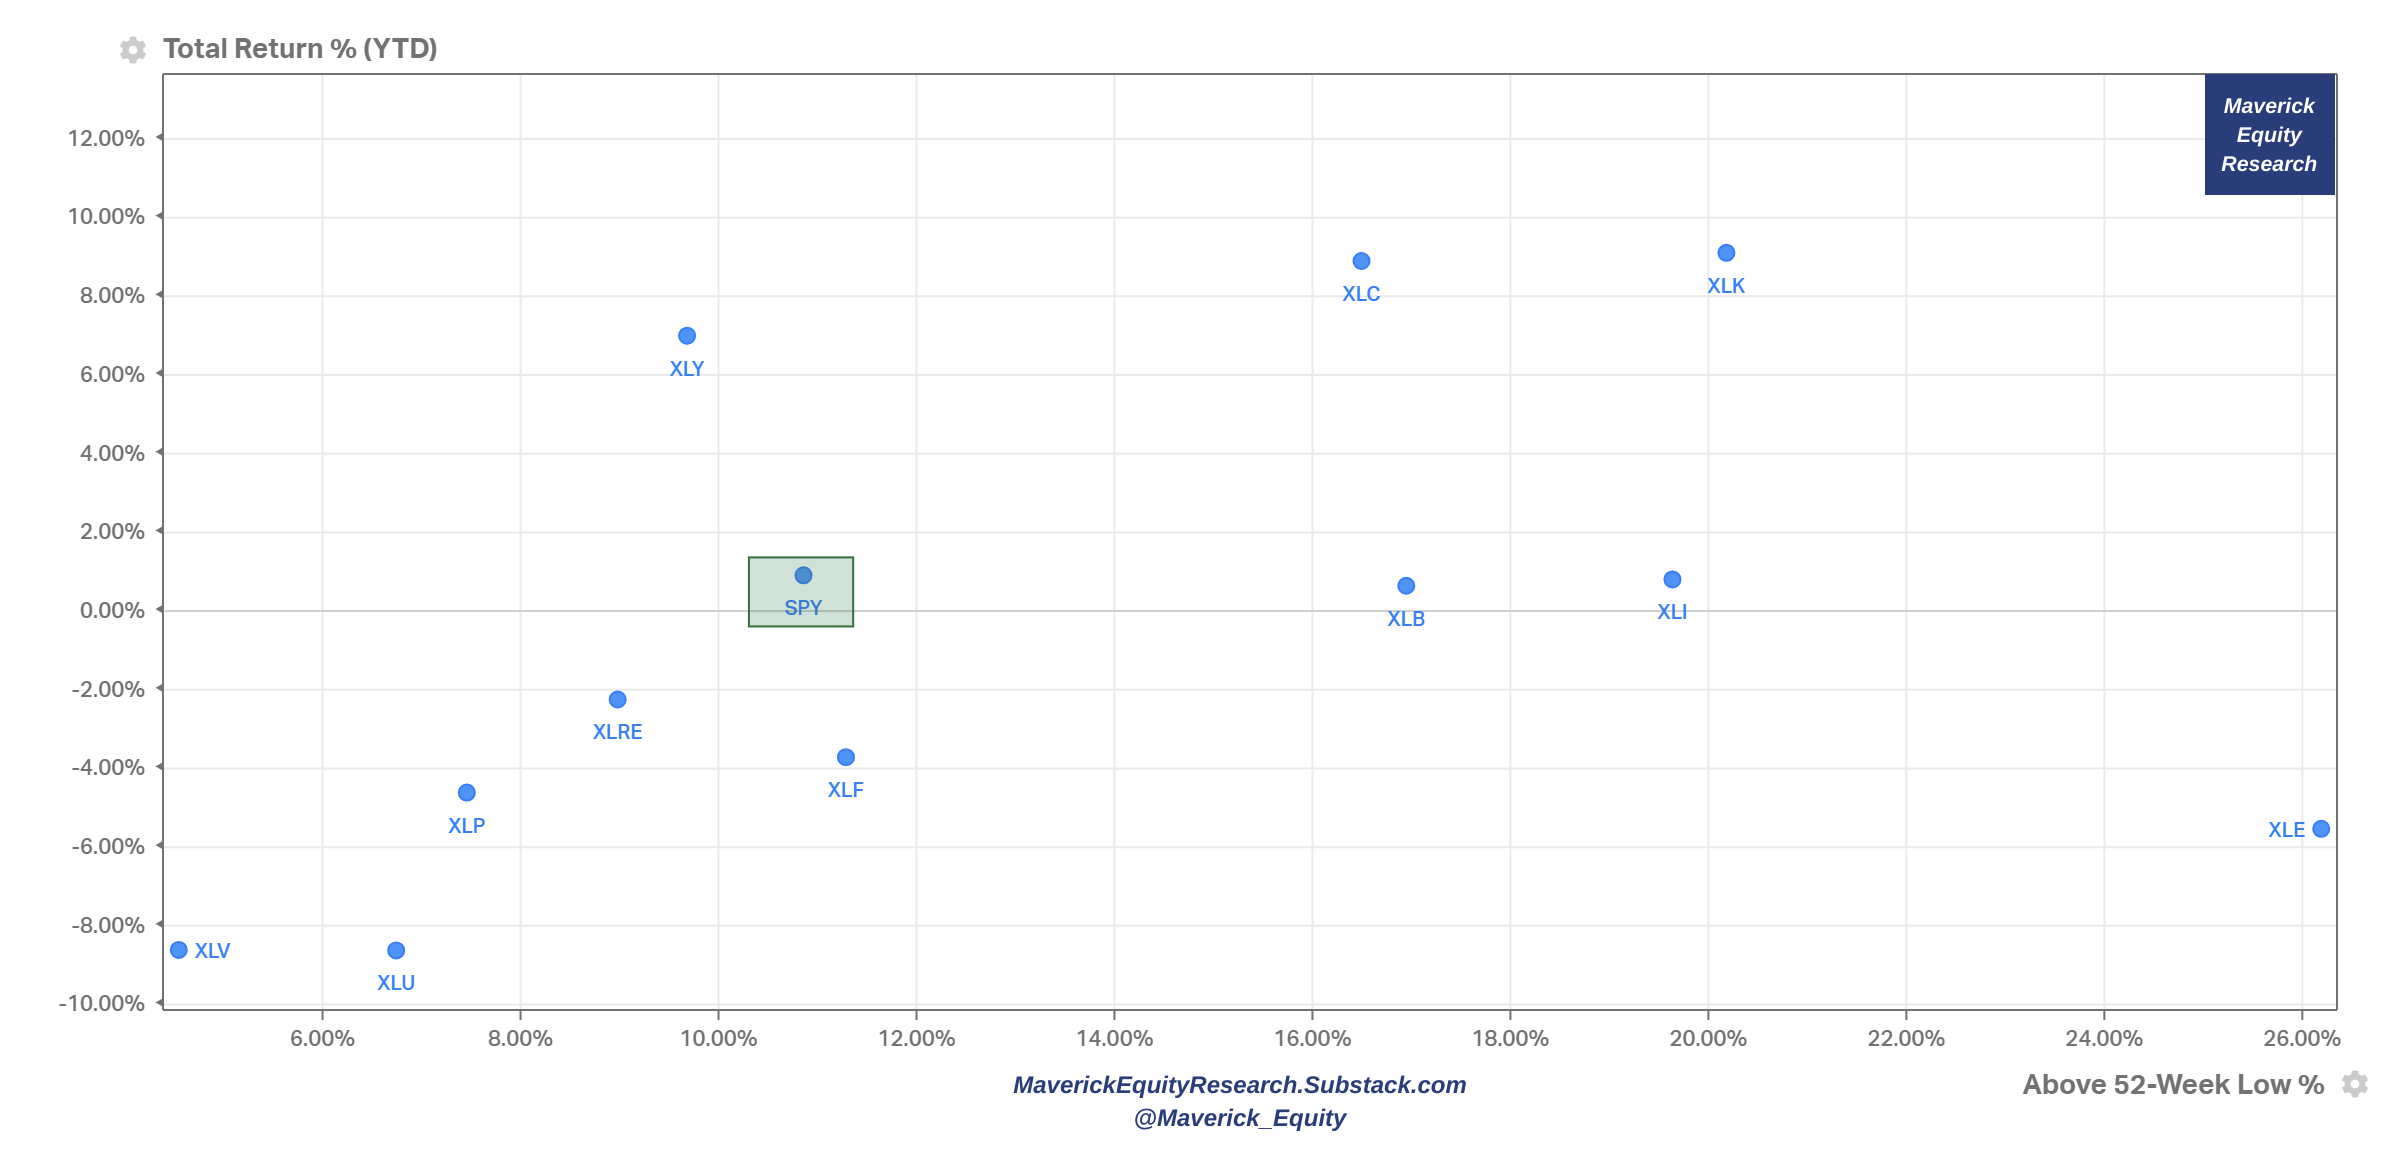
Price action 2, Sector view: S&P 500 11 Sectors & the S&P 500 itself for a Sectors Performance & Rotation view - 2023 Winners & Rebounders from the 52-week low
Sales/Revenue aka ‘Top-line’ view: P/S multiple & Revenue growth (next year estimates). Interpretation: Forward P/S multiple the stock is trading at for the given level of estimated Sales growth

Profitability aka ‘Bottom-line’ view: P/E multiple & Earnings/EPS growth (next year estimates). Interpretation: Forward P/E multiple the stock is trading at for the given level of estimated Earnings/EPS growth

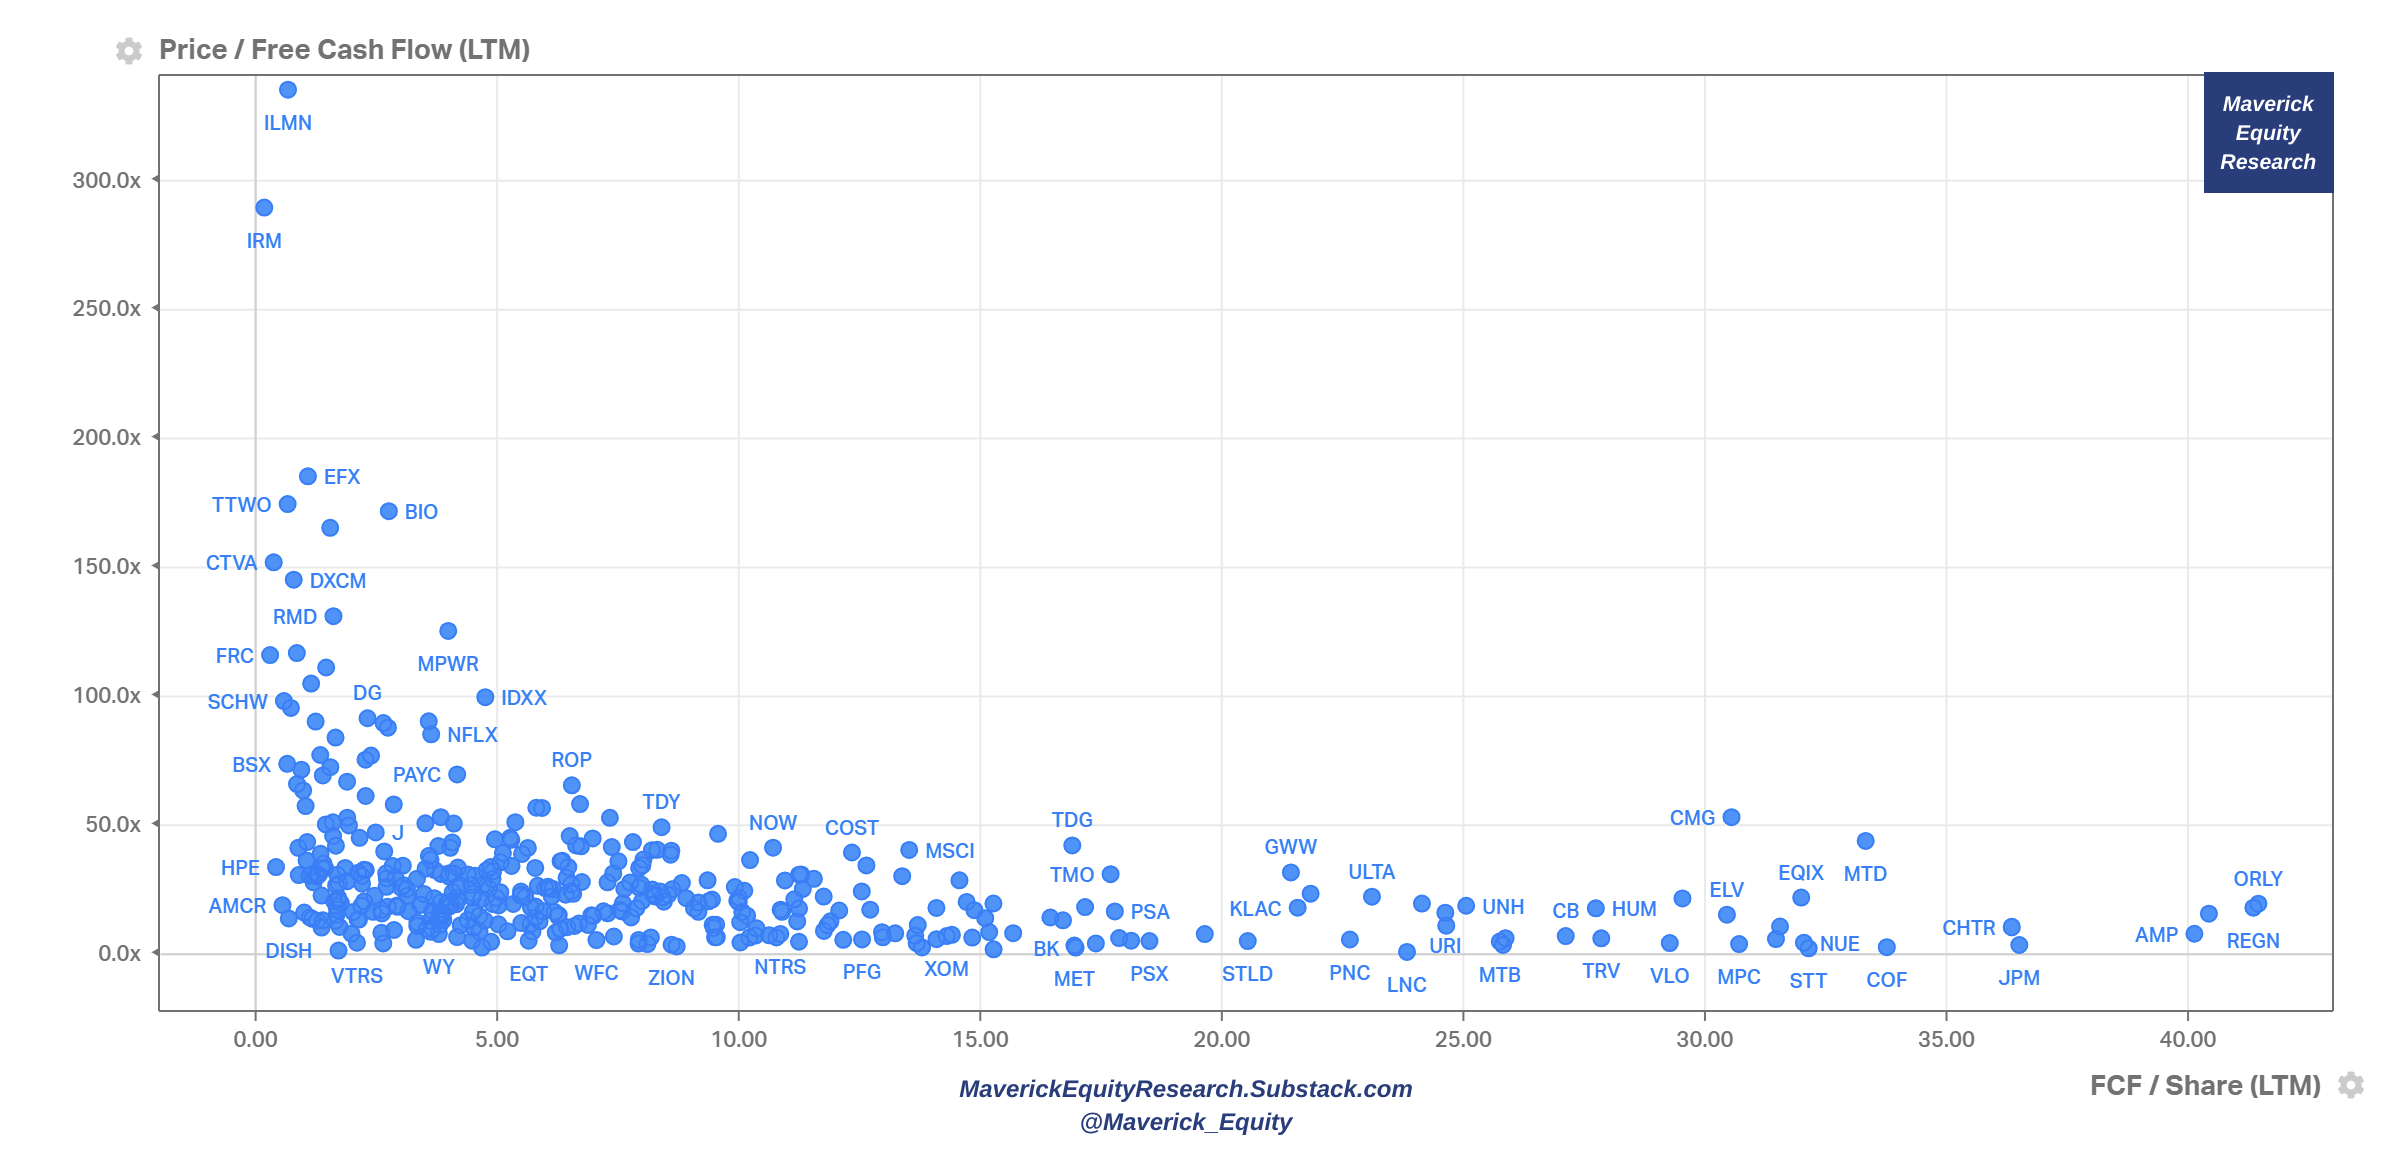
Free Cash flow aka ‘cash’ view: P/FCF multiple & FCF/Share (last twelve months). Interpretation: P/FCF multiple the stock is trading at for the given level of FCF/Share
Now given that 500 companies are naturally very cluttered into 1 single chart, the 11 sectors that make the S&P 500 index deserve each their own deeper analytics.
Legend for the newer investors & recall for the experienced: XLC = Communication Services, XLY = Consumer Discretionary, XLK = Technology, XLB = Basic Materials, XLI = Industrials, XLF = Financials, XLRE = Real Estate, XLE = Energy, XLP = Consumer Staples, XLV = Health Care, XLU = Utilities
To begin with, the S&P 500 Sector Breakdown (Source: PlantDollar):

Now let’s dive into the Price/Performance & Valuation scatterplots for the 11 sectors. 1 price with 2 valuation scatterplots (P/S & P/E) for each of the 11 sectors = 33 visuals
XLY - Consumer Discretionary
Price action: 2023 YTD Winners & Rebounders from their 52-week low

Sales/Revenue aka ‘Top-line’: P/S multiple & Revenue growth (next full year forward estimates)

Profitability aka ‘Bottom-line’: P/E multiple & Earnings/EPS growth (next full year forward estimates)

XLP - Consumer Staples
Price action: 2023 YTD Winners & Rebounders from their 52-week low

Sales/Revenue aka ‘Top-line’: P/S multiple & Revenue growth (next full year forward estimates)

Profitability aka ‘Bottom-line’: P/E multiple & Earnings/EPS growth (next full year forward estimates)

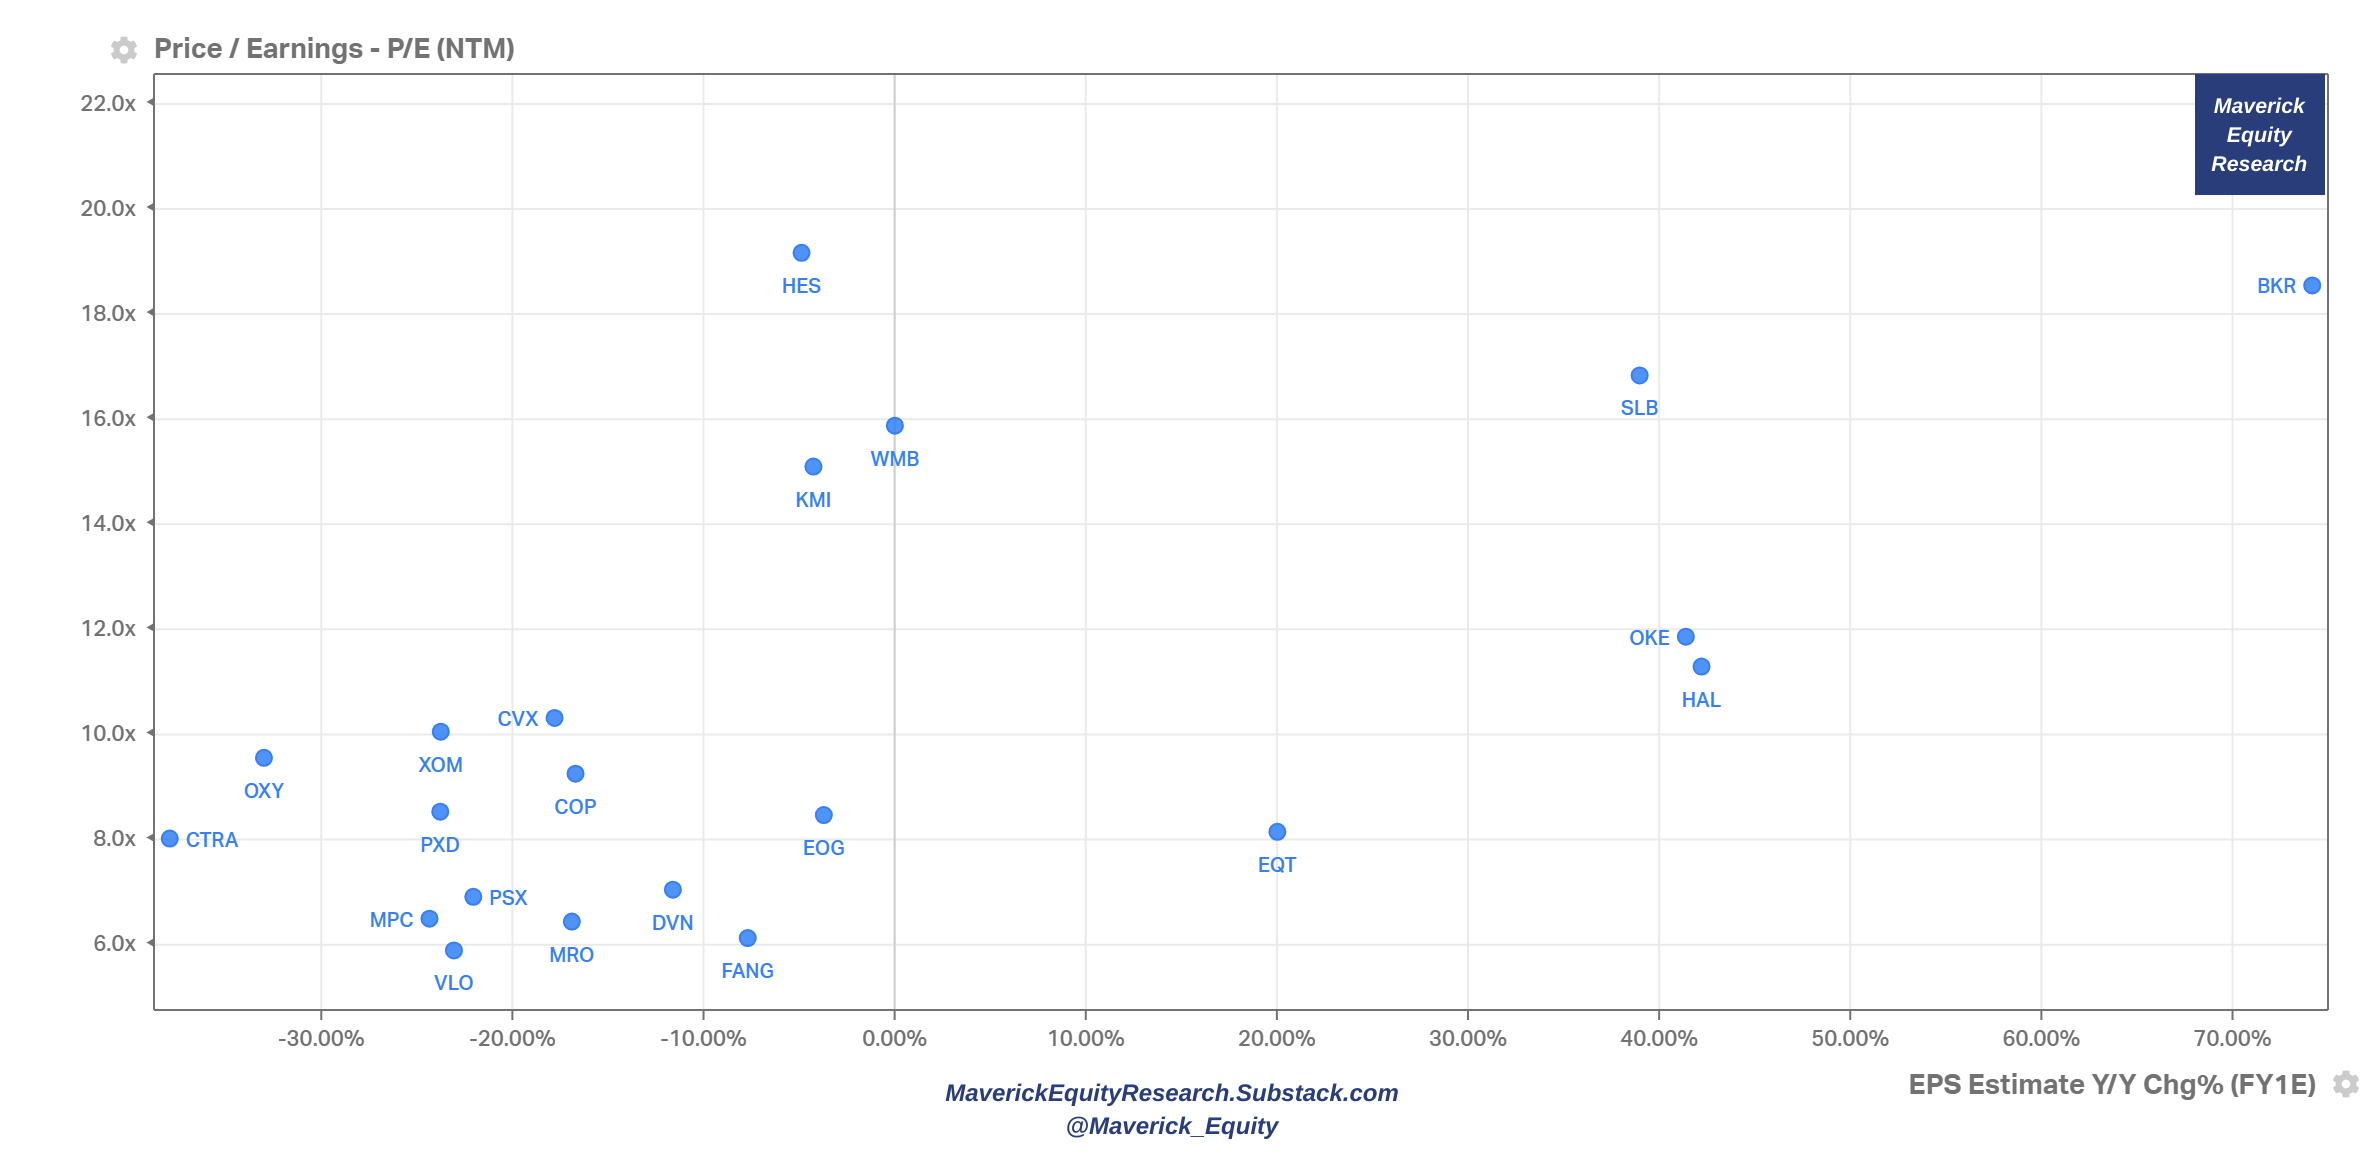
XLE - Energy
Price action: 2023 YTD Winners & Rebounders from their 52-week low

Sales/Revenue aka ‘Top-line’: P/S multiple & Revenue growth (forward)
Profitability aka ‘Bottom-line’: P/E multiple & Earnings/EPS growth (forward)
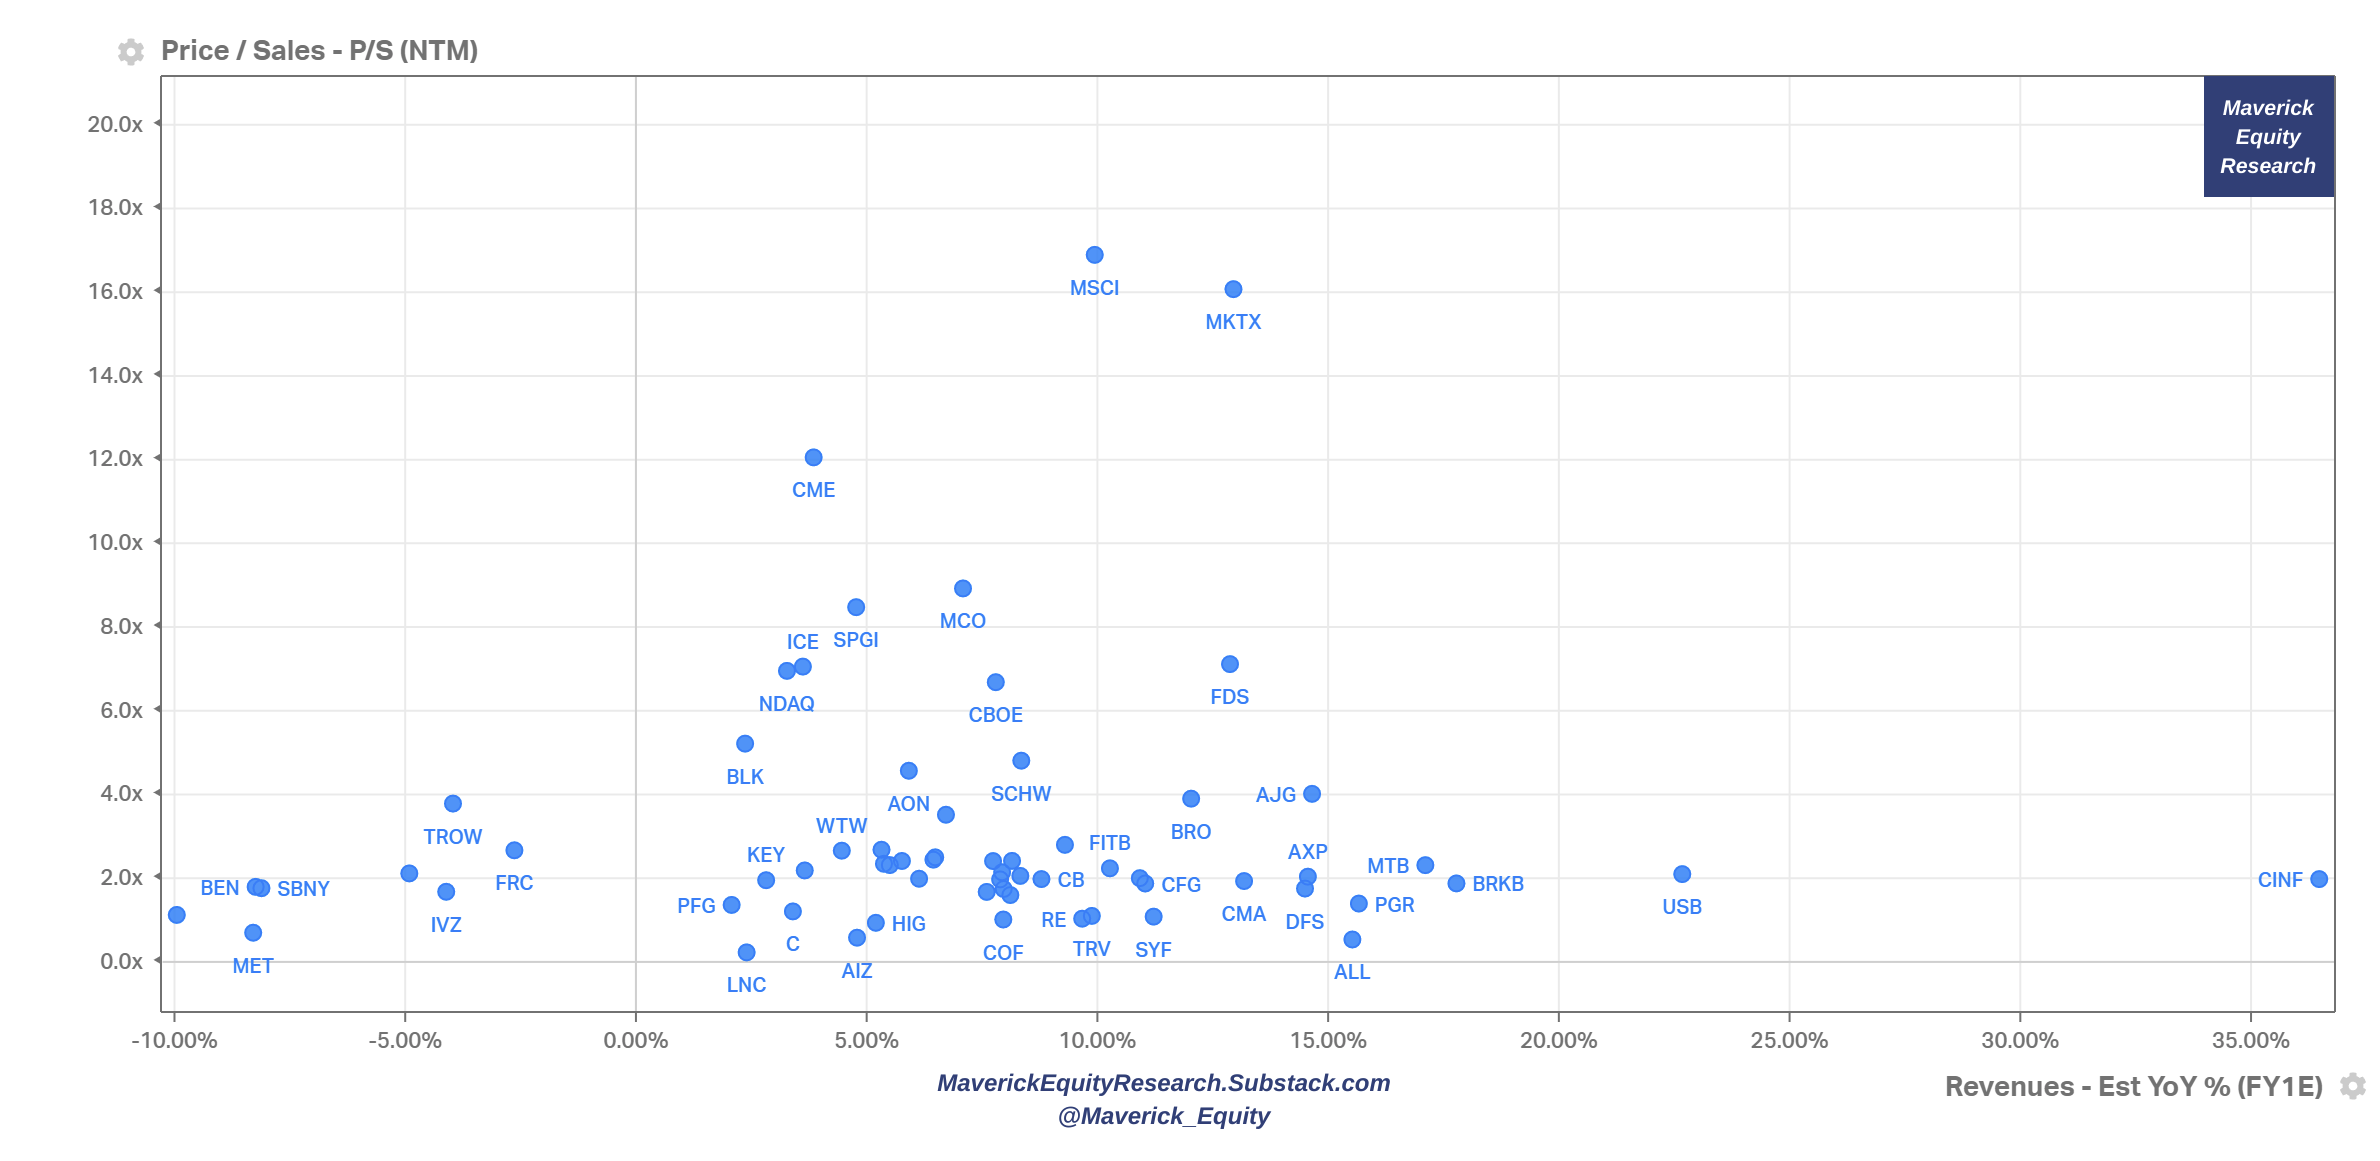
XLF - Financials
Price action: 2023 YTD Winners & Rebounders from their 52-week low

Sales/Revenue aka ‘Top-line’: P/S multiple & Revenue growth (forward)
Profitability aka ‘Bottom-line’: P/E multiple & Earnings/EPS growth (forward)

XLV - Health Care
Price action: 2023 YTD Winners & Rebounders from their 52-week low

Sales/Revenue aka ‘Top-line’: P/S multiple & Revenue growth (forward)

Profitability aka ‘Bottom-line’: P/E multiple & Earnings/EPS growth (forward)

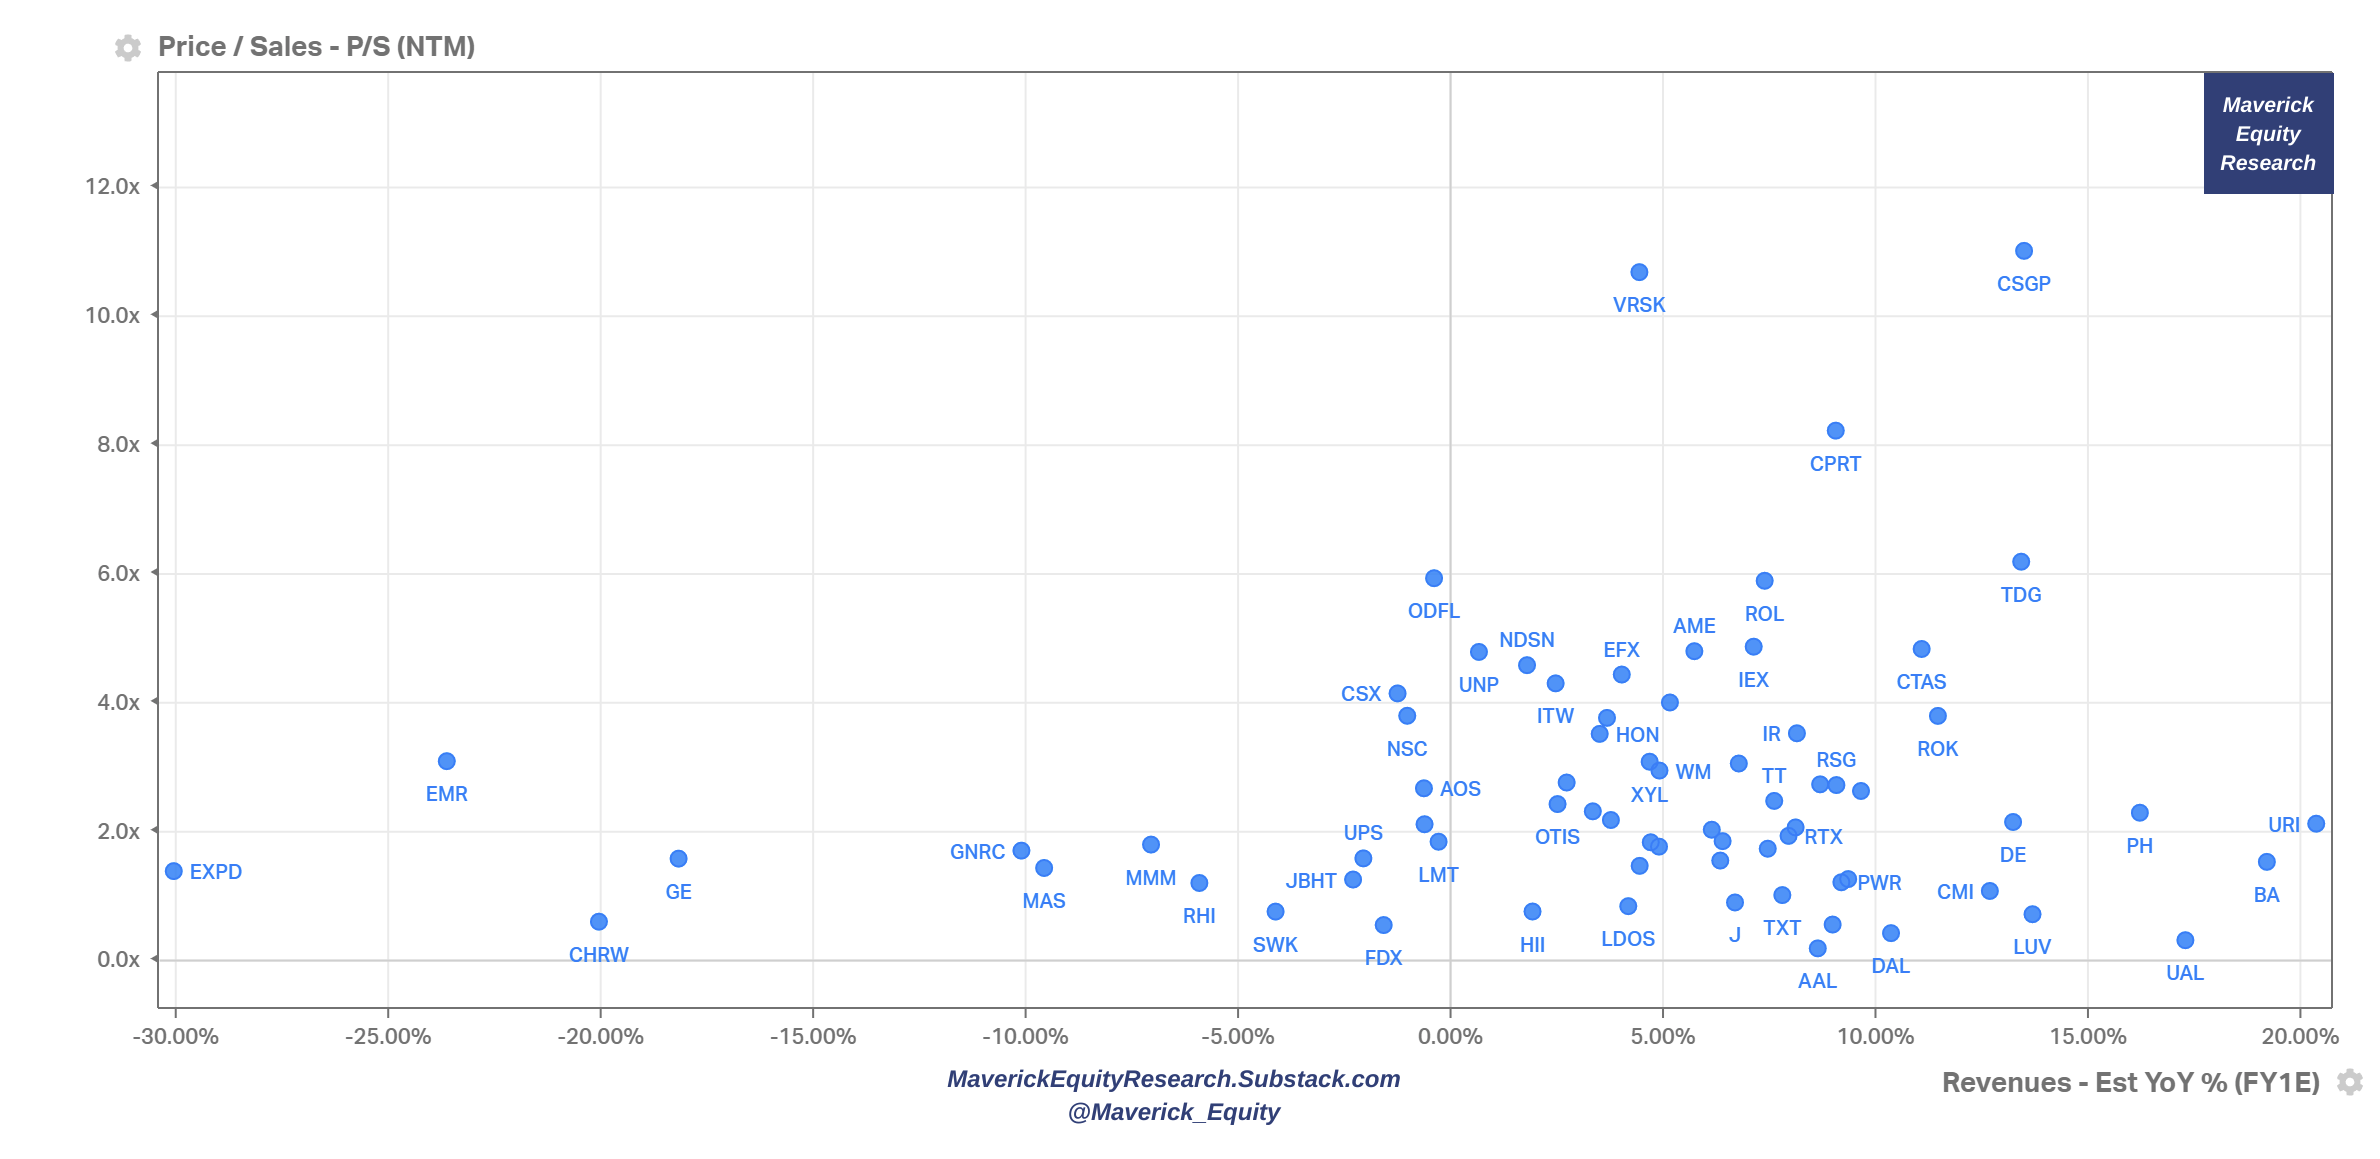
XLI - Industrials
Price action: 2023 YTD Winners & Rebounders from their 52-week low

Sales/Revenue aka ‘Top-line’: P/S multiple & Revenue growth (forward)
Profitability aka ‘Bottom-line’: P/E multiple & Earnings/EPS growth (forward)

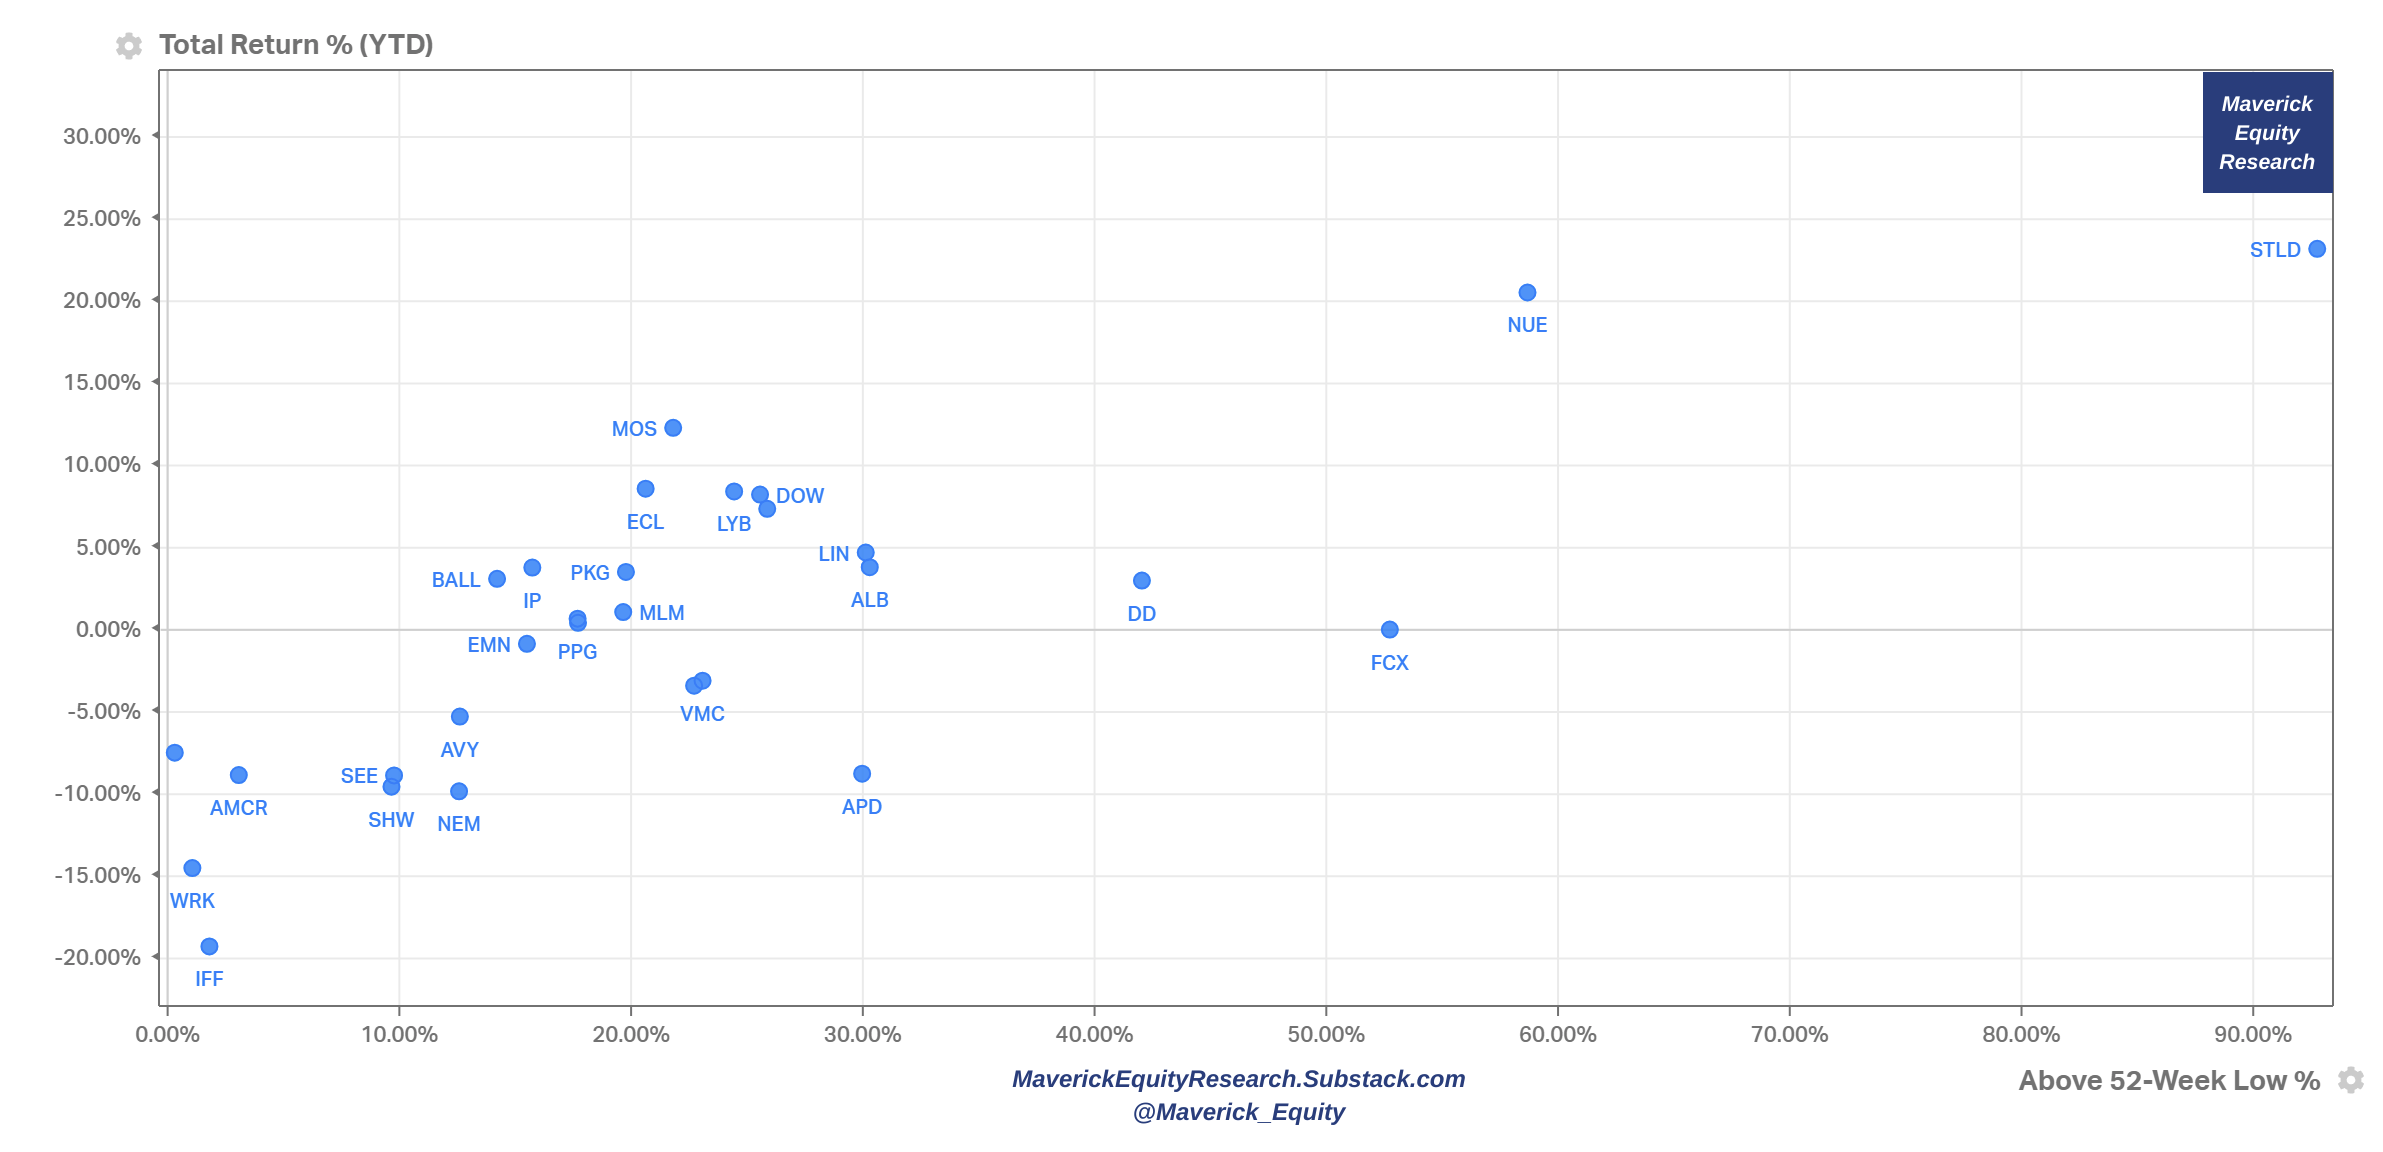
XLB - Materials
Price action: 2023 YTD Winners & Rebounders from their 52-week low
Sales/Revenue aka ‘Top-line’: P/S multiple & Revenue growth (forward)

Profitability aka ‘Bottom-line’: P/E multiple & Earnings/EPS growth (forward)

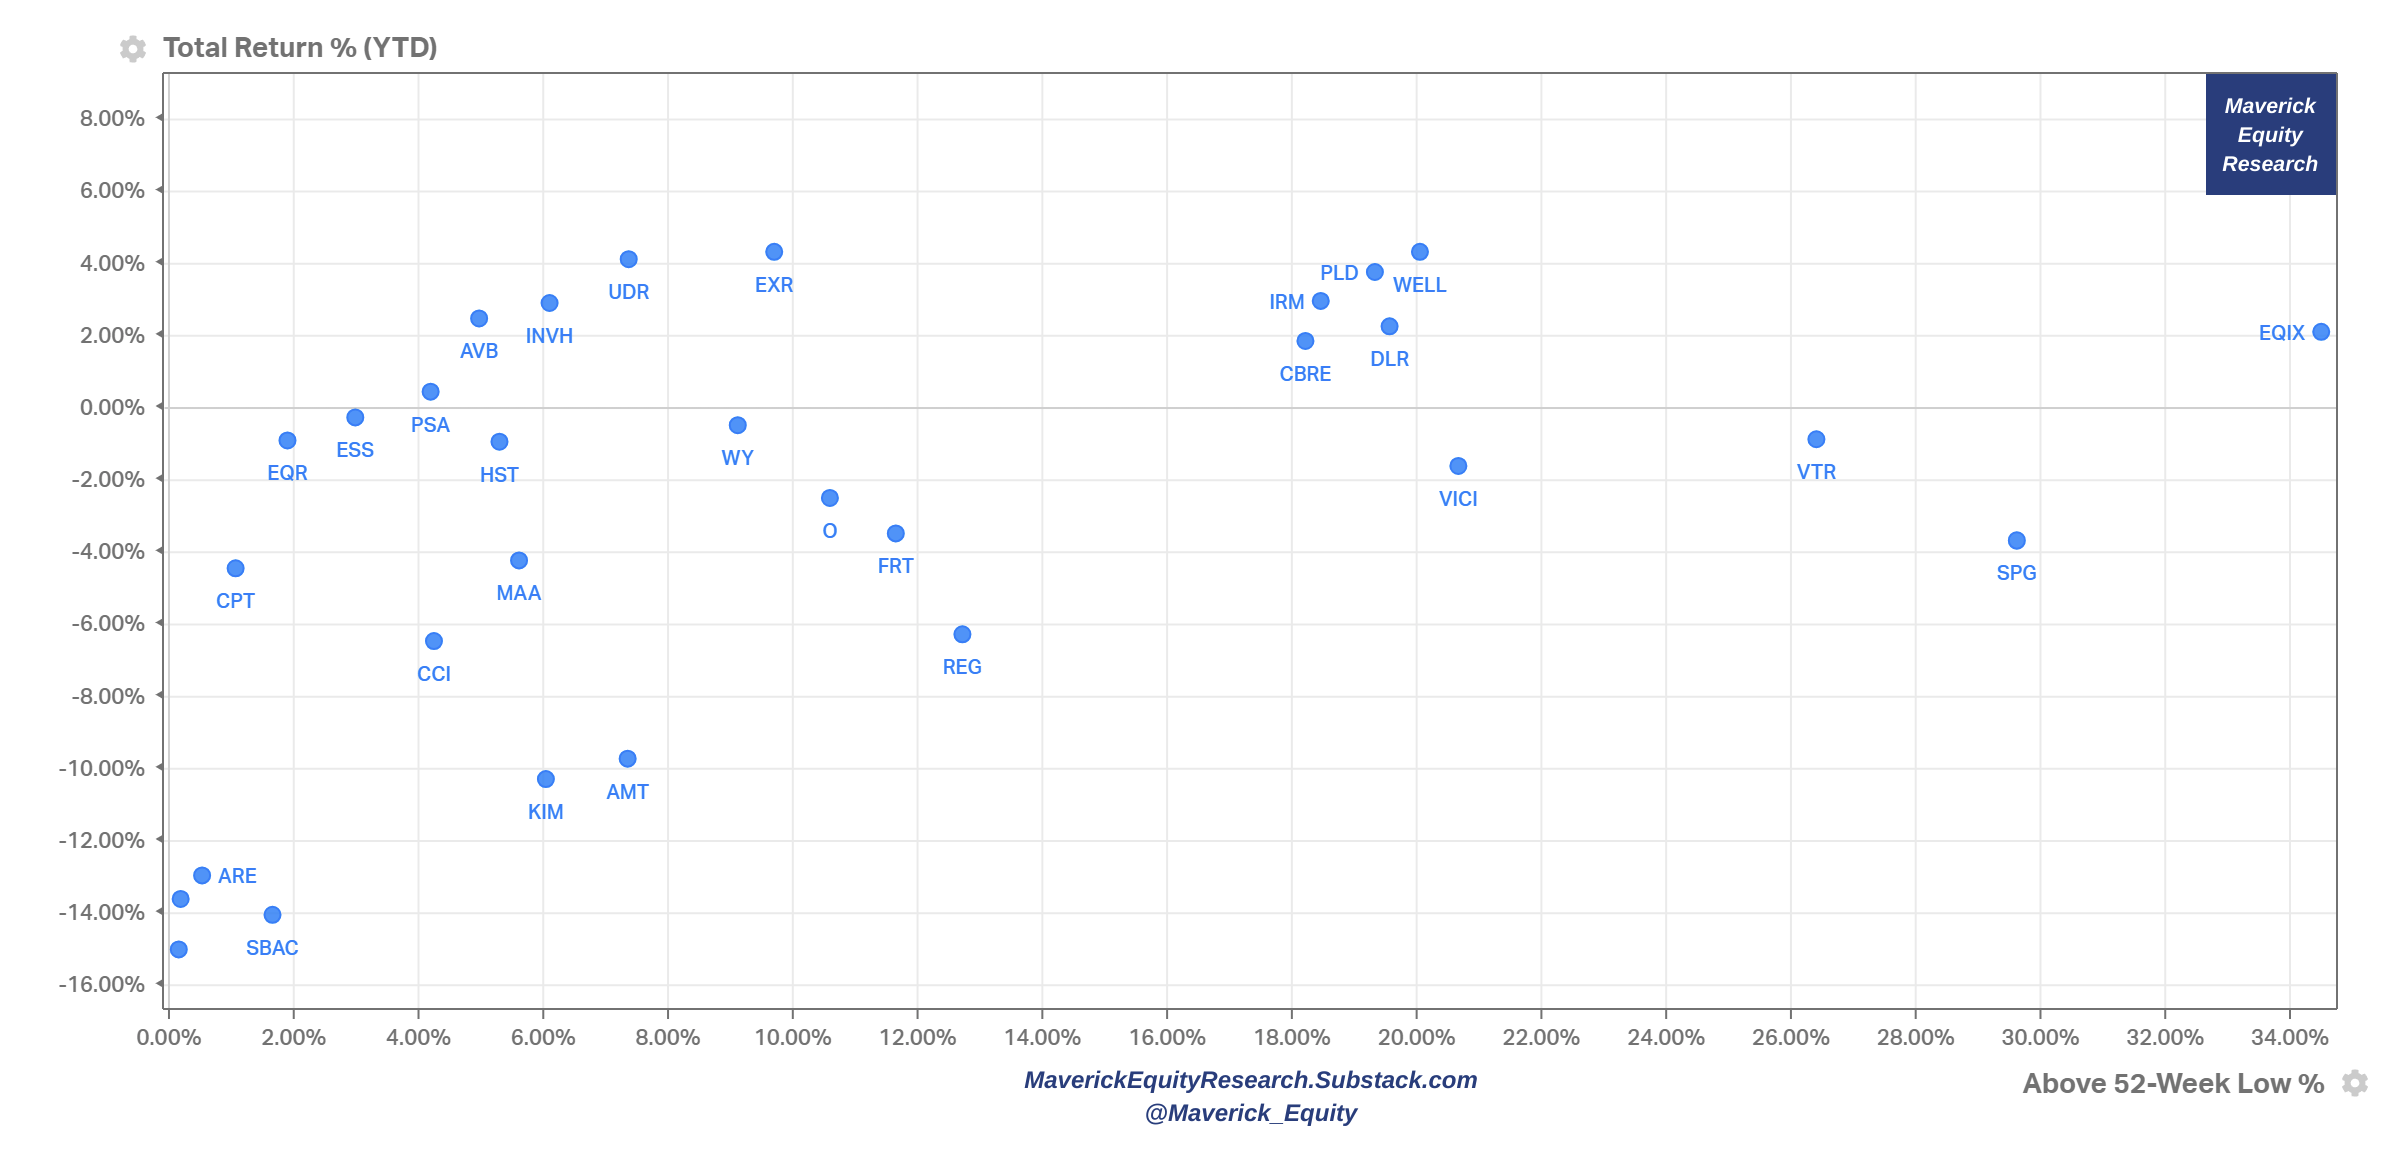
XLRE - Real Estate
Price action: 2023 YTD Winners & Rebounders from their 52-week low
Sales/Revenue aka ‘Top-line’: P/S multiple & Revenue growth (forward)

Profitability aka ‘Bottom-line’: P/E multiple & Earnings/EPS growth (forward)

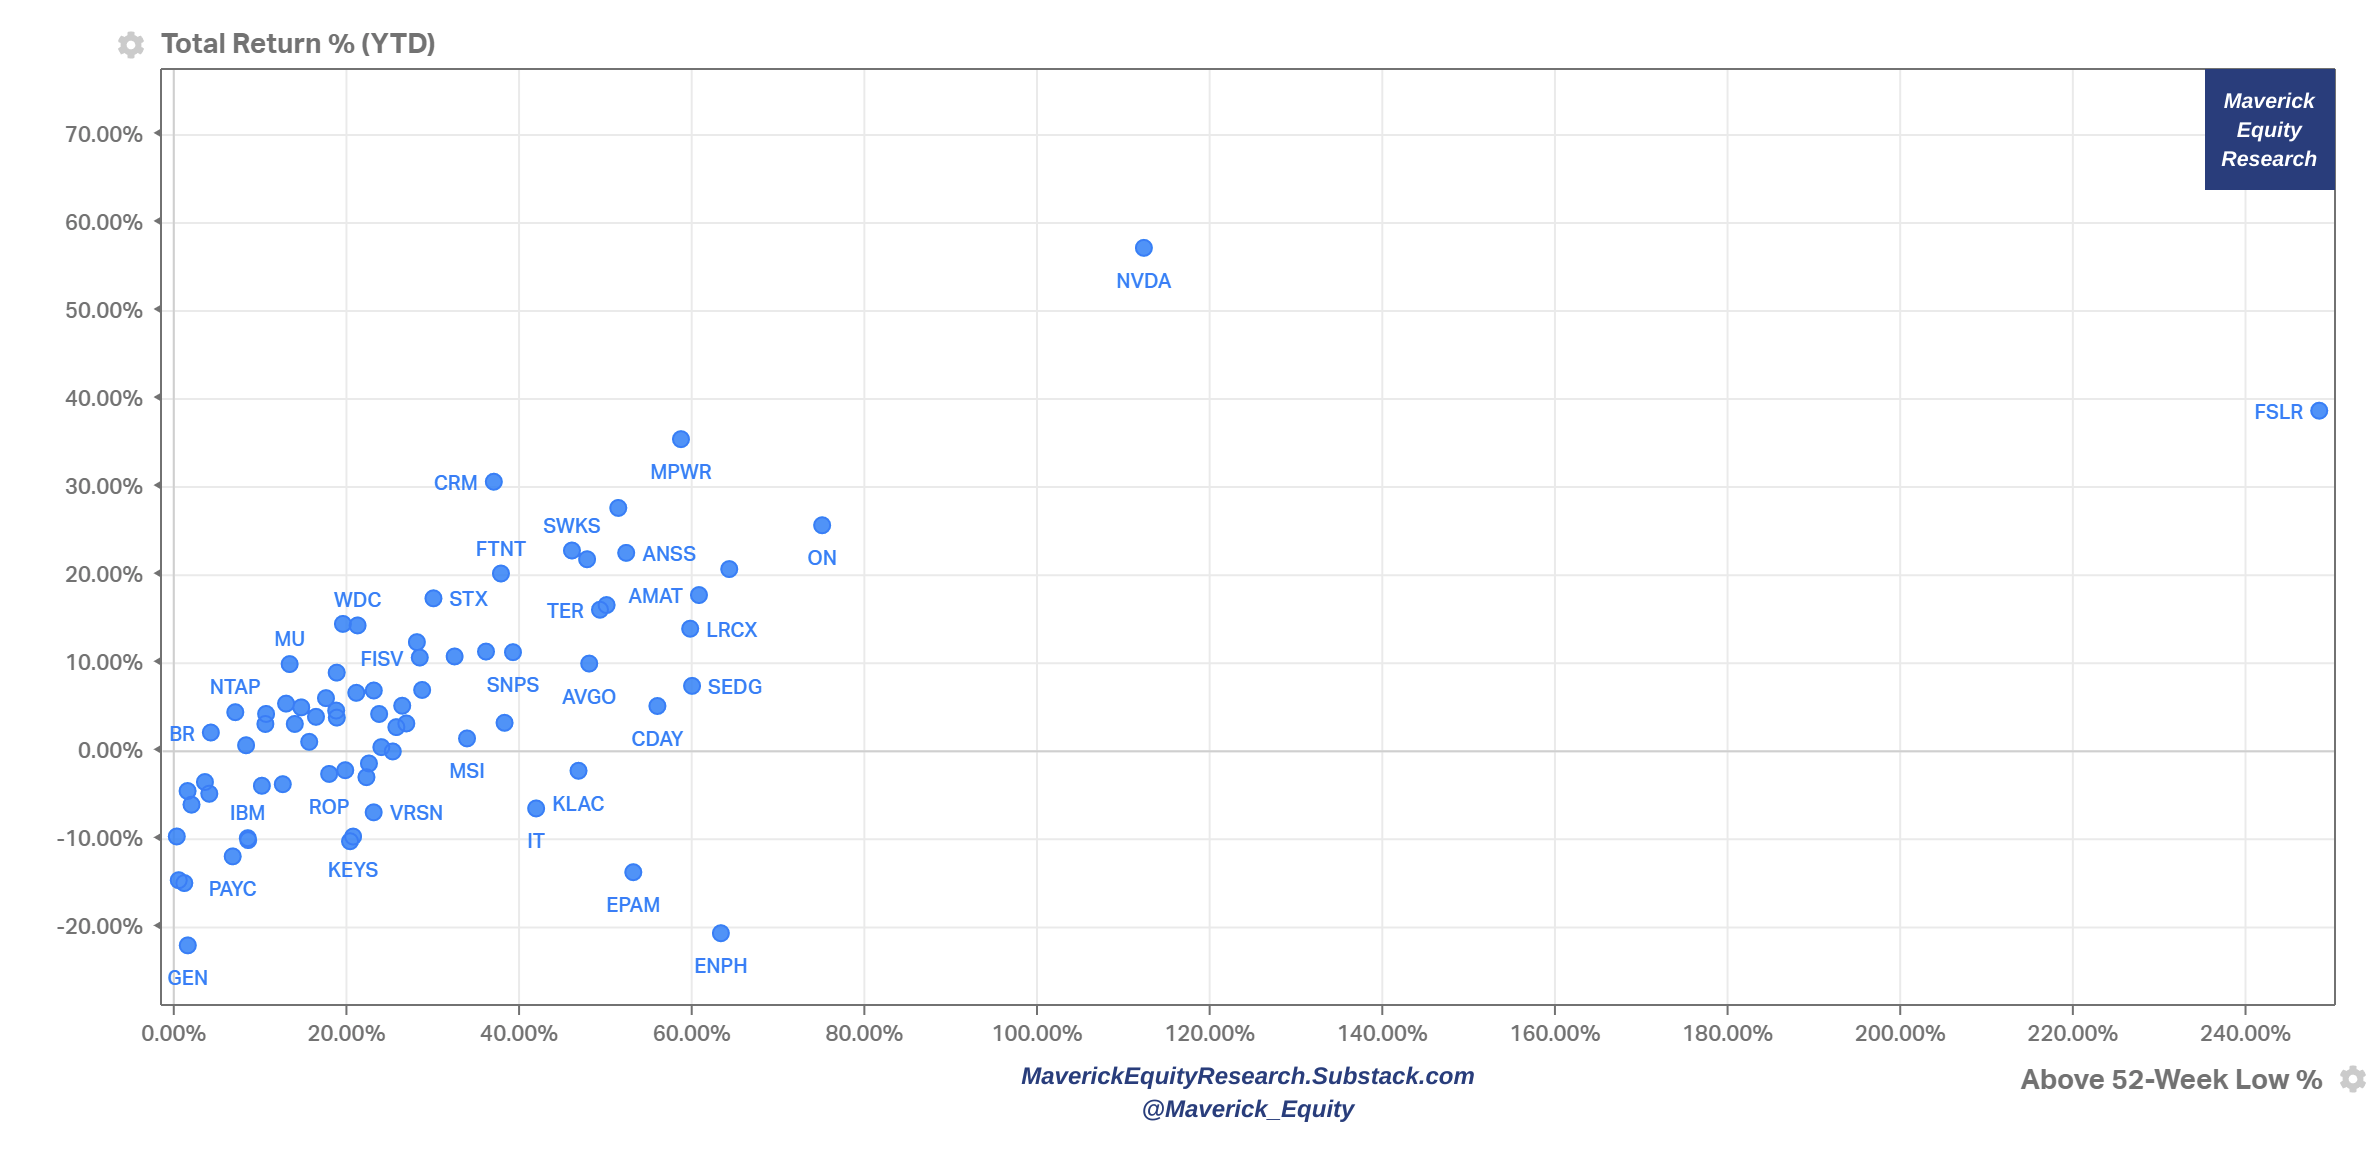
XLK - Technology
Price action: 2023 YTD Winners & Rebounders from their 52-week low
Sales/Revenue aka ‘Top-line’: P/S multiple & Revenue growth (forward)

Profitability aka ‘Bottom-line’: P/E multiple & Earnings/EPS growth (forward)

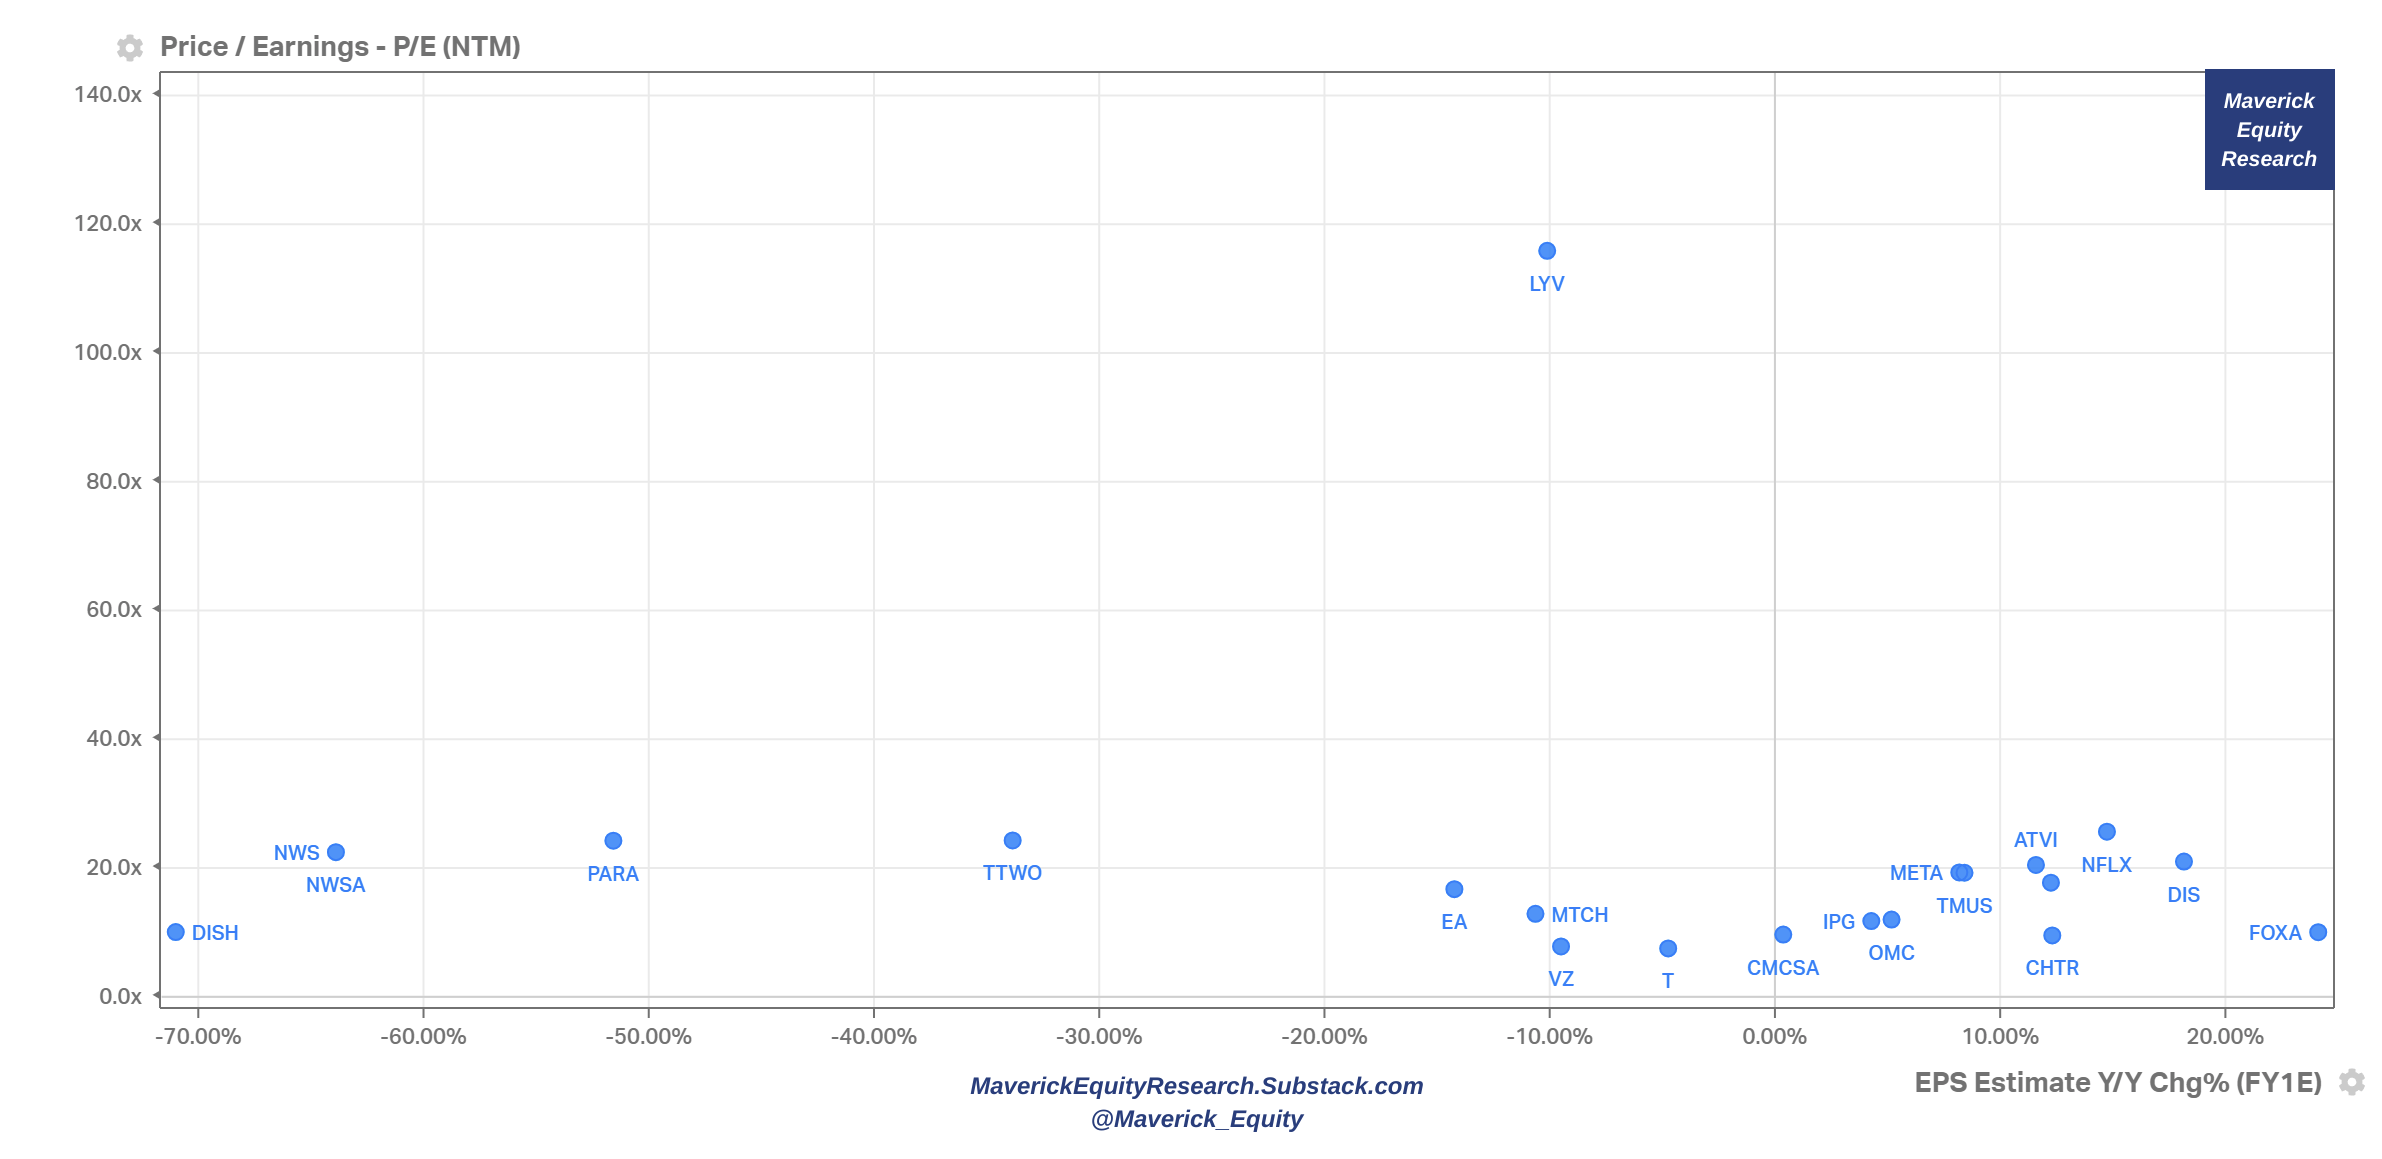
XLC - Communications
Price action: 2023 YTD Winners & Rebounders from their 52-week low

Sales/Revenue aka ‘Top-line’: P/S multiple & Revenue growth (forward)

Profitability aka ‘Bottom-line’: P/E multiple & Earnings/EPS growth (forward)
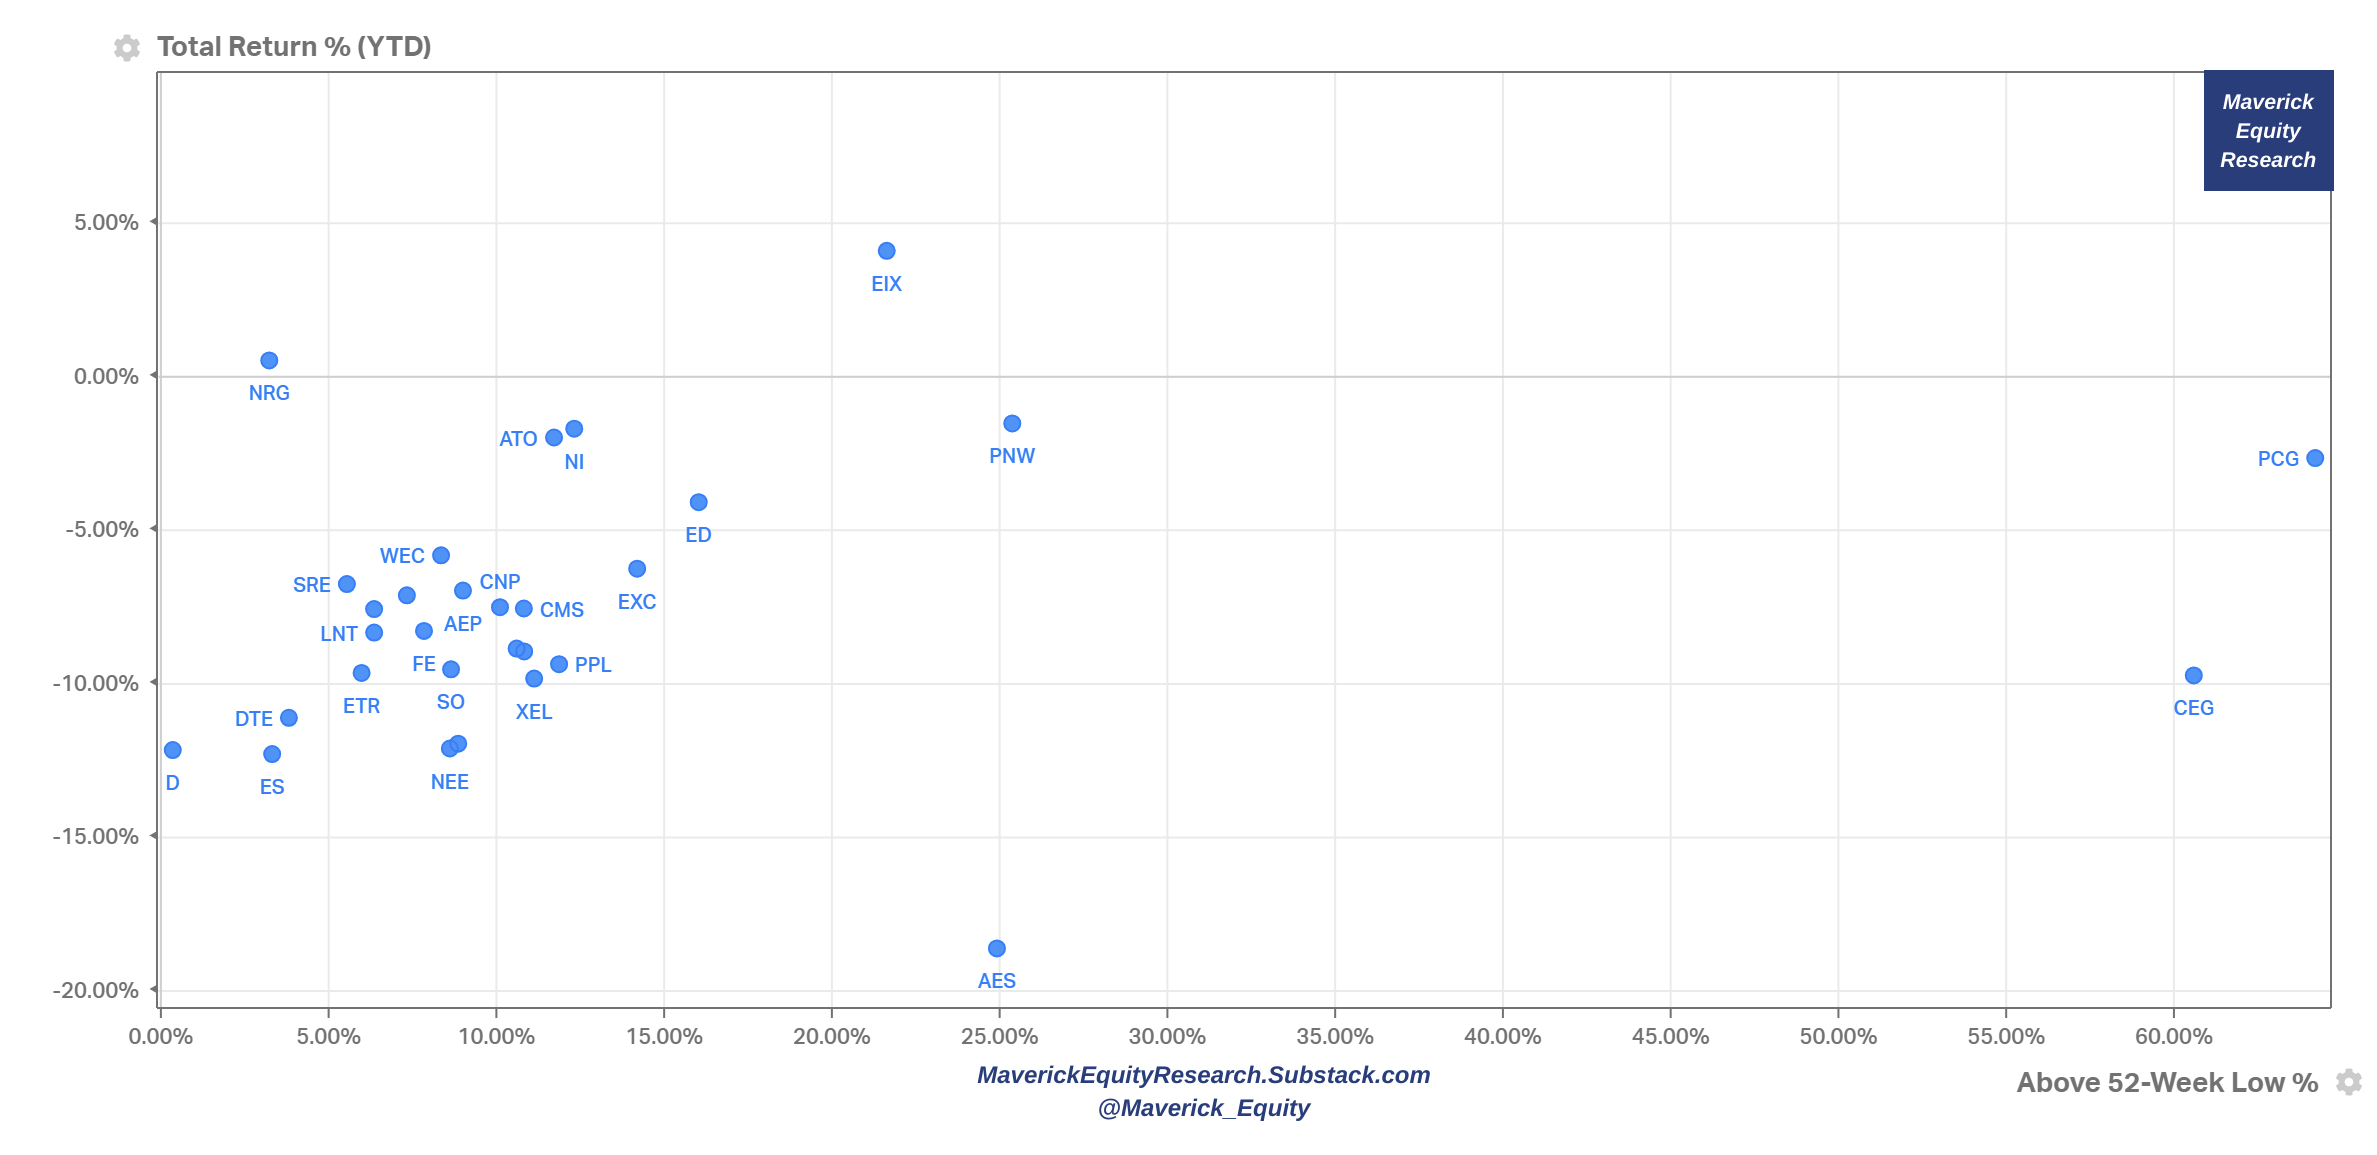
XLU - Utilities
Price action: 2023 YTD Winners & Rebounders from their 52-week low
Sales/Revenue aka ‘Top-line’: P/S multiple & Revenue growth (forward)

Profitability aka ‘Bottom-line’: P/E multiple & Earnings/EPS growth (forward)

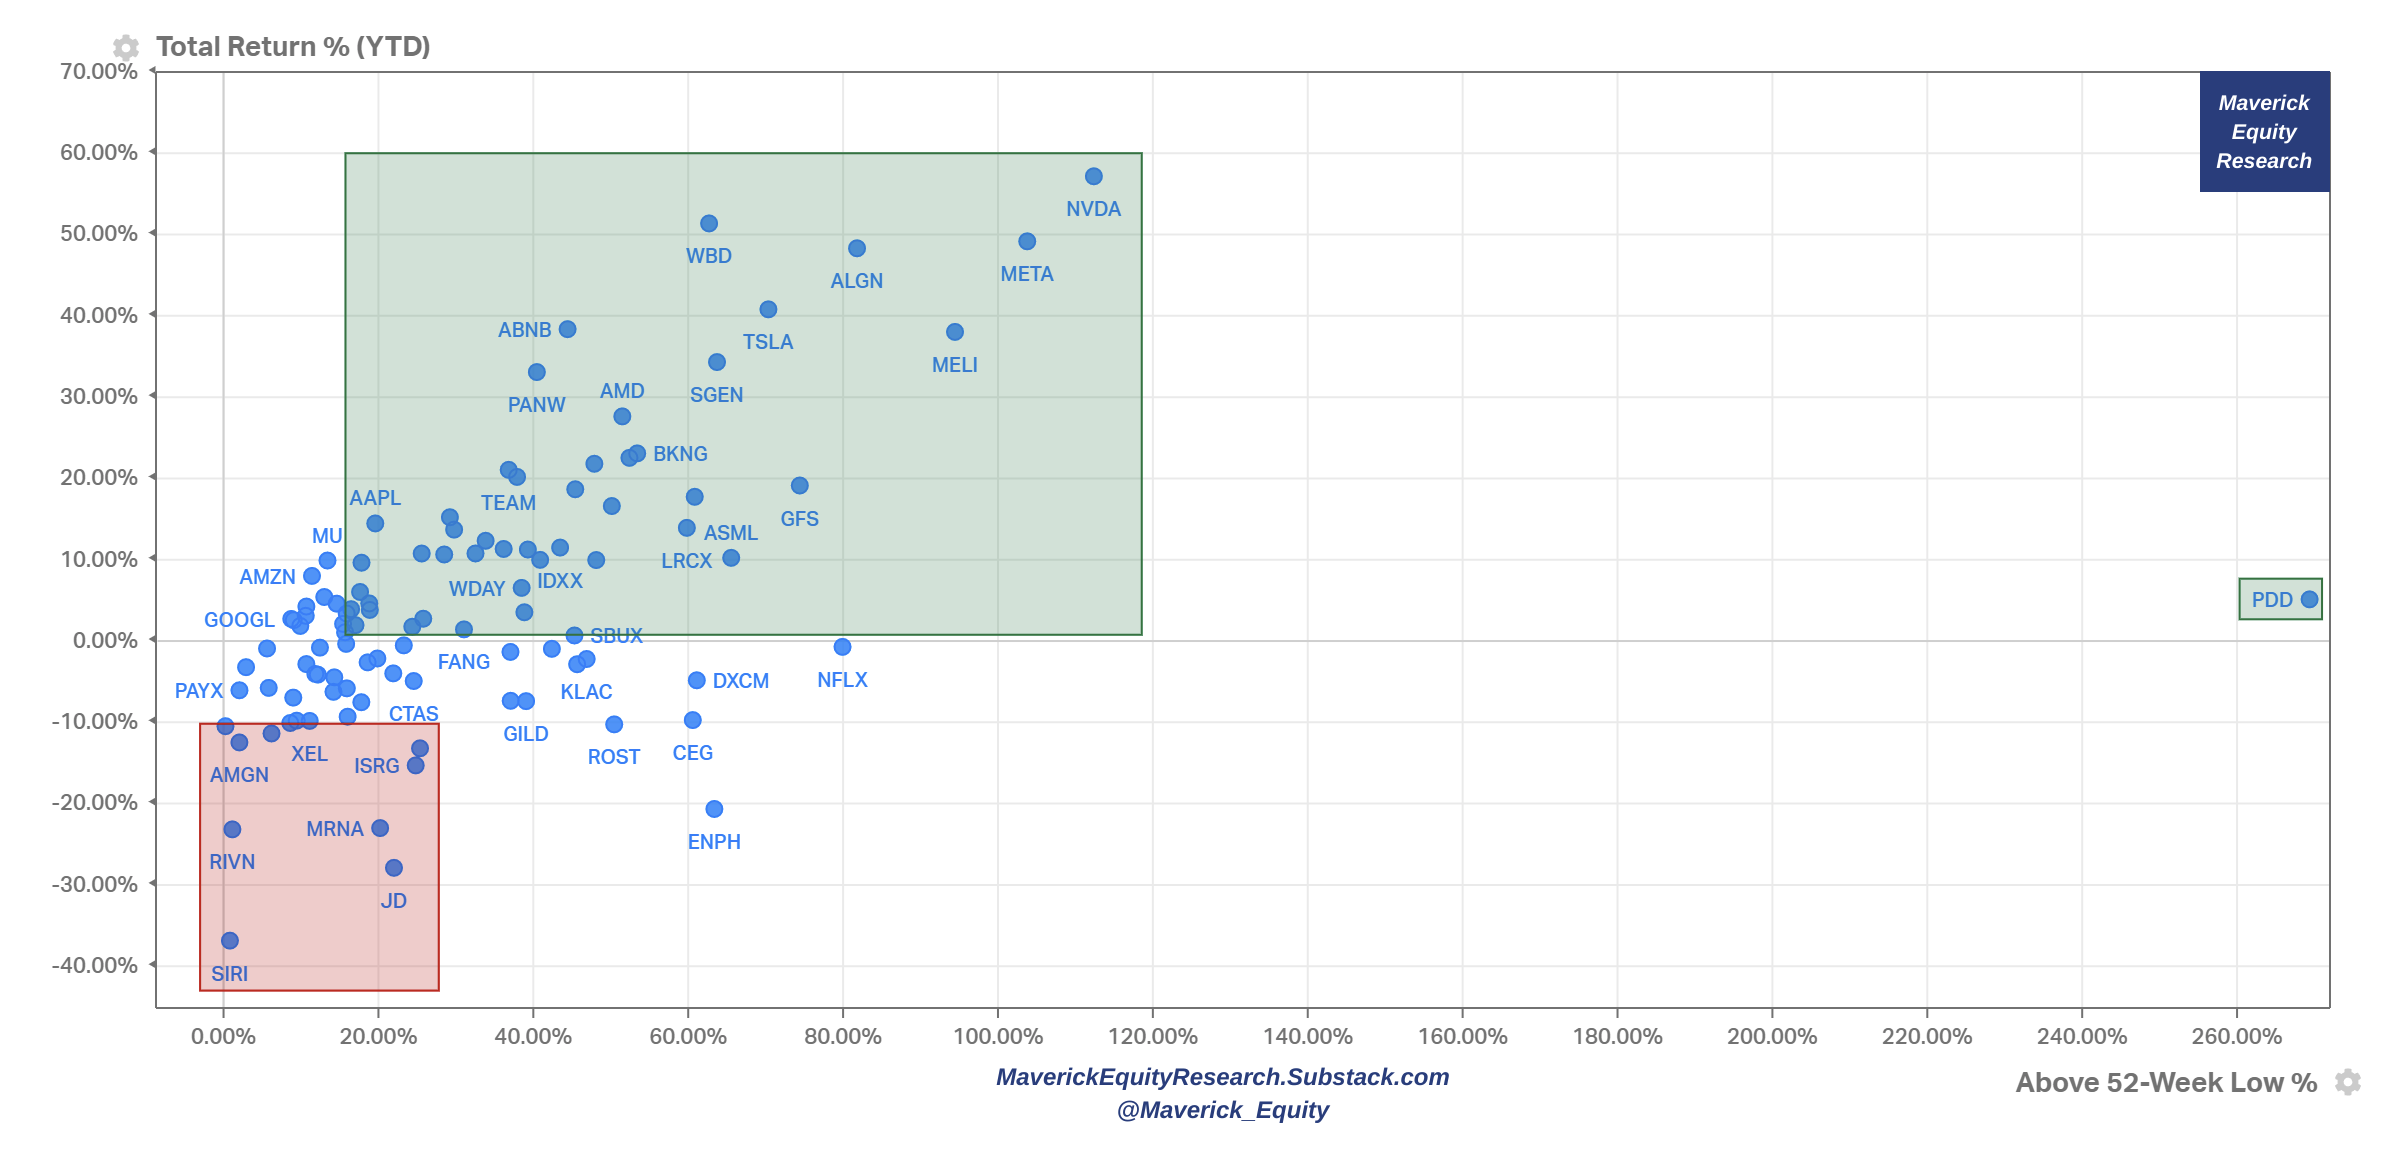
📊 Nasdaq 100 … aka ‘Tech’ 📊
And the Nasdaq 100 because Tech is Tech. Created in 1985, it tracks the performance of the 100 largest non-financial companies listed on the Nasdaq exchange by being heavily weighted towards technology & growth-oriented companies. 5 visuals total:
Price action view: 2023 YTD Winners & Rebounders from their 52-week low
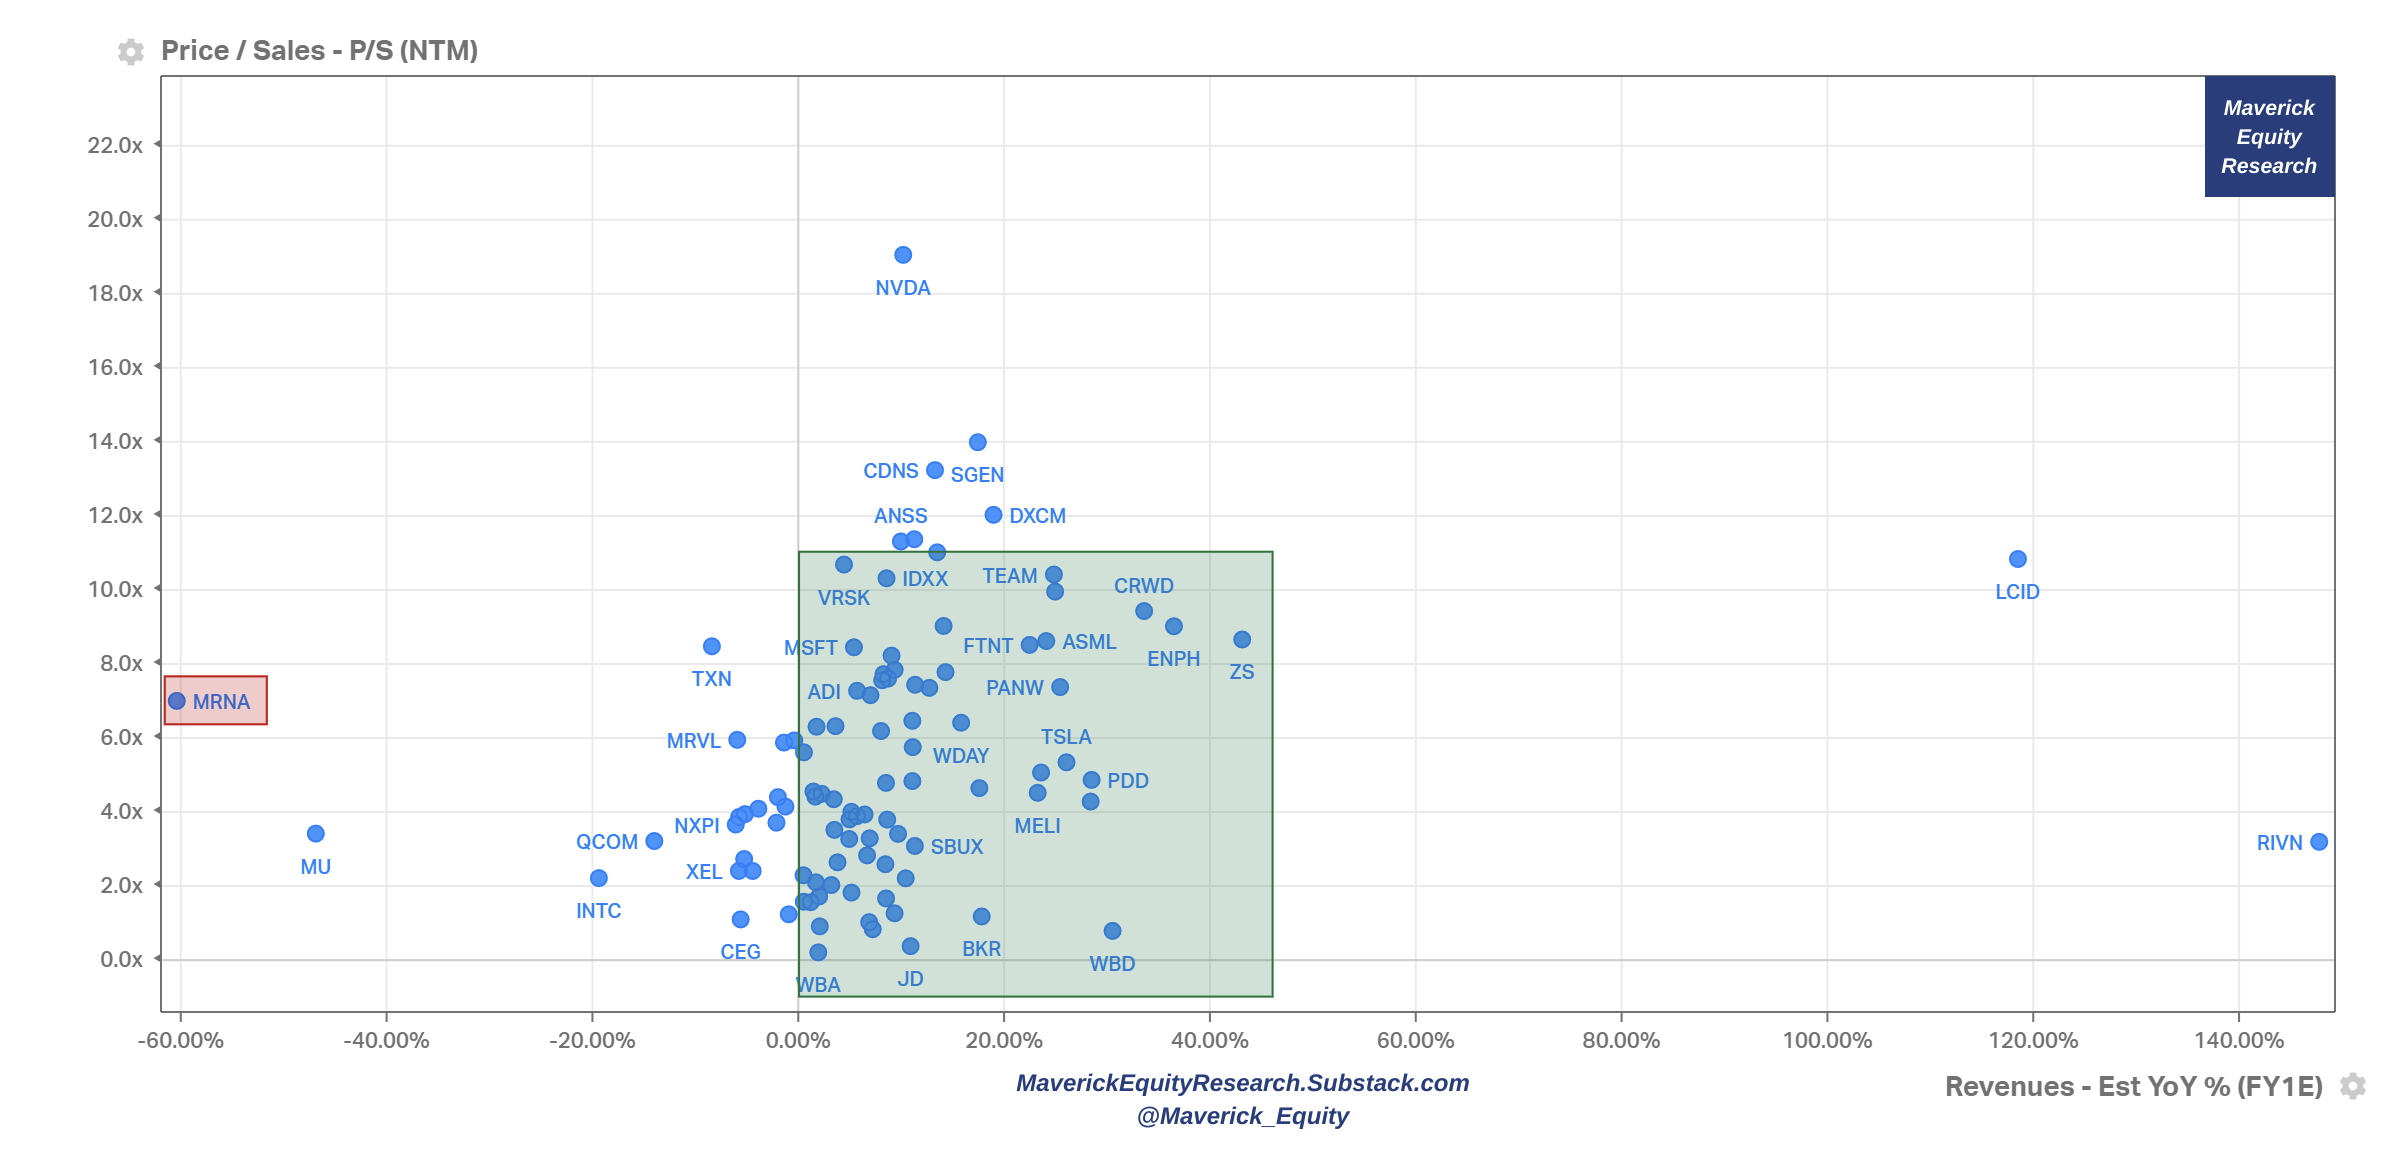
Sales/Revenue aka ‘Top-line’ view: P/S multiple & Revenue growth (next year estimates). Interpretation: Forward P/S multiple the stock is trading at for the given level of estimated Sales growth
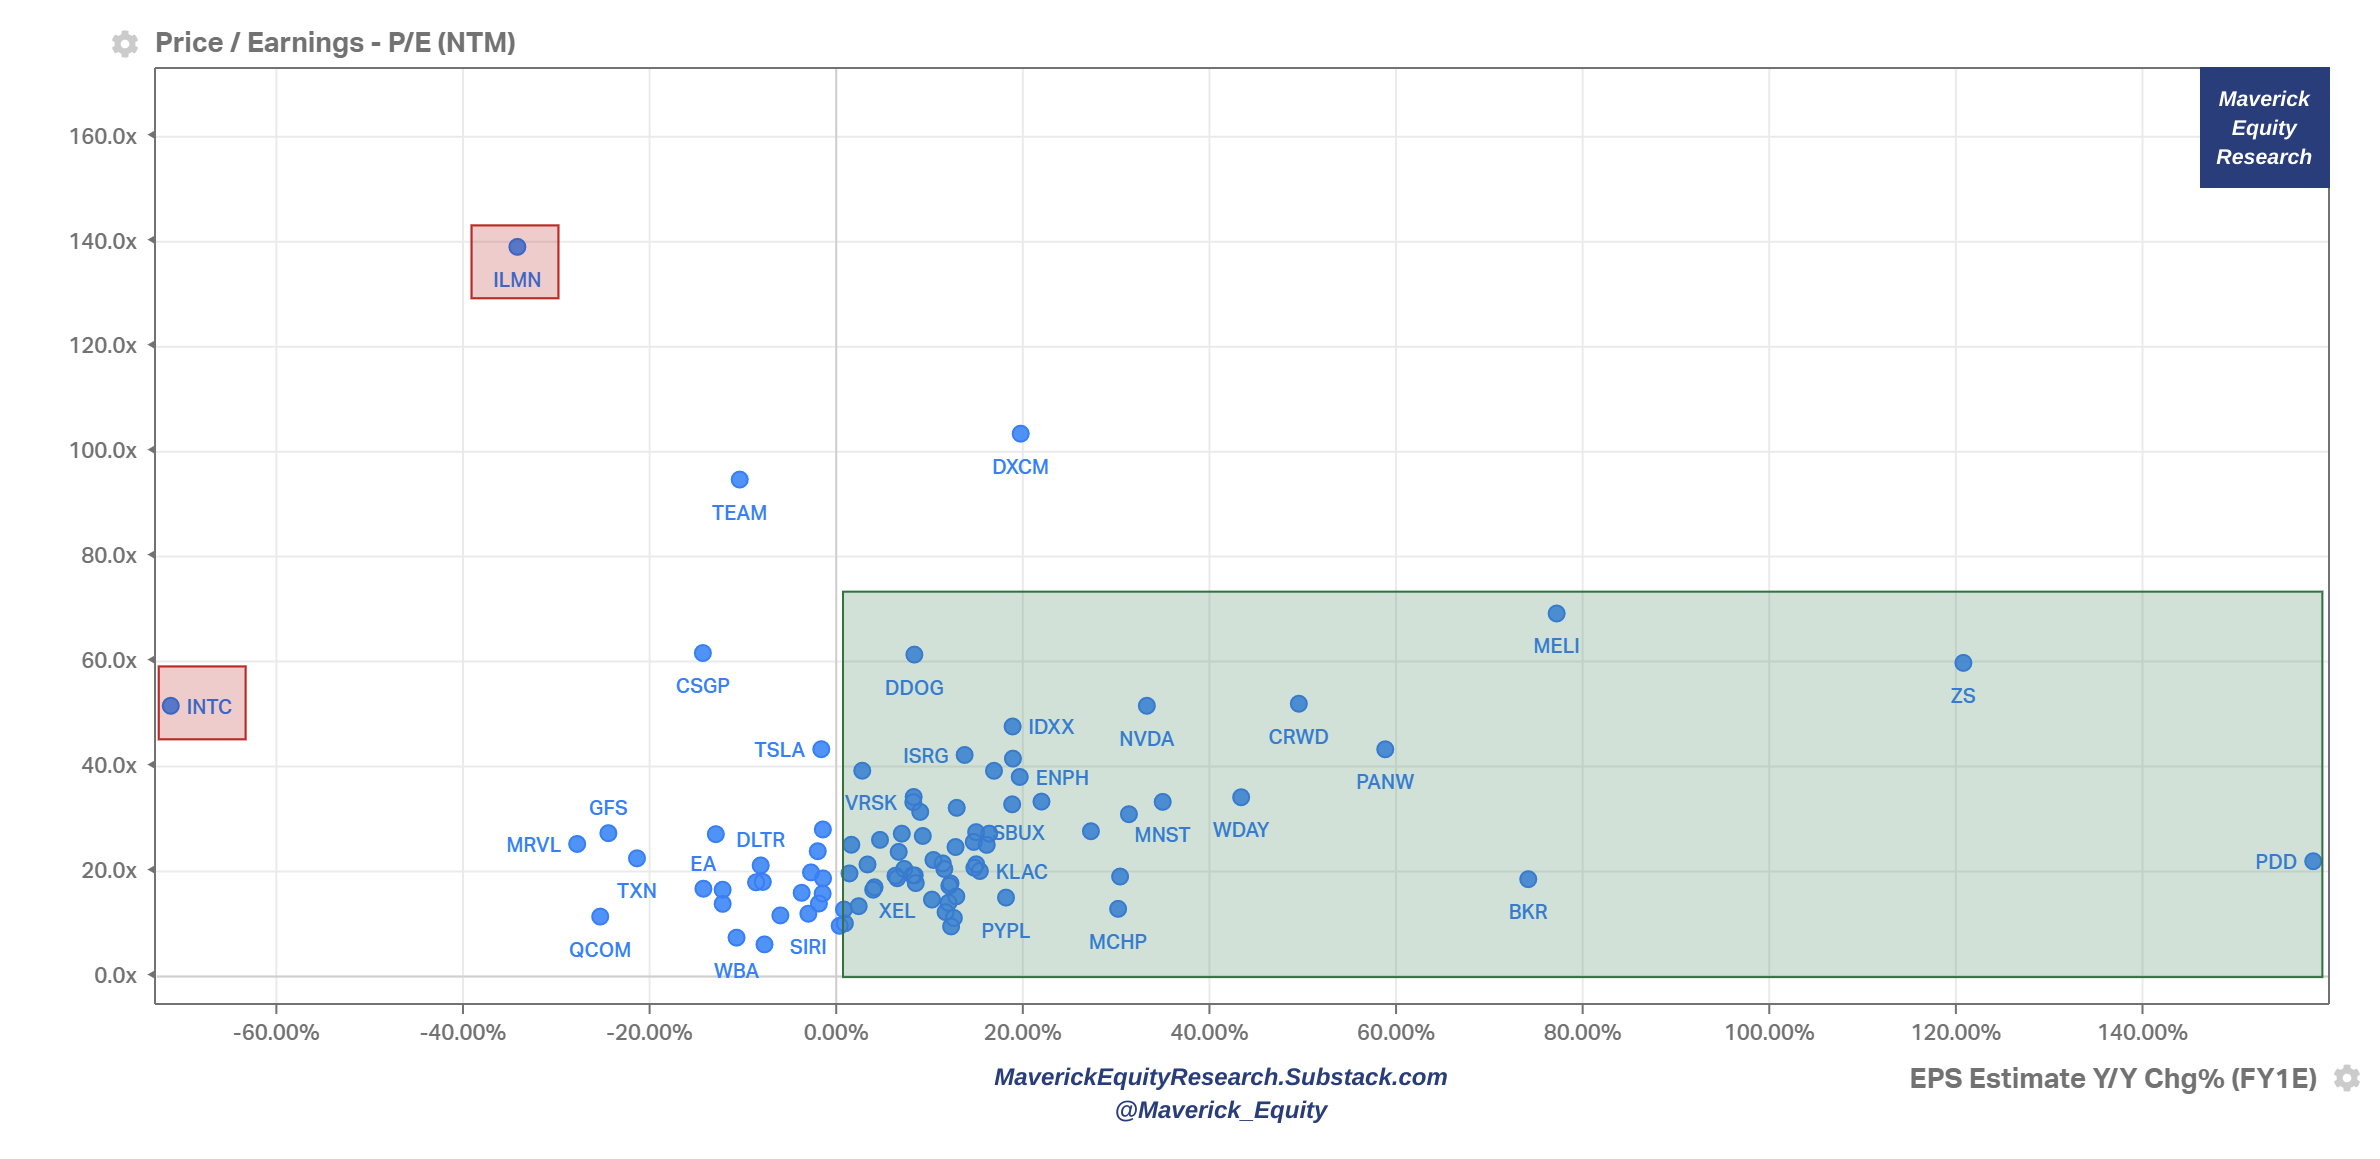
Profitability aka ‘Bottom-line’ view: P/E multiple & Earnings/EPS growth (next year estimates). Interpretation: Forward P/E multiple the stock is trading at for the given level of estimated Earnings/EPS growth
Free Cash flow aka ‘cash’ view: P/FCF multiple & FCF/Share (last twelve months). Interpretation: P/FCF multiple the stock is trading at for the given level of FCF/Share

Nasdaq 100 Sector Breakdown (Source: PlantDollar):

🏦 Bonus Charts 🏦
Have you ever wondered what is the stocks overlap between the big 3 indices? There you go! Source: PlantDollar

Have you ever wondered the contribution of profits each sector from the 11 has to the S&P 500 index overall & the evolution in time? There you go with a freshly updated chart from 1976 to Sep 2022 via GS:

Have you ever wondered who owns the US stock market by investor type? 2 main takeaways:
👉 market is structurally net long = tailwind, put that into memory as an investor …
👉 what hedge funds do and general headlines, eye-balls & click baits are not relevant in the bigger picture ...

Have you ever wondered what is the historical performance of the S&P 500 one year after the last FED rate hike? There you go with the index itself, sector & style breakdown:

I hope you enjoyed this extensive research & it would be great to hear your feedback! Should you have found this endeavour interesting and valuable, just subscribe & share it around with likely interested people. Twitter post can be found here. Thank you!
Have a great day!
Maverick Equity Research
Original report indeed! Great visuals!
To be honest at first I said this is just another cheesy description regarding the unique original nature of this report ... but indeed I did not see this coverage around nor from banks or overall. so 'sorry' for my kneejerk reaction ;))
Biggest use case for me I see already are diving deeper into single names and especially for peers & intra-sector analysis ... outliers also ... cool, thx!
Thank you, original indeed! Appreciate the work and time ... that must have taken some hours if not a day or two ... great way to capture US markets and from there dive deeper ... Respect! All the best!