✍️ Stock Screening for Value in Europe - Edition #1
Energy crisis, war ... priced in by now & value to be found?
Dear all,
welcome to the 1st Stock Screening research piece, a dedicated section from Maverick Equity Research that aims for value in the current tricky European landscape.
Report is not behind a paywall & there are no pesky ads here. It would be highly appreciated if you just spread the word around to people that might also be interested.
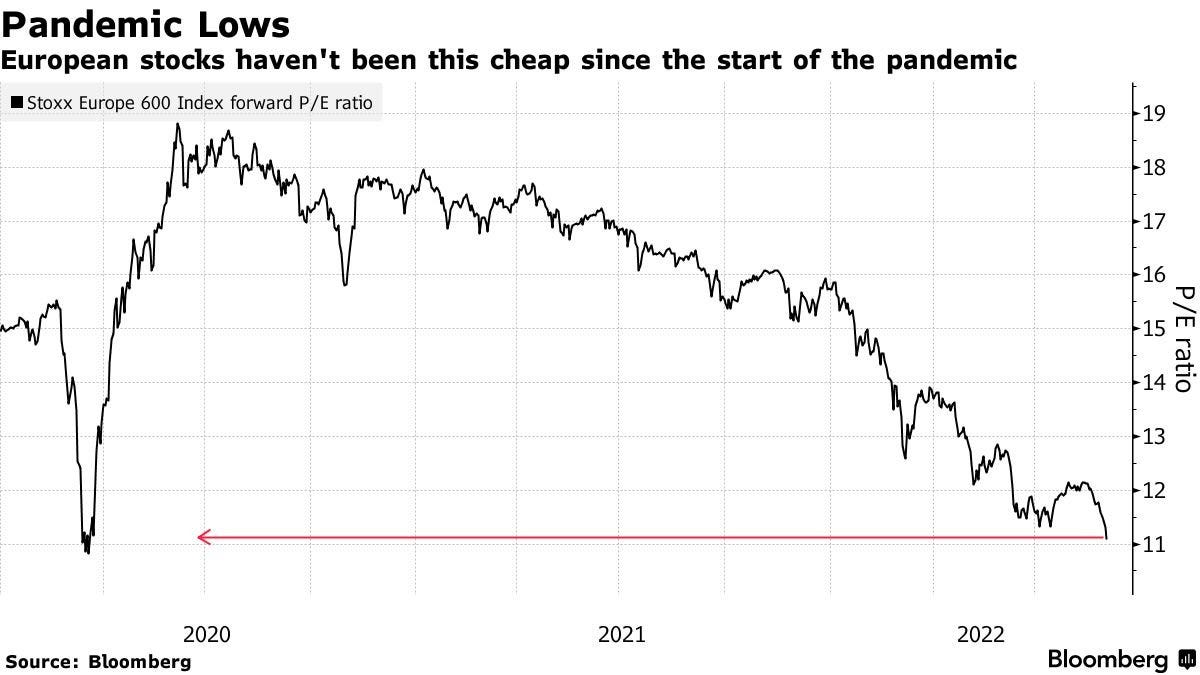
The energy crisis and the war is hitting hard Europe and stock prices naturally reflect the developments clearly with the recent tumble: the Stoxxx Europe 600 index forward P/E ratio is at the same 11x level as in the March 2020 Covid crash when indiscriminate selling was happening across the board.
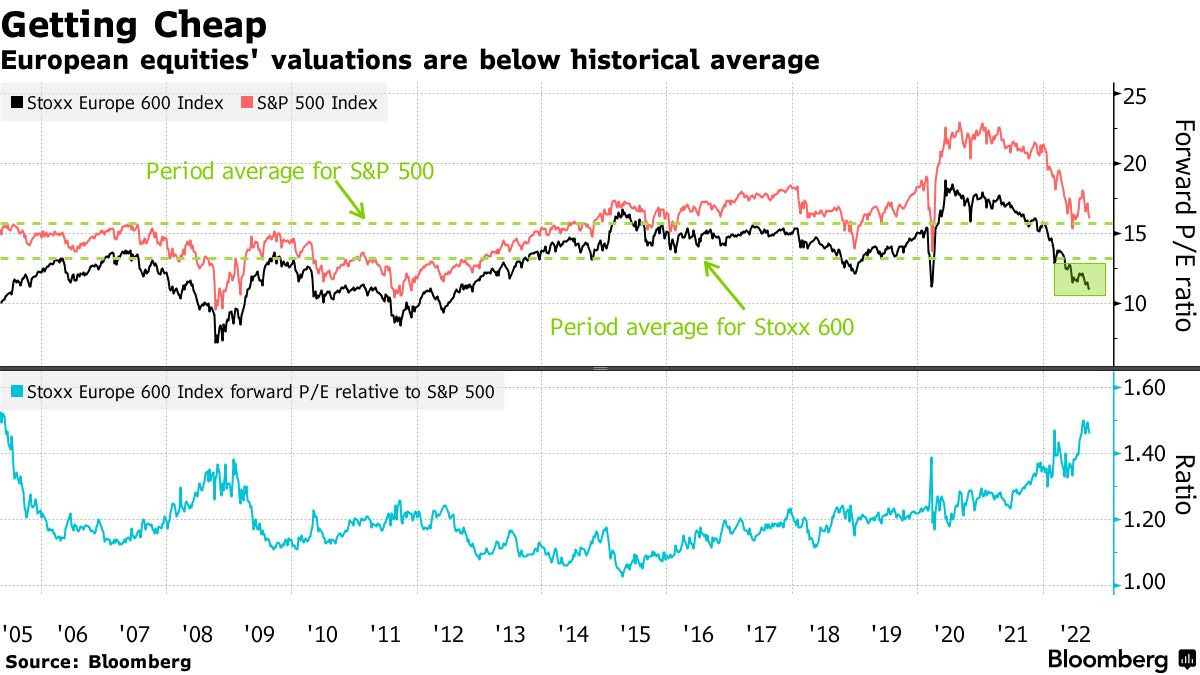
Complementary chart also shows that European equities’ valuations are below their historical average on a forward P/E ratio:
After the P/E multiple, it is worth having a look also at the Price/Book multiple and in this case at Germany's DAX index with a 22 years overview: 2001 Dot-com, 2008 GFC/Lehman, 2009-2012 European Sovereign Debt Crisis ‘PIIGS’, Covid 2020 Crash & historically the book value is acting as a floor.
On a similar note, the S&P Europe SmallCap index currently has a Price/Book ratio below 1.2 for the fourth time in the last 20 years. After the first 3 times when it happened historically (2002/2008/2020), it returned more than 50% just 12 months later.
Going forward, the US Dollar index is not helping at all European businesses by going higher and higher as the US Federal Reserve tightens monetary policy to combat the ramping inflation. Source: Confounded Interest
Going further, we see how the valuations are coming down via material outflows from European equity ETFs: one big outflow once Russia invaded Ukraine while the most recent data (2nd highest) shows an even bigger outflow. Source: FT via BlackRock
The question is now, are we really worse than then? When this kind of selling as a basket happens, potential opportunities arise and in these cases they might not even be that hidden.
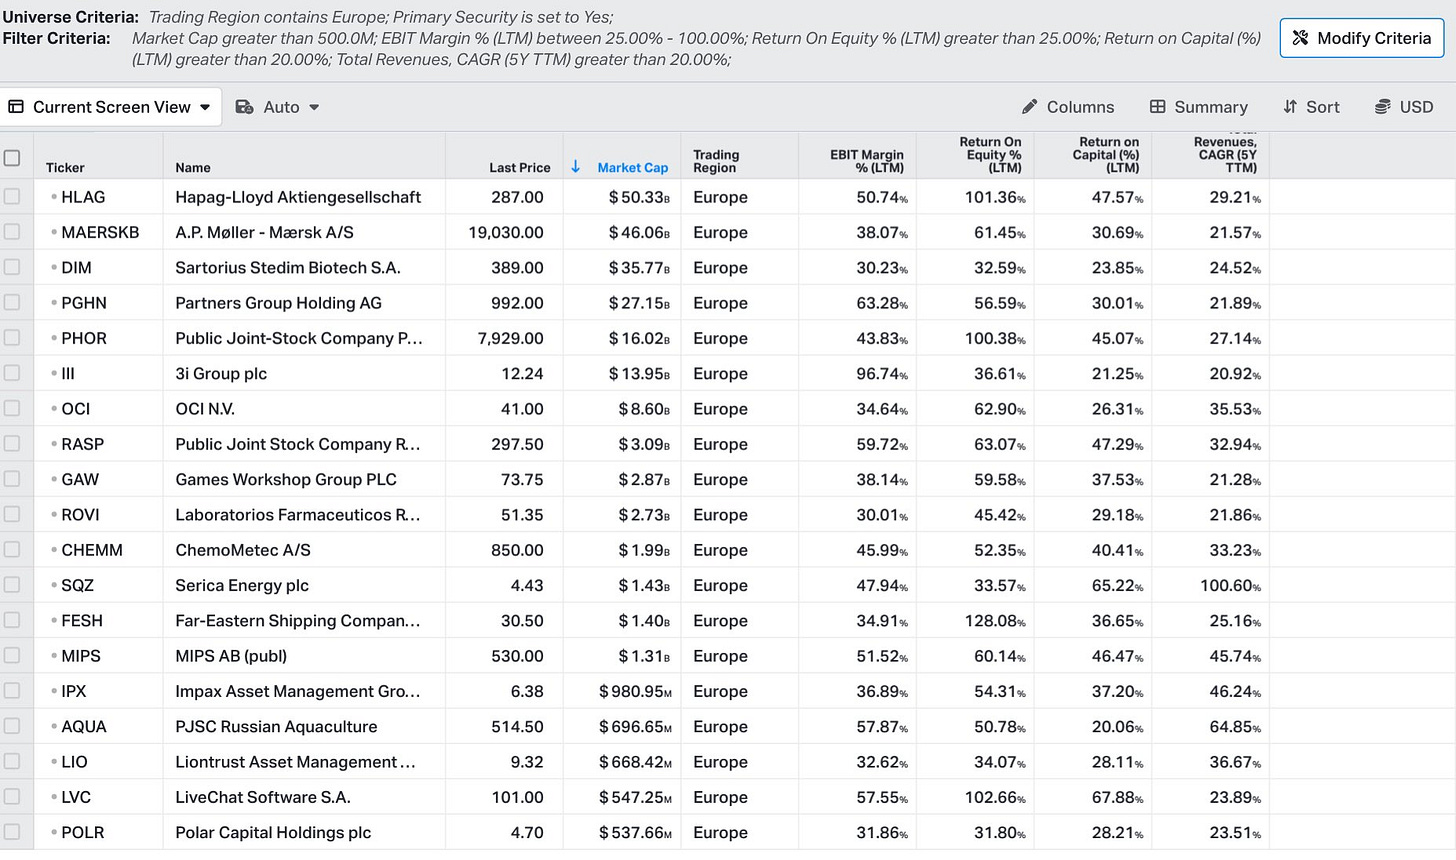
Getting more granular next, @IrnestKaplan (top #FinTwit contributor in terms of both diligence & experience) ran a screener in Europe with the following metrics:
Market capitalization > 500M
EBIT margin (LTM) > 25%
ROE (LTM) > 25%
ROIC (LTM) > 20%
5 year Revenue CAGR (LTM) > 20%
Results: 19 companies that are sorted in the following table by market capitalization:
Going forward, I did relax a bit the criteria, namely I went for a larger investment universe by market capitalization > 250M, lowered the EBIT margin to > 20% and ROE > 20%:
Market capitalization > 200M
EBIT margin (LTM) > 20%
ROE (LTM) > 20%
ROIC (LTM) > 20%
5 year Revenue CAGR (LTM) > 20%
Results: 25 companies that are sorted in the following table by market capitalization:
Now that we have the screened companies via the chosen fundamental metrics, an interesting view would be how did this group of companies fare since the beginning of 2022 when we had no war in Europe and the energy crisis did not seem to turn that ugly.
The following scatterplot shows us the Price change % Year-To-Date 'with' the Above 52-week Low % (which can serve in general as part of a use case to identify market leaders & laggards, positive/negative momentum, relative strength and/or likely unwarranted cheap stocks).
Despite the environment since the begging of the year, the 3 companies in the green quadrant did perform very well while material drawdowns have been registered by the companies in the red quadrant. Question is, are the latter warranted or as often markets overcook it on the downside via sentiment and/or flight to safety ?
From here, a logical step would be to get a bit into valuation territory. For that, the following scatterplot shows the EV/Sales multiple (next twelve months) ‘with’ the 1 year ahead Revenue estimates for YoY% growth:
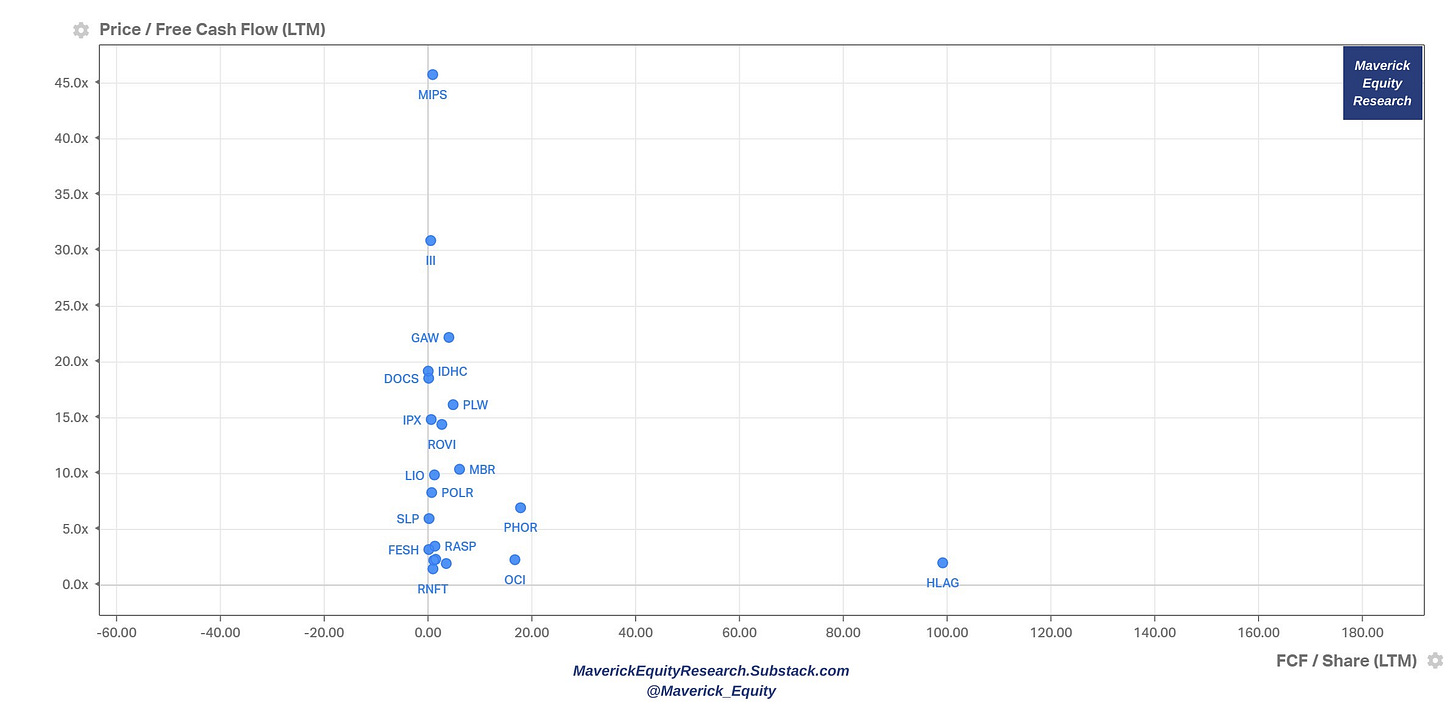
Sales/Revenues is just the top-line dimension, hence let’s also see a Free Cash Flow (Price/FCF & FCF/Share) view which can provide additional insights:
Next step would be one digging even deeper into these names, their related industries and see for a fit for their investor profile and specific portfolio construction.
All in all, how much worse can the energy crisis in Europe get? How long the war will last and what are the implications down the road ? Consequently, a key question is do current valuations price in that the worst has yet to come or that it is behind us ? One thing is for sure: realistically nobody can say that exactly. All one can do from here is further research for an informed rationale.
In terms of that, lately we have good signs from both the energy and the war side:
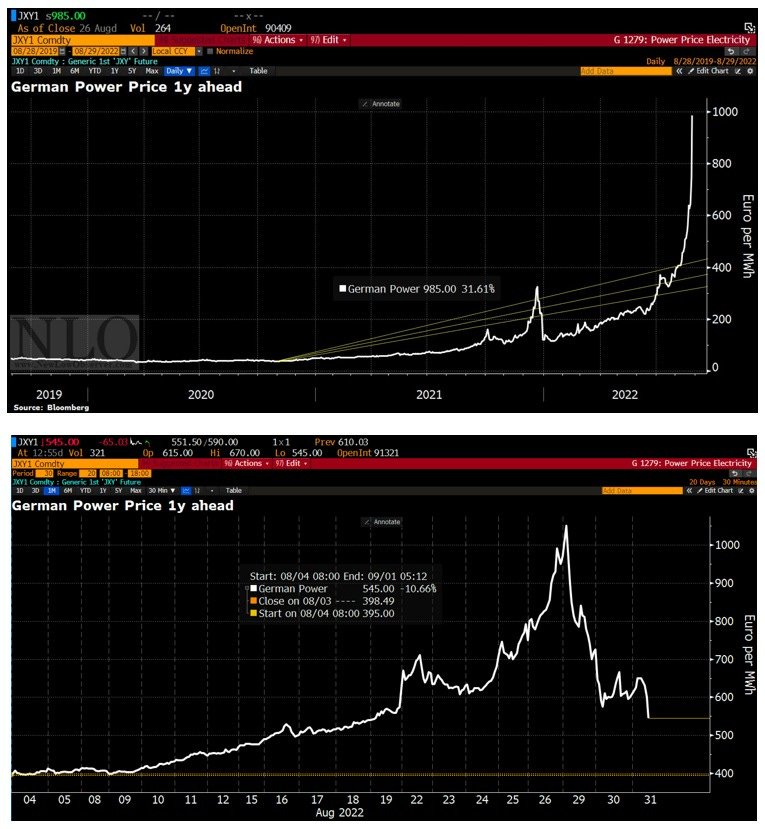
Via Bloomberg, German power price 1-year ahead (forward price) is back more to earth: almost halved within 2 days from €985 per MWh to €545. Food for thought: are these price swings just a question of the current tricky situation with the ‘supply’ side ?
As the EU works on a plan to temper the unprecedented energy crisis, power & gas prices are tempering to a 1 month low, though still sit around 8x hither than the old ‘normal’.
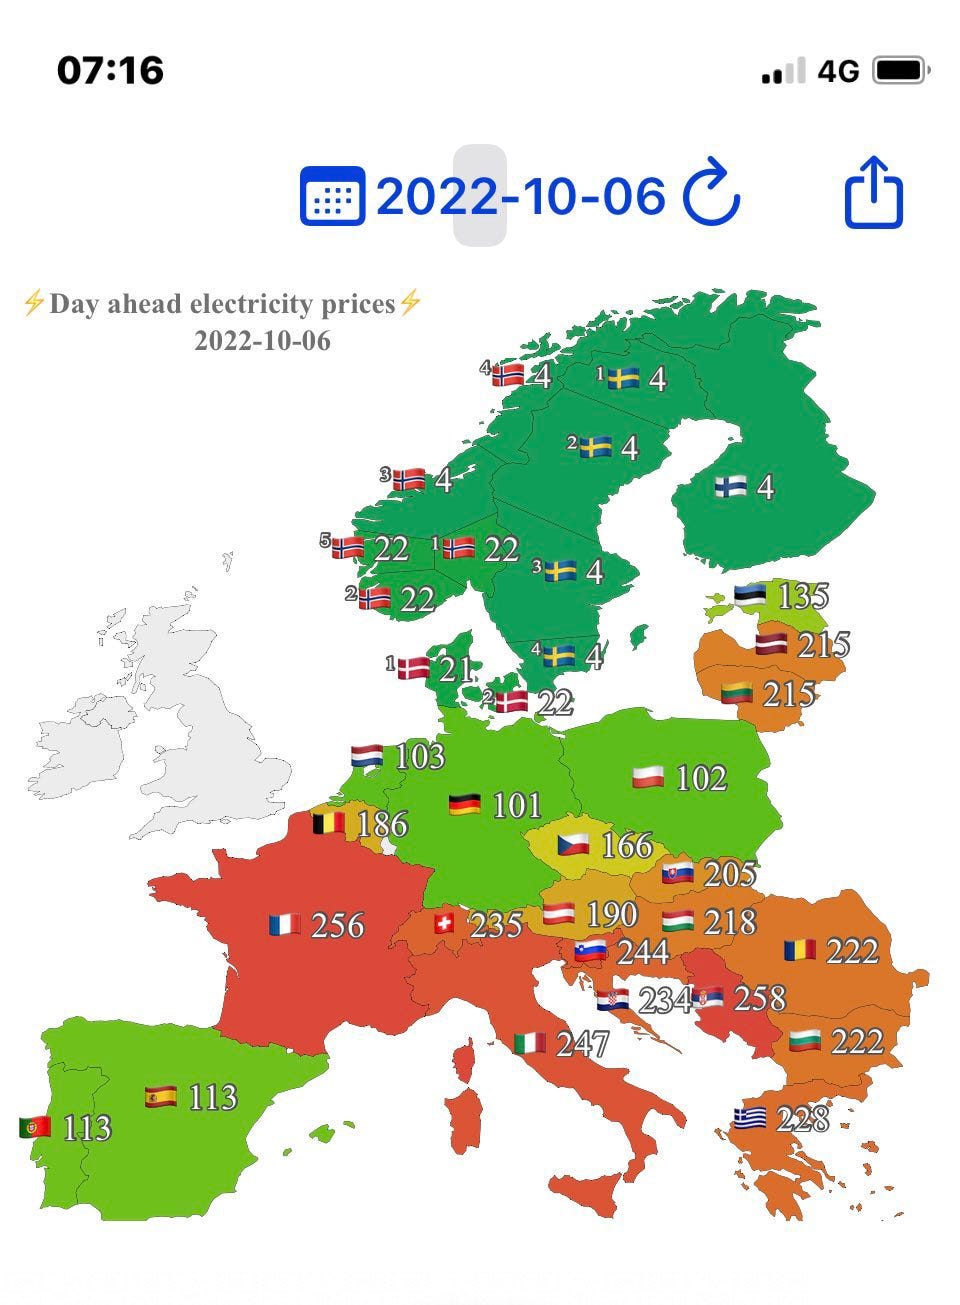
Complementary, if you want to keep track with the day ahead electricity prices in Europe the following map updated daily from EUenergy is a great source & visual:
For a deeper dive, I encourage you to read Andreas Steno Larsen’s latest takes ‘What on earth is going on in European electricity markets?’ & A (semi)-permanent energy GDP-shock in Europe? which strong arguments that currently the electricity markets are completely out of sync with fundamentals & the likely impact to the GDP.
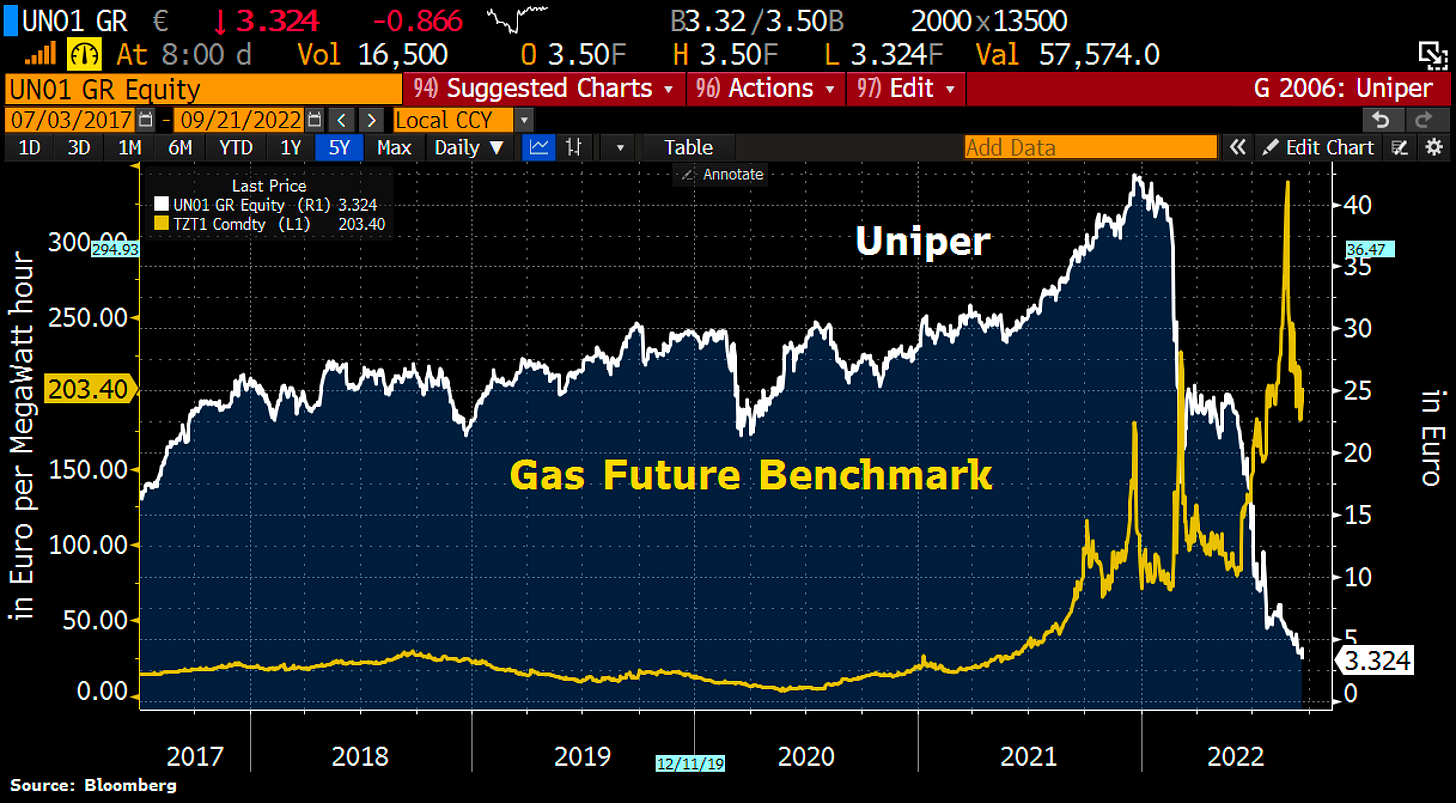
Now when this kind of major disruptions happen, 1st & 2nd order effects are always coming up. The latest from Germany is Uniper, the country’s largest gas importer which is being nationalized given the cash reserve burn that has been going after Russia cut off supplies overall to Europe following Western sanctions. Uniper is basically working as an intermediary between Russian suppliers and German consumers, hence quite a key player in the supply ecosystem. Being forced to buy gas elsewhere at higher and higher prices on the expensive spot market, time was running out and the German government stepped in and become the majority shareholder after the stock dropped 92% from the all time highs that were reached just before the war started.
regarding the latest from Ukraine, Putin decided to mobilize army reserves to support the invasion right after Ukraine ran a successful counteroffensive and managed to force Russian forces from more than 20 towns and villages. Reports indicate that it has tripled retaken area with over 3,000 sq km (1,158 sq miles).
Efforts are being done on many fronts and we have signs of the situation heading towards a stabilization. On the short term, unknows still hang heavily, drawdowns are part of investing, while on the medium-long term markets and economies will sort things out as they did in the past.
All in all, Europe is currently in deep trouble & out of favor from the investors’ side, though will this in the future mean we could have found deep value here these days?
STOXX Europe 600 total return & drawdowns since 2005:
I hope you found this European stocks screener exercise, overall approach & rationale interesting and valuable with more to come down the road. If that is the case, please just share it around with people that might also be interested to read this kind of content in the future. Thank you!
Looking forward for your questions and feedback!
Have a great day!
Maverick Equity Research








Great start, hope to read more in the future!
great coverage in a 'top-down' fashion from more general to more granular ... great job! Thank you!