✍️ The S&P 500 Report: Performance, Profitability, Valuation & Key Metrics - Ed #2
Breaking down the S&P 500 & the 11 Sectors via Sleek Charts - Edition #2
Dear all,
welcome to the 2nd edition of the S&P 500 Report, a unique & comprehensive report via data driven research & visually appealing charts that simply tell a 1,000 words.
Report is not behind a paywall & there are no pesky ads here. It would be highly appreciated if you just spread the word around to people that might also be interested.
Structured in 6 parts + bonus charts & designed to have a natural flow:
📊 Performance Ins & Outs + Flows
📊 Earnings, Profitability, Multiples, Value & Growth
📊 The 11 Sectors Performance Breakdown
📊 Technical Analysis: Short Term & Long Term
📊 Sentiment & Liquidity
📊 Special & Alternative Metrics
👍 Bonus Charts 👍
📊 Performance Ins & Outs + Flows
2023 performance: a great 15.78%% with a dividend yield of 1.41%
Key question: is the 15.78% return concentrated in a few names or more distributed?
1st chart shows us the 2023 % returns & the holdings weightings while the 2nd table is a return attribution analysis which tells us exactly that 10.25% (1025 b.p basis points) are due to just 7 stocks, the M7 (Magnificent Seven) tech stocks: Apple, Microsoft, Nvidia, Amazon, Tesla, Meta/Facebook & Google/Alphabet. Let that sink in!
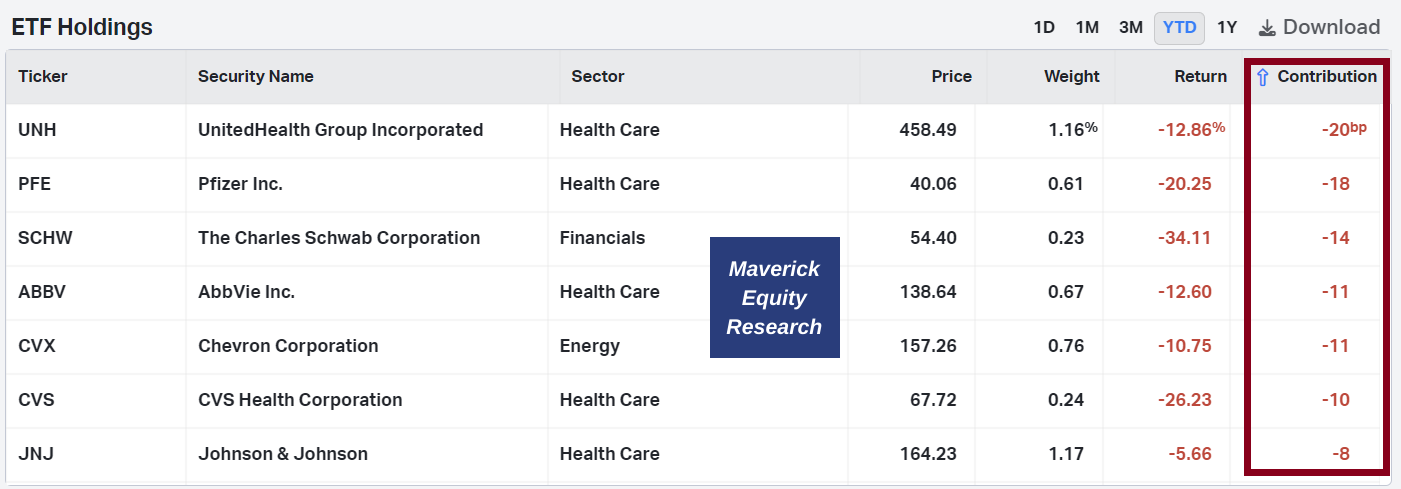
The laggard are the following top 7 stocks: their weight is small in the index, but note the individual returns which are materially negative in 2023
To continues smoothly here, the S&P 500 with the stocks above their 52-week lows & below their 52-week highs: tech, AI, semiconductors and consumer discretionary are leading and hot, while energy, cruises & travel cooled off in the last year
The S&P 500 difference in returns, weighted (SPY) VS equal weighted (RSP)! The weighted SPY with a big outperformance via the M7 tech stocks as per above!
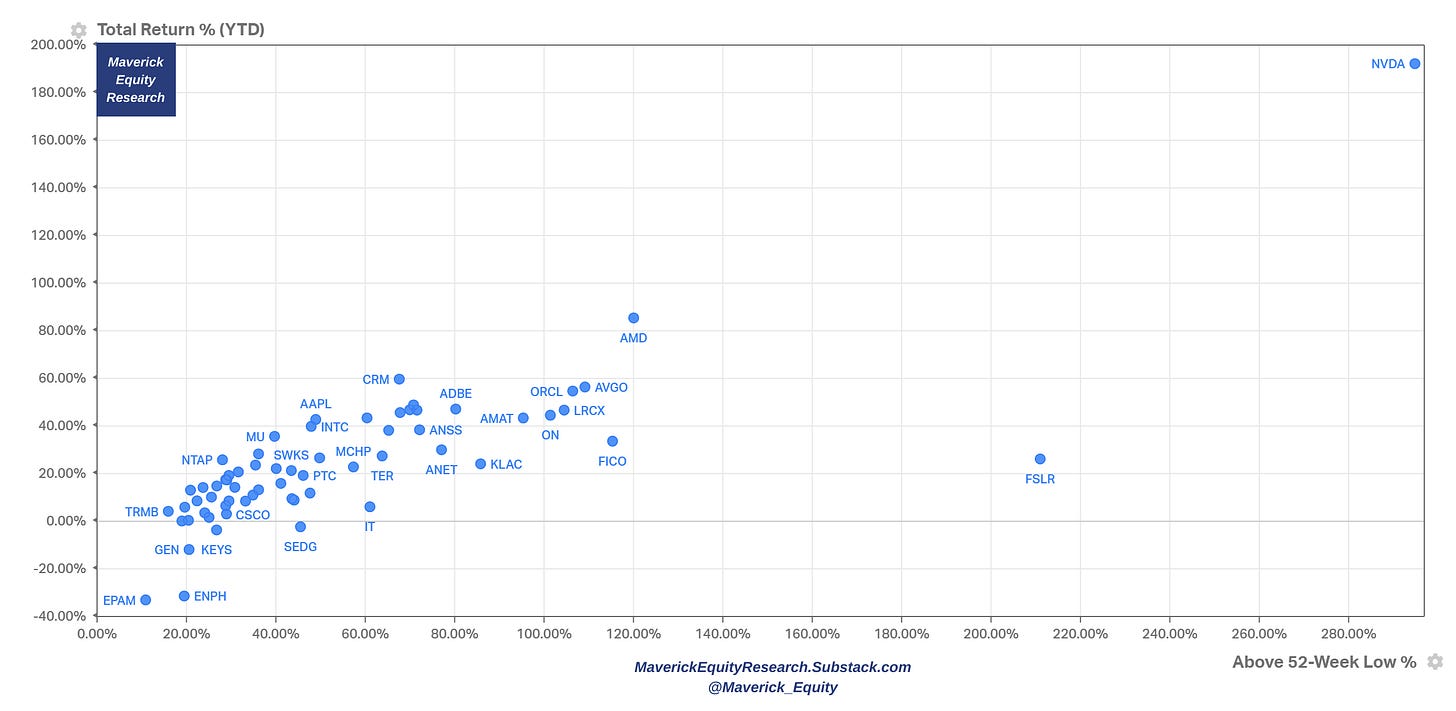
Now let’s ignore weighting and switch to the S&P 500 unweighted components via the following 2D interesting dimension: 2023 % returns & Above 52-Week Low %: Nvidia the mega outlier after the recent AI driven parabolic run … let that sink in!
Complementary view with the main individual names from the S&P 500 11 Sectors:
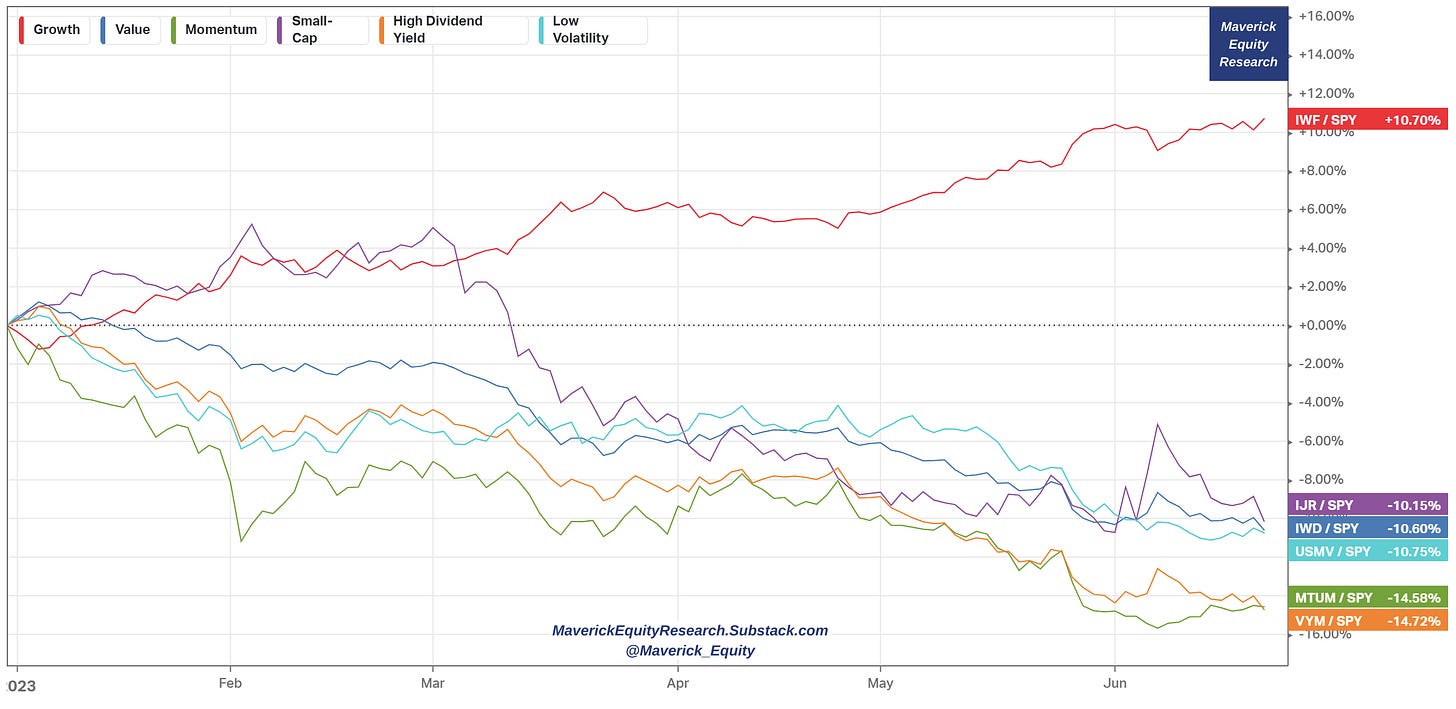
From a factor/style investing angle, growth (IWF) is winning in 2023
Fun & cool fact on stocks via the S&P 500 (green) and the US FED interest rates (red):
FED embarked last year in the fastest interest rates hiking cycle in 4 decades, yet stocks are + 6.64% since then
we went from 0% to 5%+ interest rates, stocks had a max 17% correction in 2022
Main take-away: stocks as a (natural) hedge to interest rates! Not the first time!…
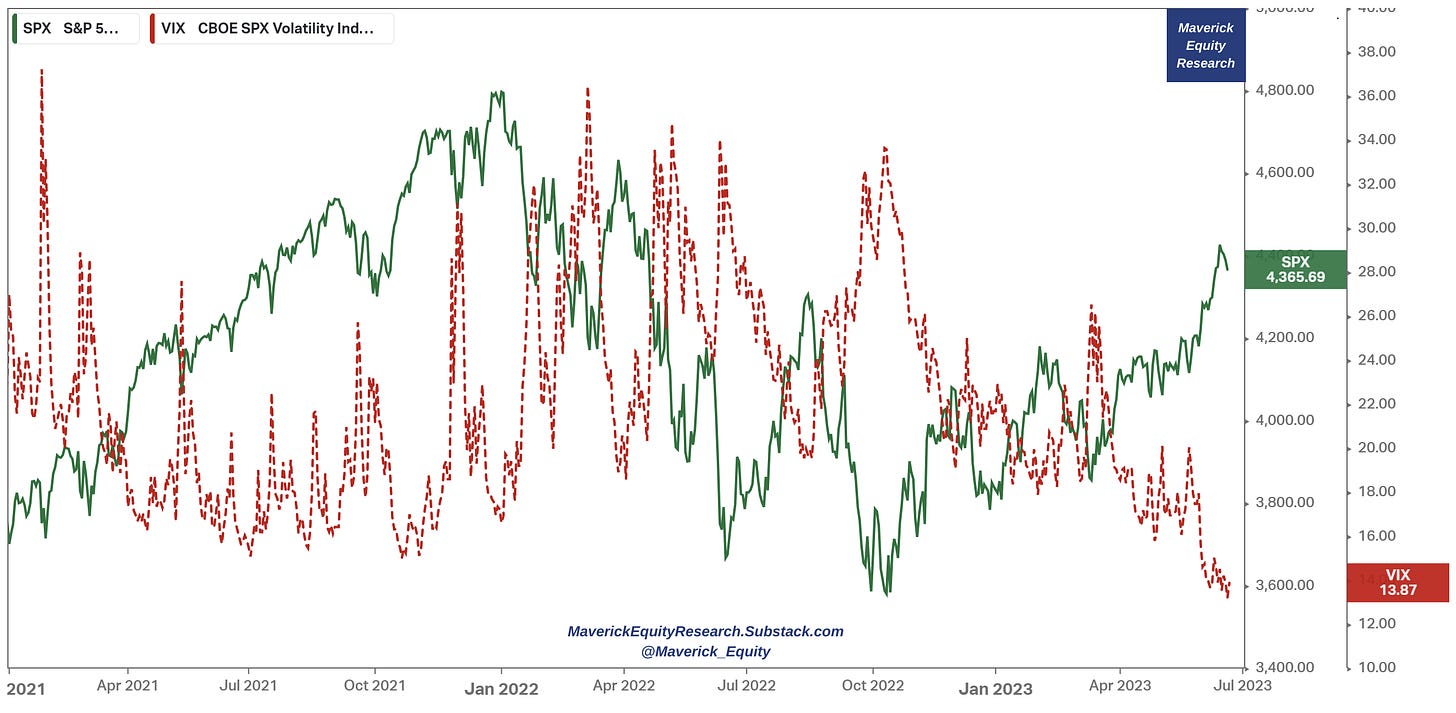
Note also S&P 500 index (green) and Volatility via the VIX index (red):
stock market resilience caused the VIX (major indicator of market uncertainty) to fall to its lowest level in more than 3 years (since January 2020) & well below its 19.6 average since 1990
it’s not just the US stocks riding the rally and low volatility, but market momentum is felt also also by the French & German ones that hit record highs in 2023 are while Japanese ones reached a 33-year pean in June
S&P 500 financial flows in May via the SPY ETF:
$14 billion into SPY ETF = big, even vs outlier months (usually tax loss harvesting)
Hence I guess we did NOT sell in May and went away ;)) …
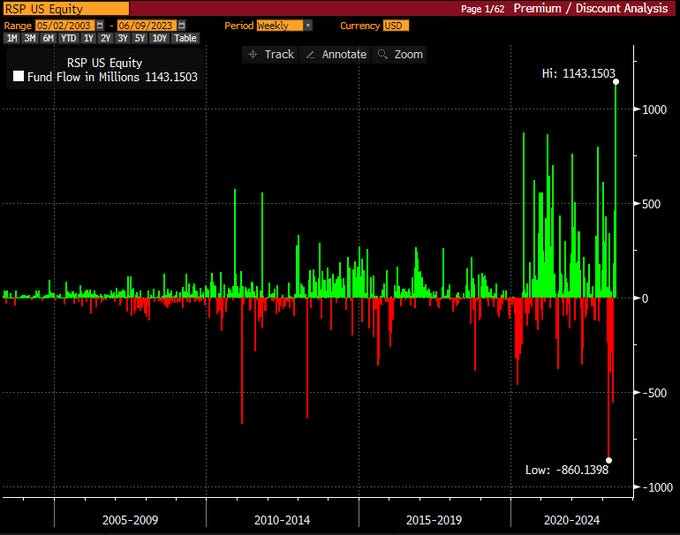
Similar for the S&P 500 equal weight RSP ETF: record weekly flow!
📊 Earnings, Profitability, Multiples, Value & Growth
2023 Q1 actual earnings growth came out at 0.1% which is above the many recent gloomy headlines and ‘hot takes’ we have seen since the recent US banking issues + the Credit Suisse correspondent in Europe …
S&P 500 price & EPS 12-month estimates: back to earth & more aligned after the FED (and fiscal policy) induced parabolic run once the Covid outbreak. When stock prices go way above earnings/EPS consider getting cautious ... fundamentals matter always sooner or later. In the end it is all about earnings I heard on the street …
Switching now to the S&P 500 EPS Actuals & Estimates: 221 for 2023 & 247 for 2023. No earnings recession on the horizon … .
Going forward to the forward P/E ratio: S&P 500 Forward 12-month P/E = 18.5x
18.5x is below the 5-year average of 18.6x, but above the 10-year average of 17.3x
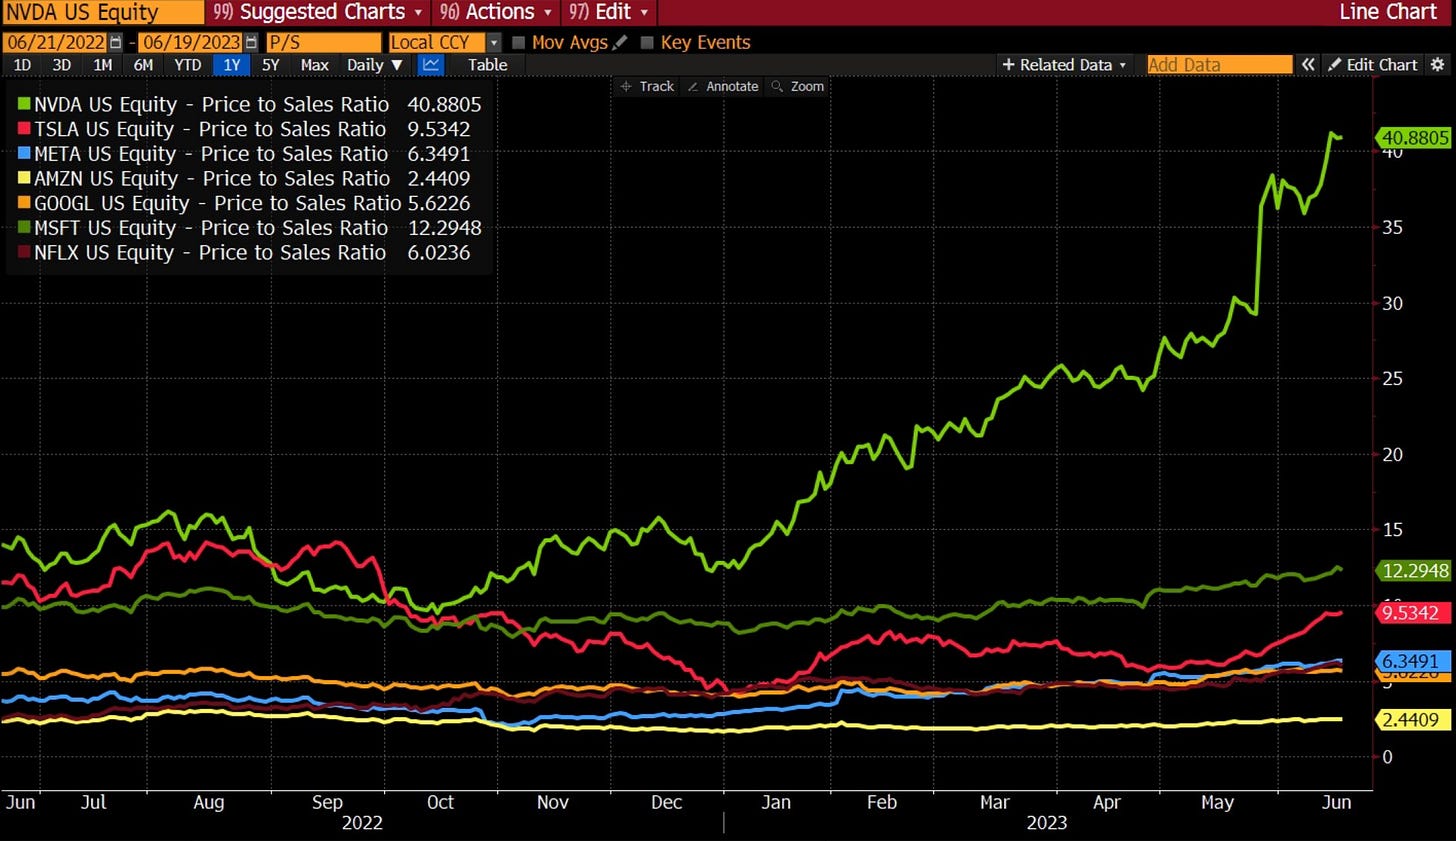
Remember the M7 tech stocks driving the S&P 500 in 2023? They are also leading the valuation metrics: forward P/S is above 30! S&P 493 is around 16.5x.
Zooming further into the M7 tech stocks, we see how also inside the just 7 there is a big outlier, and that is the might Nvidia …
Now Value & Growth in 2022 & the 3-year period via VTV & VUG (ETFs): in 2023 VUG growth (blue) with a big +31.58% rally while VTV value (green) with just +2%.
With a 3-year timeframe, we see how value VTV Value (green) did match VTG Growth (VUG) for a good part of 2022, now Growth is back with a big AI driven run!
Is there a way to see the Rotation from Growth to Value and since when did it start? Sir, yes sir: for that we go for a 10-year timeframe and relative to the S&P 500: one can say that growth outperformance started around 2017, then had a parabolic run once FED deployed the bazooka in 2020. Lately cooling off once inflation and high interest rates showed up, but recently AI makes for another big run.
A way to look at Value & Growth investing is also via the SCHG/SCHV proxies, that is U.S. Large-Cap Growth / U.S. Large-Cap Value: recall 2017 when growth started the 1st major run while after meeting the resistance in 2023, it did restart the big run.
Aside from classifications/style, recall Munger: ‘all investment is value investment in the sense that you're always trying to get better prospects that you're paying for.’ Good businesses will always be there both from the ‘Value’ & ‘Growth’ camps.
📊 The 11 Sectors Performance Breakdown
The 2023 performance of the 11 Sectors that shape the S&P 500: XLK (Tech) XLC (Communications) & XLY (Consumer Discretionary) the big 3 leaders.
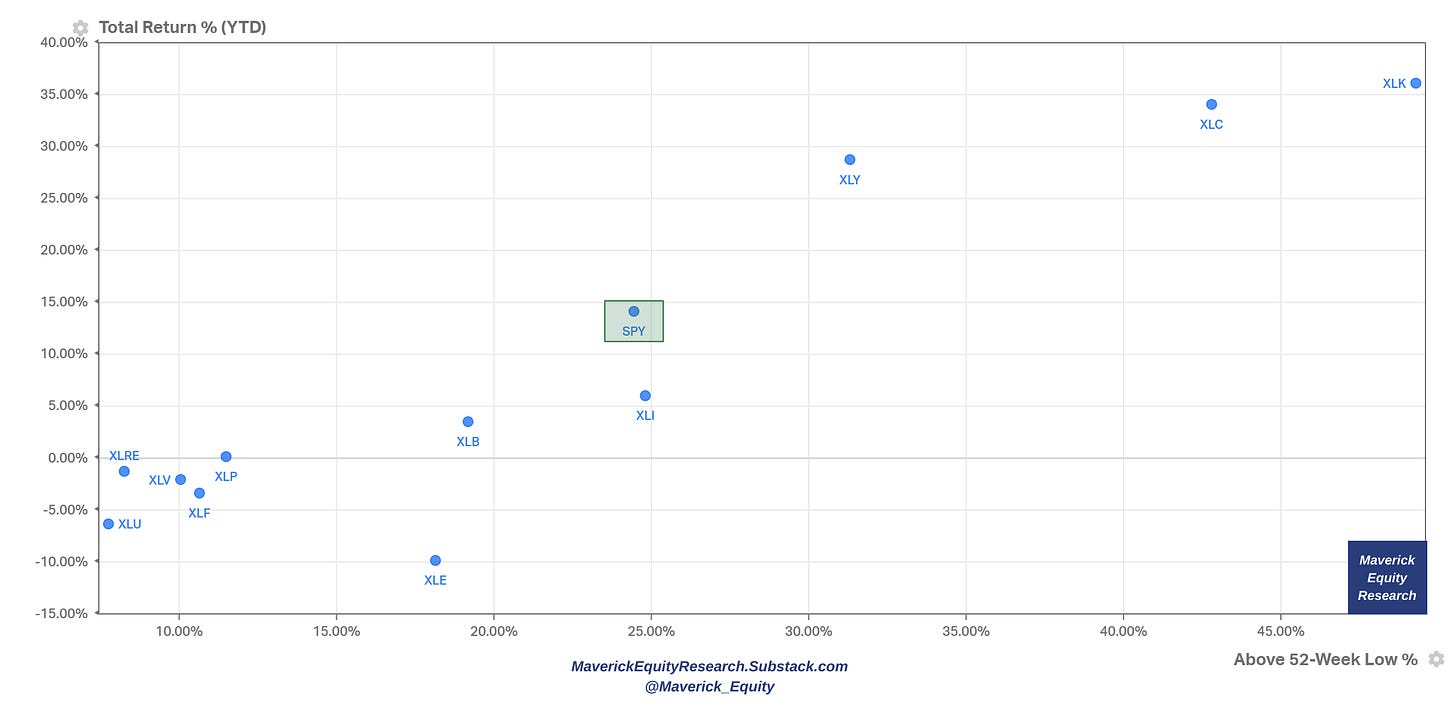
The 11 Sectors + S&P500 itself (SPY) with 2023 % returns & Above 52-Week Low % for an extra dimension and same key message: XLK, KLC & XLY also with the momentum from their 52-week lows
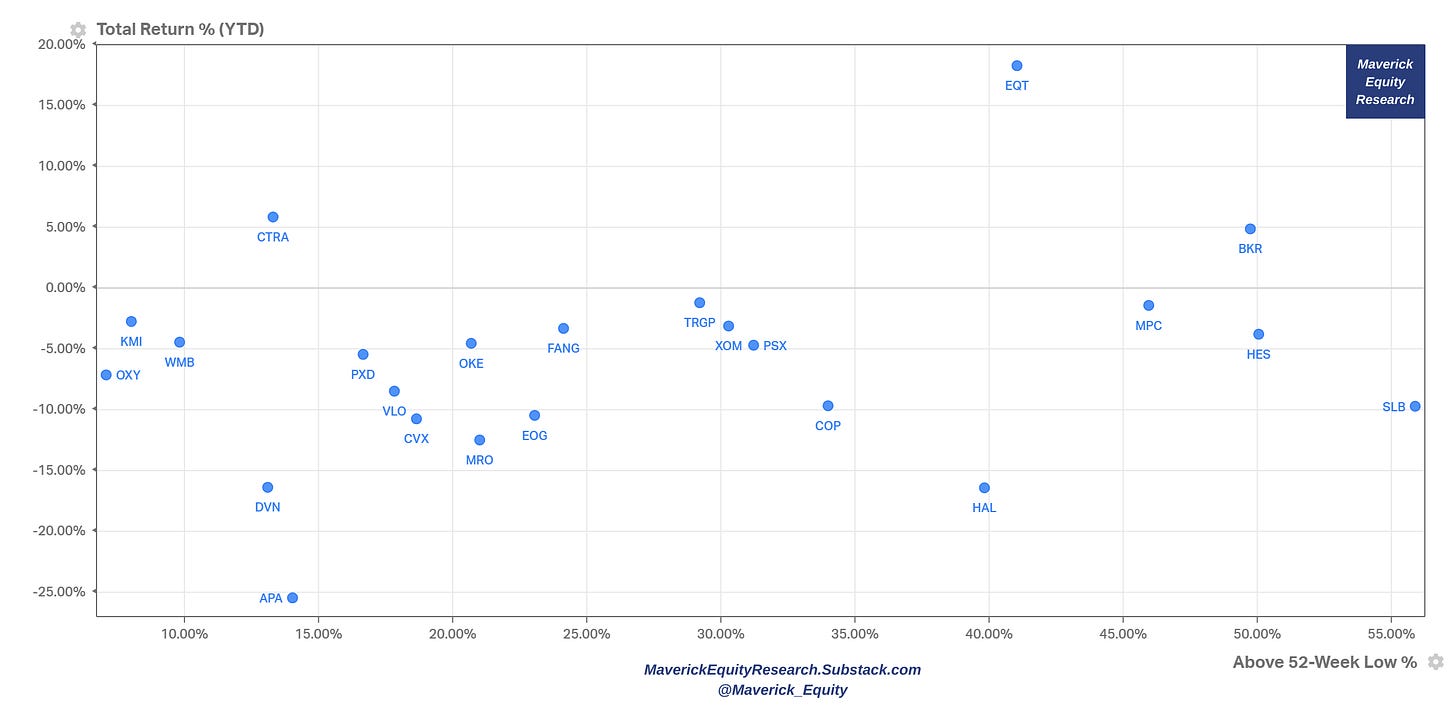
And now let’s zoom into the Price/Performance of the 11 sectors via Scatterplots: 2023 % returns & above 52-week low % returns. General use case for this kind of scatterplots visuals? Check for outliers, market leaders & laggards, positive/negative momentum, relative strength and/or likely un/warranted cheap or expensive stocks:
XLY - Consumer Discretionary
XLP - Consumer Staples
XLE - Energy
XLF - Financials
XLV - Health Care
XLI - Industrials
XLB - Materials
XLRE - Real Estate
XLK - Technology
XLC - Communications
XLU - Utilities
📊 Technical Analysis: Short Term & Long Term
Short Term: once we broke out of the major resistance level (red) & the 200-day simple moving average, we are in an up trending channel that is now at a resistance level. This is also reinforced by the RSI at 70 which also tells us we are likely overvalued on the short term (as it signalled also before local tops, hence likely to see a pull back on the short term)
Long Term: S&P 500 now materially above both the 50 & 100-week moving averages (given the entering recently into a new bull market +20%) which are the new resistance levels going forward. RSI showing to overvalued territory at a value of 70 which often signals a pull back.
📊 Liquidity & Sentiment
Liquidity:
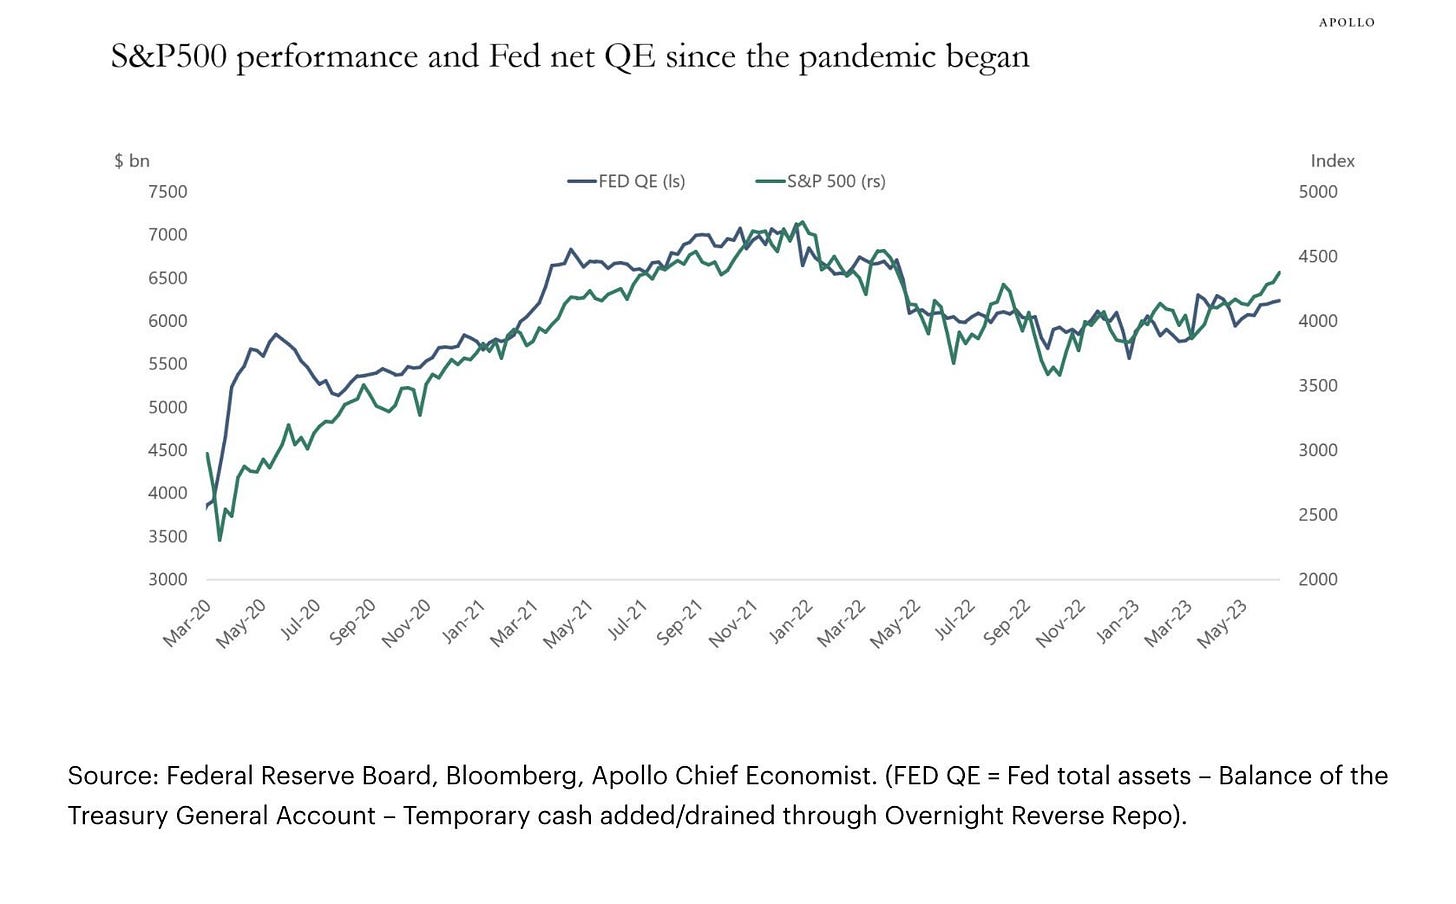
since the pandemic began, the performance of the S&P 500 has been very correlated to the US FED’s QE: correlation doesn’t prove causation though worth to notice that the S&P 500 looks a bit overstretched via this measure (FED’s QE also defined often as Net Liquidity via the formula below as per Apollo).
Now let’s zoom a bit out and remind ourselves the Lehman Brothers / 2007-2009 Great Financial Crisis period, when we had after one of the most misunderstood / hated rally in history. Correlation between the size of the FED’s balance sheet (amount of bonds it had bought) & the S&P 500 was quite high. No matter how we define liquidity, imho liquidity matters a lot!
3 Sentiment views, retail investors & mixed/composite indices & institutional survey:
After the S&P 500 -17% fall in 2022, retail investor sentiment is picking up materially
The Fear & Greed index points to extreme greed at 80 while 1 year ago in the 2022 bear market we were at the 26 level …
Surveyed nearly 900 institutional investors signal us that despite the recent rally, investor sentiment is still largely bearish
📊 Special & Alternative Metrics
S&P 500 & labour intensity:
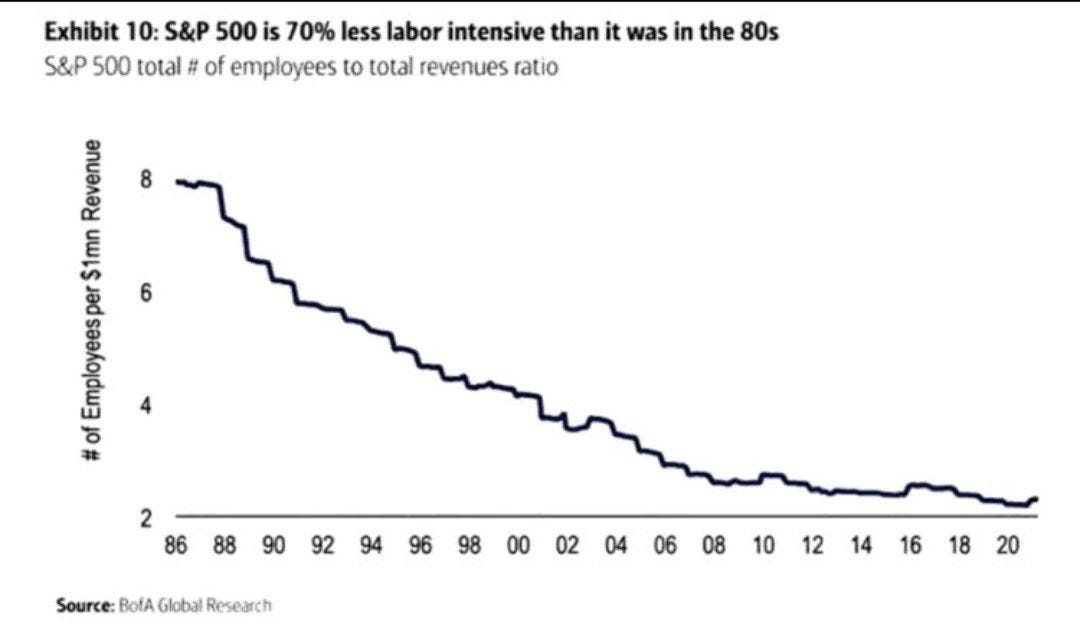
S&P 500 becoming less & less labour intensive since the 1990s due to Technology
from 8 employees in 1986 to generate $1mn of revenue these days it needs just 2
hence, the S&P 500 has become 70% less labor intensive
Jokingly now, will ChatGPT bring this close to 0? ;)
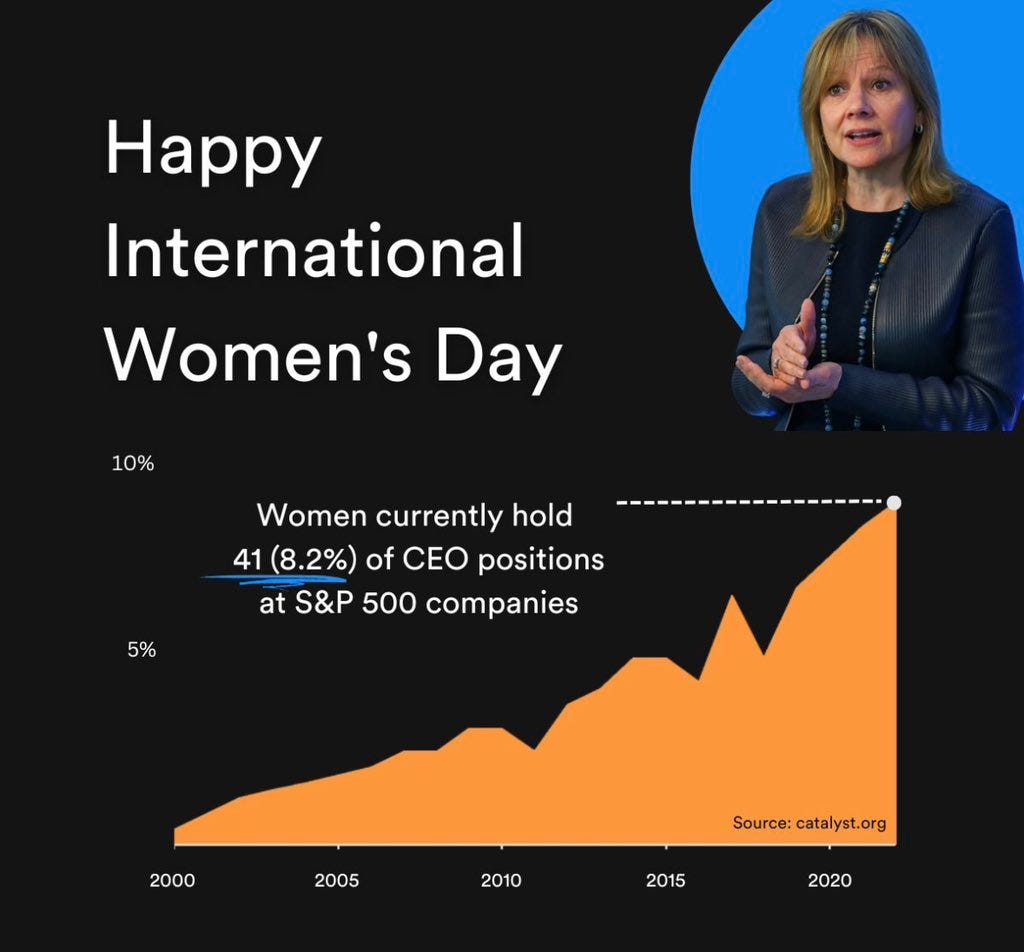
Women in the S&P 500 leadership & Buffett on women in the workforce overall: “when I look at what we have accomplished using half our talent for a couple of centuries, and now I think of doubling the talent that is effectively employed or at least has the chance to be it makes me very optimistic about this country”
👍 Bonus Charts
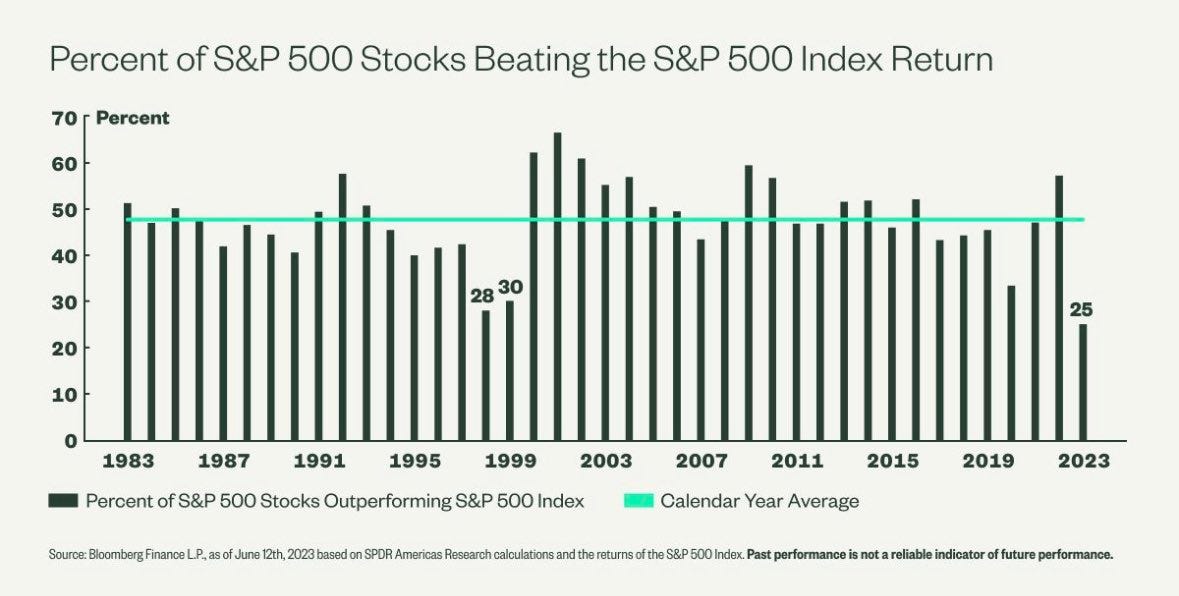
“A rising tide lifts all boats” but a few big boats are now lifting the tide, namely that in 2023, only 25% of the S&P 500 stocks are outperforming the market (well below the 48% average) which is the lowest level in 40 years
Basically, firms that have AI exposure are easily beating the S&P 500 in 2023 ...
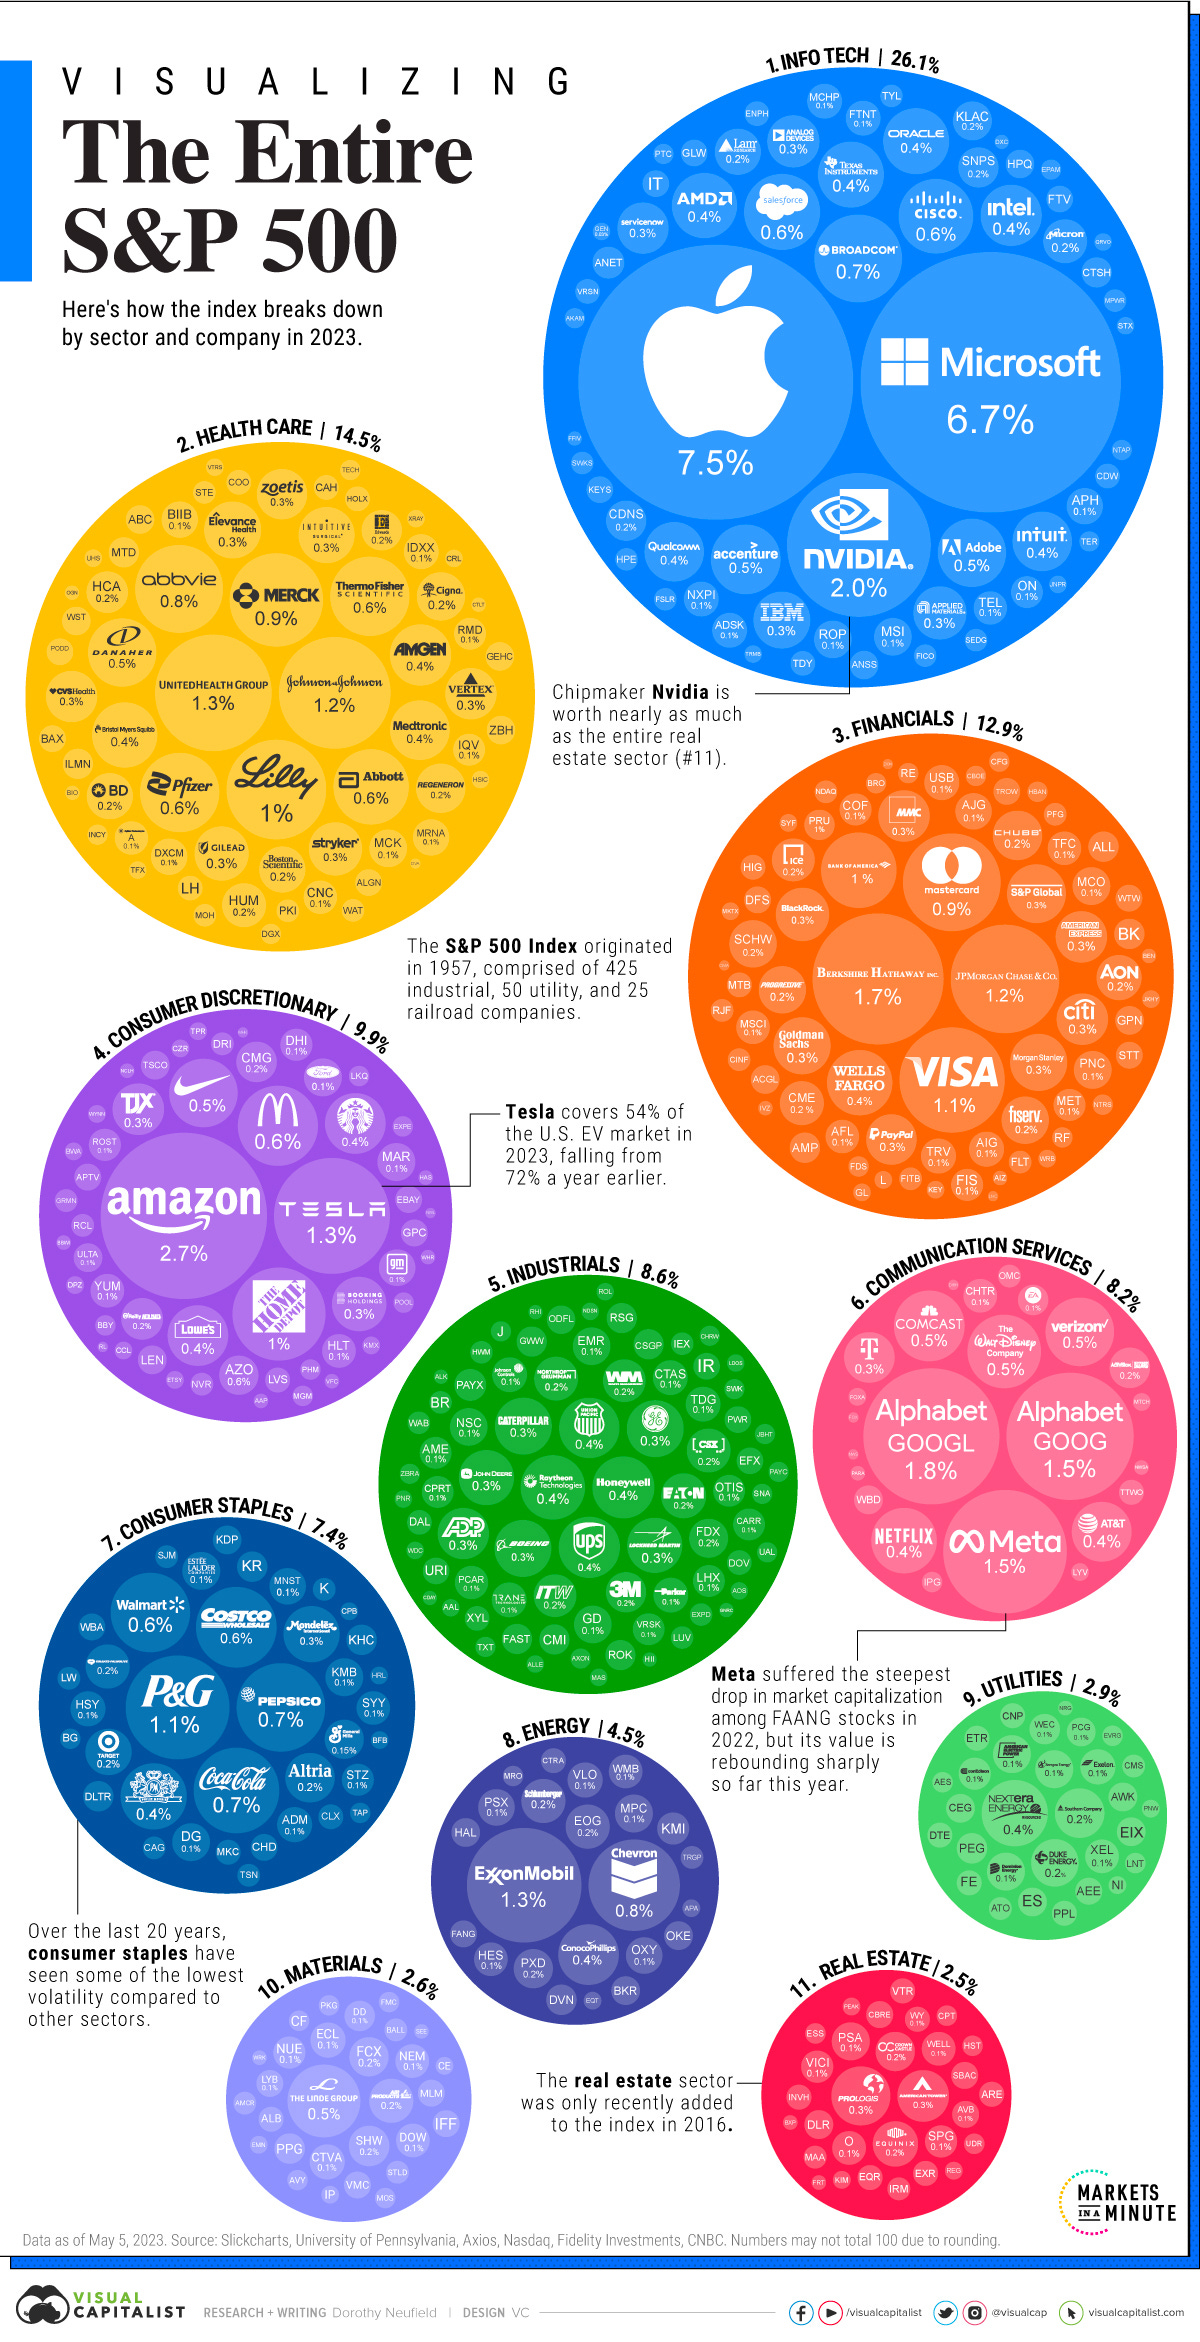
Visualizing Every Company on the S&P 500 Index with key highlights
Have a great day!
Maverick Equity Research



















Great analysis, thanks for sharing it!
Another banger! Great job Maverick.
I wonder what makes the S&P500 "special" among broad indices.
The fact that US companies are global, that a US listing is more attractive, that ambitious people choose to move to the US (from the Big 7 so many founders or CEOs were born elsewhere)?
It makes me wonder, if you live in Europe and want to have just ONE index for equity exposure: Would you pick a global index (some variation of MSCI World) or the SPX?