✍️ The S&P 500 Report: Performance, Profitability, Valuation & Key Metrics - Ed #1
Breaking down the S&P 500 & the 11 Sectors via Sleek Charts - Edition #1
Dear all,
welcome to the 1st edition of the S&P 500 Report with a focus on Performance, Profitability, Valuation & Key Metrics: breaking down the Index & the 11 Sectors via returns, multiples & key metrics. A unique & comprehensive report via data driven Research & visually appealing charts that simply tell a 1,000 words.
Report is not behind a paywall & there are no pesky ads here. It would be highly appreciated if you just spread the word around to people that might also be interested.
Structured in 5 parts + bonus charts & designed to have a natural flow, though just jump to the section that you are mostly interested:
🏦 FED: Interest Rates, Balance Sheet & the Yield Curve 🏦
📊 S&P 500: Performance Ins & Outs: September & 2022 📊
📊 S&P 500: Profitability, Multiples, Value & Growth, Dividends & Buybacks 📊
📊 S&P 500: the 11 sectors via Key Metrics, Price & Valuation Scatterplots📊
📊 S&P 500: Special & Alternative Metrics 📊
👍 Bonus Charts 👍
📊 FED: Interest Rates, Balance Sheet & the Yield Curve 📊
Before we jump into the S&P 500, let’s set the context with the latest from the FED & interest rates side. The rationale for this is that simply put, interest rates are a key determinant in valuing any asset on planet earth (some more directly & fast some less). Stocks specifically, let’s just recall quickly Warren Buffett’s take on rates: ‘everything in valuation gets back to interest rates’ & ‘interest rates are 'gravity' on stock prices’.
FED overview & the Yield Curve in one single chart:
at 4% now, the interest rates hiking cycle continues and note that we are currently above the 2019 2.5% peak while still below the 2007 5.25% peak
note also how the current cycle is way less gradual relative to the previous two; in fact the FED engaged in its most aggressive rate-hiking cycle since the 1980s
starting point note: ramping up nice & easy ‘data dependent’ when rates are already at 5% is different than ramping up quickly when they have been ‘nada’ 0%
Fun fact: market expectations for ‘peak FED’ is currently at 5.18% which is virtually the same as the peak value reached in 2007. Note: after the latest November FOMC, not only the expected peak rate went higher, but it also went out further in time for May 2023. The outcome of the press conference in 3 words: ‘higher for longer’.
FED chief Jerome Powell - FOMC November press conference: ‘‘It is very premature to think about a pause in our interest rate hiking cycle’’
The change in market expectations before the November FOMC & after via GS: the Bond Market Priced Less Tightening in December but More in 2023 in Response to Today’s Meeting
S&P 500 timeline & exact reaction on the latest FED action: no comment…
The Yield Curve (10Y vs 2Y), is currently inverted like Maverick in the Top Gun scene when he went into a 4G inverted dive to show ‘the birdie’ to the Russian MiG-28 enemy aircraft. ‘Is this your idea of fun, Mav?’😉, talking about birdies together with the Yield Curve!? Yeah! ‘What are you doing here? Communicating! Keeping up foreign relations (with the markets in our case😉)’ … ‘Jeez, I cracked myself up!’😉
U.S. interest rates 1y 2y 3y 5y 10y 30y with a 20-year lookback period:
3 hiking cycles in 20 years: not the 1st one nor the last one
currently above the 2015-2019 period, though below the 2004-2009 cycle
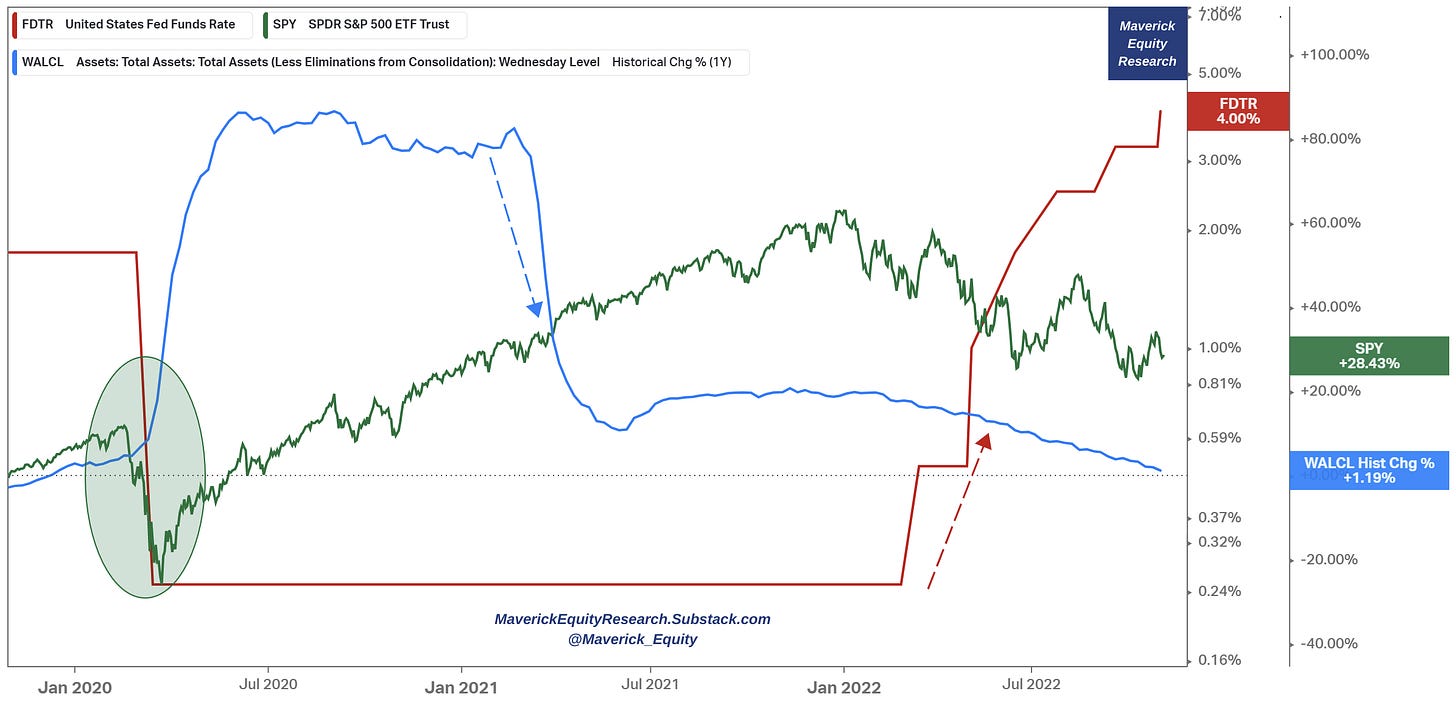
FED & S&P 500 overview: we can see below how once the Covid outbreak they did throw the bazooka by cutting rates aggressively (red) while also expanding the balance sheet (blue). However, once that ‘god mode on’ had to be slowed down & rates reversed due to inflation, the S&P 500 (green) had to cool-off, though a key note: despite a pandemic, inflation, higher rates & a war in Europe, the S&P 500 still returned 28.43% (8.36 CAGR) to investors which is not bad at all.
A more sophisticated liquidity measure in the system comes via Morgan Stanley. The correlation between liquidity & the S&P 500 return is quite something to track of:
Main take-away is the same in both cases: just like at one’s local pub, liquidity matters a lot for … valuation, both going up and down … .
Now everybody is asking & guessing, are we experiencing peak inflation these days ?
Let’s have a look at the M2 money supply 12m % change since 1959: FED bazooka deployed once Covid, bazooka removed once inflation showed up … “pretty much came from about nowhere” (Lagarde) - your thoughts on that ? …
If inflation is a lot a monetary "thing", one should watch for this leading metric/model via Morgan Stanley: US CPI Y/Y % change & M2 (money supply) Y/Y change leading by 16 months:
Overall, inflation, interest rates & liquidity in the system will be a pressure point on valuations (cost of capital/financing conditions etc), though that does not translate automatically to a regime where stocks will do bad. What is quite certain is that it will not be as easy as before, and very certain we will not see anytime soon that Q4 2020 period: the combo of ‘Pfizer Monday’ when we first saw the vaccine coming & record FED (major central banks also & fiscal policy) stimulus, created a market where everything was flying: you could throw darts at stocks & you would find ‘winners’.
Indebted companies & weak business models with weak balance sheets will struggle going forward while others will do well quite independent of the FED & other issues. There are businesses out there that do well in pretty much any environment and are business cycle agnostic: both ‘value’ & ‘growth’ types.
This kind of ‘agnostic investing’ businesses how I like to call them & many other will be covered in the future in detail inside the ‘Full Equity Research’ section of this independent research platform.
📊 S&P 500: Performance Ins & Outs: September & 2022 📊
In September the S&P 500 notched its first monthly gain since July following two straight monthly losses. Material strength happened in the last 2 weeks of the month for an overall 5.35% return:
Zooming in via a heatmap via FinViz depicting the main holdings of the 11 Sectors:
2022 year-to-date (YTD) performance -18.37% with a dividend yield of 1.61%:
Have you wondered if the -18.37% in 2022 is concentrated in a group of stocks or more distributed ? Return attribution analysis answers that: -8.75% is due to just 7 stocks found in the table below. In other words, in 2022 about half (47%) of the S&P 500 performance is due to Big Tech popular names & Tesla, ‘let that sink in’. Former leaders are now detractors: will they lead again once interest rates & inflation cool off ? Food for thought …
On the positive flip side, these are the major contributors: Energy & Health Care …
Complementary: MAGMA (META, AAPL, GOOGL, MSFT & AMZN) & Energy as % of total S&P 500 market cap: tech giants after the recent heavy drop are still around 20% of the S&P 500 with Energy gaining for around 7% currently:
Now visually, all S&P 500 components via % price YTD & holdings weight: naturally, stocks weights in an index do matter for an overall index:
Now let’s ignore weighting and go for the S&P 500 unweighted components via the following interesting dimension: % price YTD & Above 52-Week Low %: Buffet’s Occidental Petroleum OXY is a big outlier with a 150% return this year & 176% above the 52-Week Low. It is not often a single stock does this in not even a year, but in just 10 months. Did not expect it, though in Q3 we just found out he bought more OXY shares which brings the total stake in the business to 20.9%.
General use case for this kind of scatterplots visuals? Check for outliers, market leaders & laggards, positive/negative momentum, relative strength and/or likely un/warranted cheap or expensive stocks:
One more not here: in general, it might be counterintuitive, though anytime this kind of outlier returns happen, when something is working in a too well & too fast combo, my way is not getting more confident but start asking more questions and/or consider cutting: how likely is it in 2023 this will gain another 150%? Unlikely. Even a 20-30% would be very good on top. Alternatively, a good idea is to check how cheap is to hedge market leaders in order to protect gains. In general, hedging gets cheaper the more a stock goes parabolic. Watch the downside, the upside will take care of itself… .
Time to zoom out a bit now and have a look at the 11 Sectors that shape the S&P 500. XLE Energy leading by far in 2022 & the only positive sector with Communication Services the biggest laggard. Energy continues to lead agnostically: when oil is up, when oil is down, when yields are up, or when they are down, when the market expects a more hawkish or dovish FED:
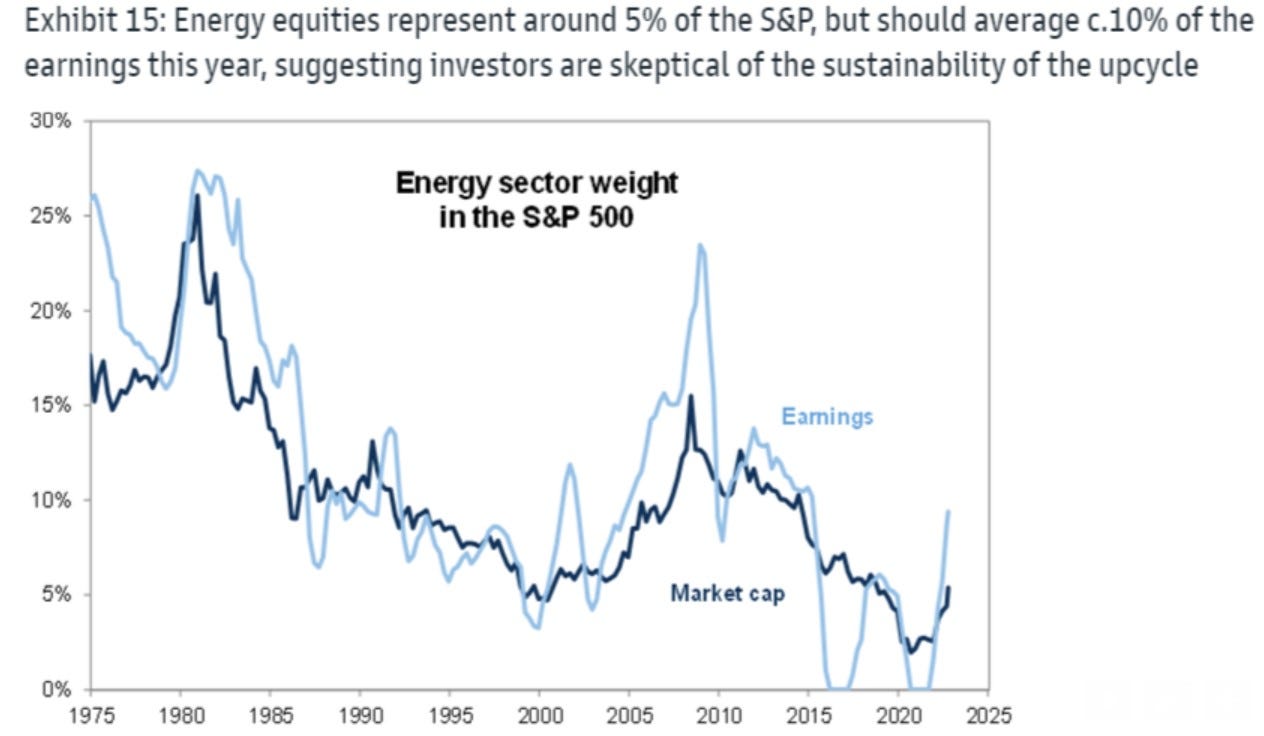
However, a key note vis GS: 1-year forward P/E multiple has compressed meaningfully also in Energy: market does not view current oil, natural gas prices & refining margins as sustainable, hence unwilling to capitalize "supernormal" profits:
Now do we have now also interesting outliers in terms of Sectors outperformance/ underperformance? Yes, and actually a ‘biggie’: XLE & XLC 2022 return & XLE/XLC.
S&P came also with the very interesting historical remark: "Energy has now extended its lead against laggard Communication Services to 24% this month and an absolutely eye-watering 106% year-to-date. 2022 looks set to host the widest annual spread between the best- and worst-performing S&P 500 sectors, ever." Let that sink in …
Single stock food for thought note: Exxon XOM market cap did not just surpass Facebook's META, but it is almost double now (XOM is up 13 of 15 sessions for a 91% YTD total return):
Zooming out for a 3-year period: except XLC Communication Services, all sectors are materially positive …
Let’s check now Value & Growth in 2022 & the 3-year period via VTV & VUG (ETFs): in 2022 VUG growth (blue) with a heavy -33.9% drawdown while VTV value (green) holding materially better with just a -4.69%
With a 3-year timeframe, we see how Value just outperformed Growth: in any case, a 29.7% & 25.3% return to investors are still not bad at all.
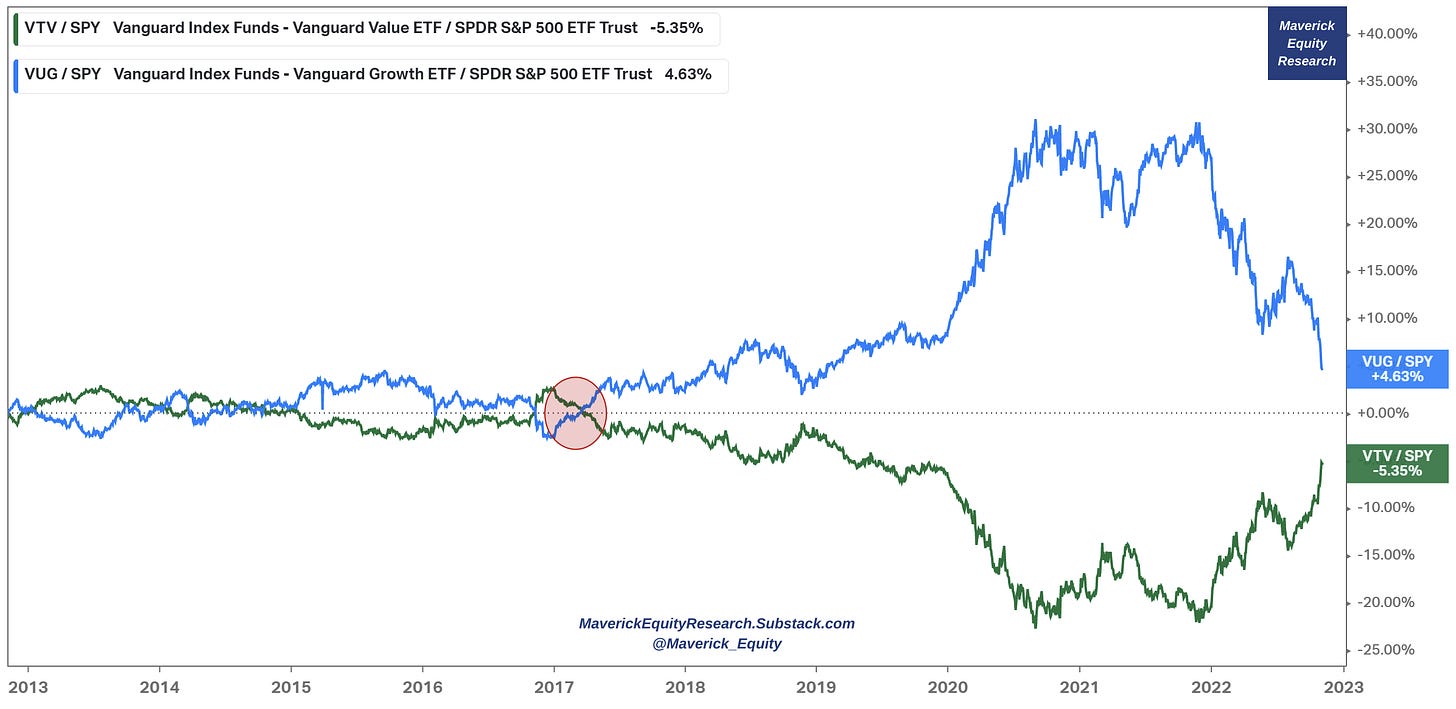
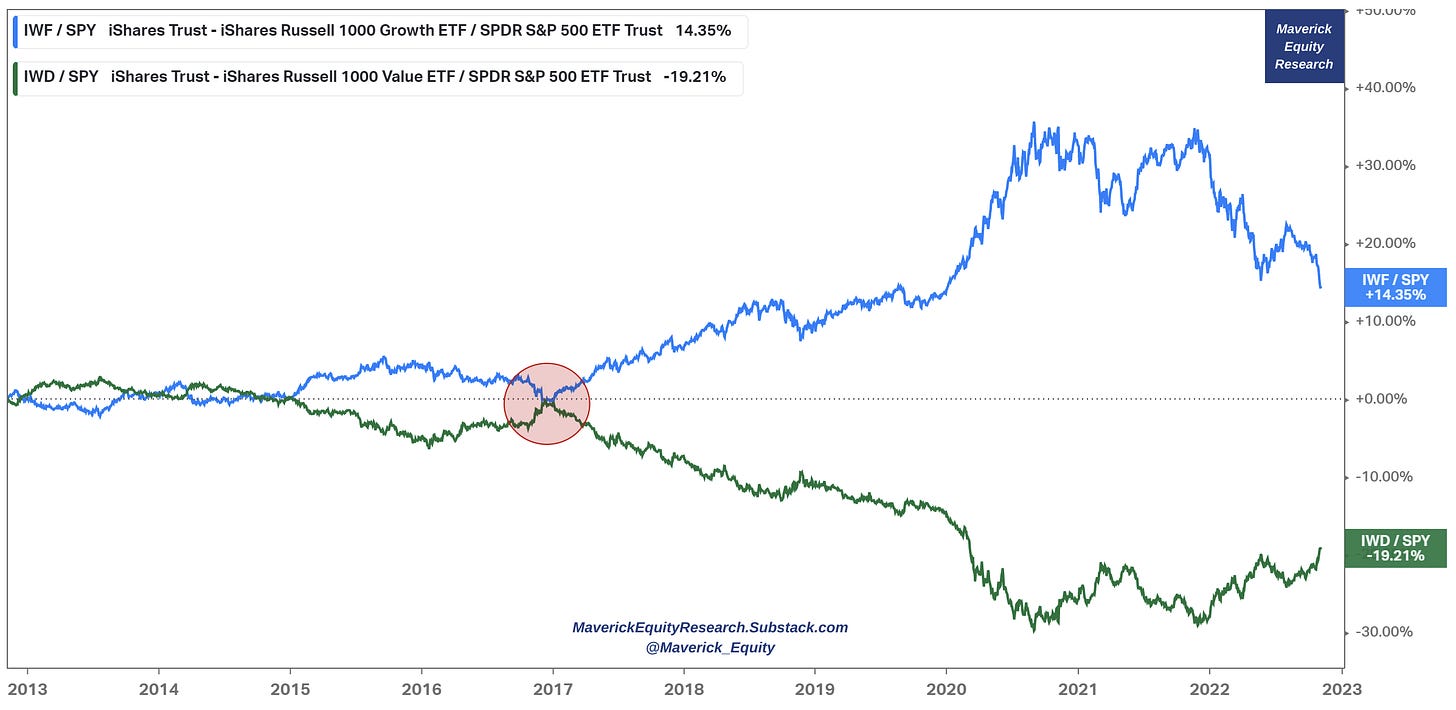
Is there a way to see the Rotation from Growth to Value and since when did it start? Sir, yes sir: for that we go for a 10-year timeframe and relative to the S&P 500: one can say that growth went parabolic around 2017, had a parabolic run once FED deployed the bazooka in 2020 while now cooling off once having to fight inflation. Some more time is needed for Value to ‘close the gap’ at least via these 2 ETF proxies.
The same relative game, but via IWF Growth (blue) & IWD Value (green): via these 2 proxies for growth & value, growth took over materially still in 2017 though ‘the gap’ is way bigger:
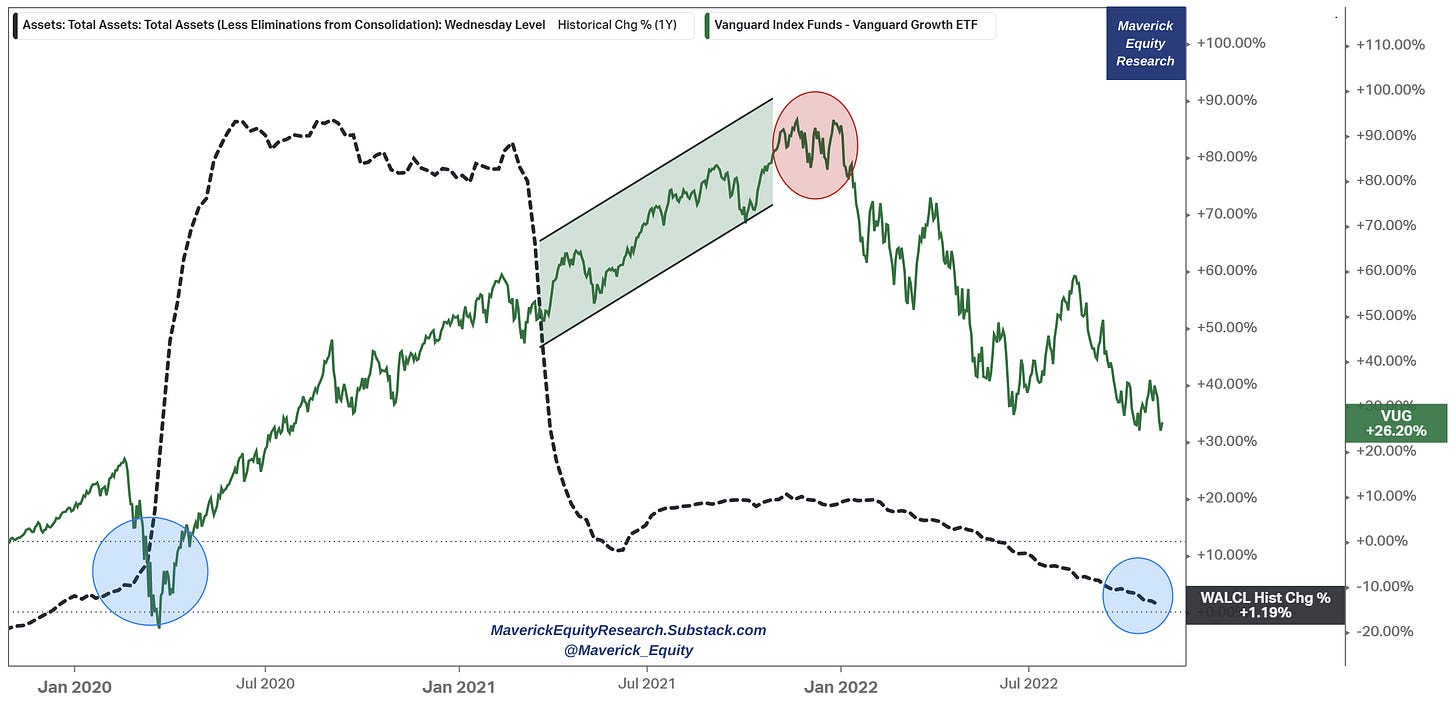
A special chart view now by looking also at ‘hyper-growth’ / ‘innovation investing’ via ARKK (ARK Innovation ETF) as proxy and my ‘Buy Low, Sell High 'FED model' (pun intended😉): FED balance sheet % change (black) going parabolic and ‘causing’ a parabolic run in ARKK (green) … while the same in reverse not that much later … buy again when the FED eases ? Food for thought …
The same pattern but with VUG ‘normal’ growth though cooling-off with a delay:
A final note on Value & Growth investing via SCHV/SCHG proxies: Growth outperformed Value massively for more than a decade. Via the tricky recency bias which is easy to have when investing, one would have expected this will continue on and on … until dirt cheap money become expensive money as interest rates had to be hiked very aggressively to cool-off inflation. Value is back … .
Aside from classifications/style, as Mungers puts it ‘all investment is value investment in the sense that you're always trying to get better prospects that you're paying for.’ Good businesses will always be there both from the ‘Value’ & ‘Growth’ camps.
📊 S&P 500: Profitability, Multiples, Value & Growth, Dividends & Buybacks 📊
S&P 500 price & EPS 12-month forward: back to earth & more aligned after the FED (and fiscal policy) induced parabolic run once the Covid outbreak. When stock prices go way above earnings/EPS consider getting cautious ... fundamentals matter always sooner or later. In the end it is all about earnings I heard on the street …
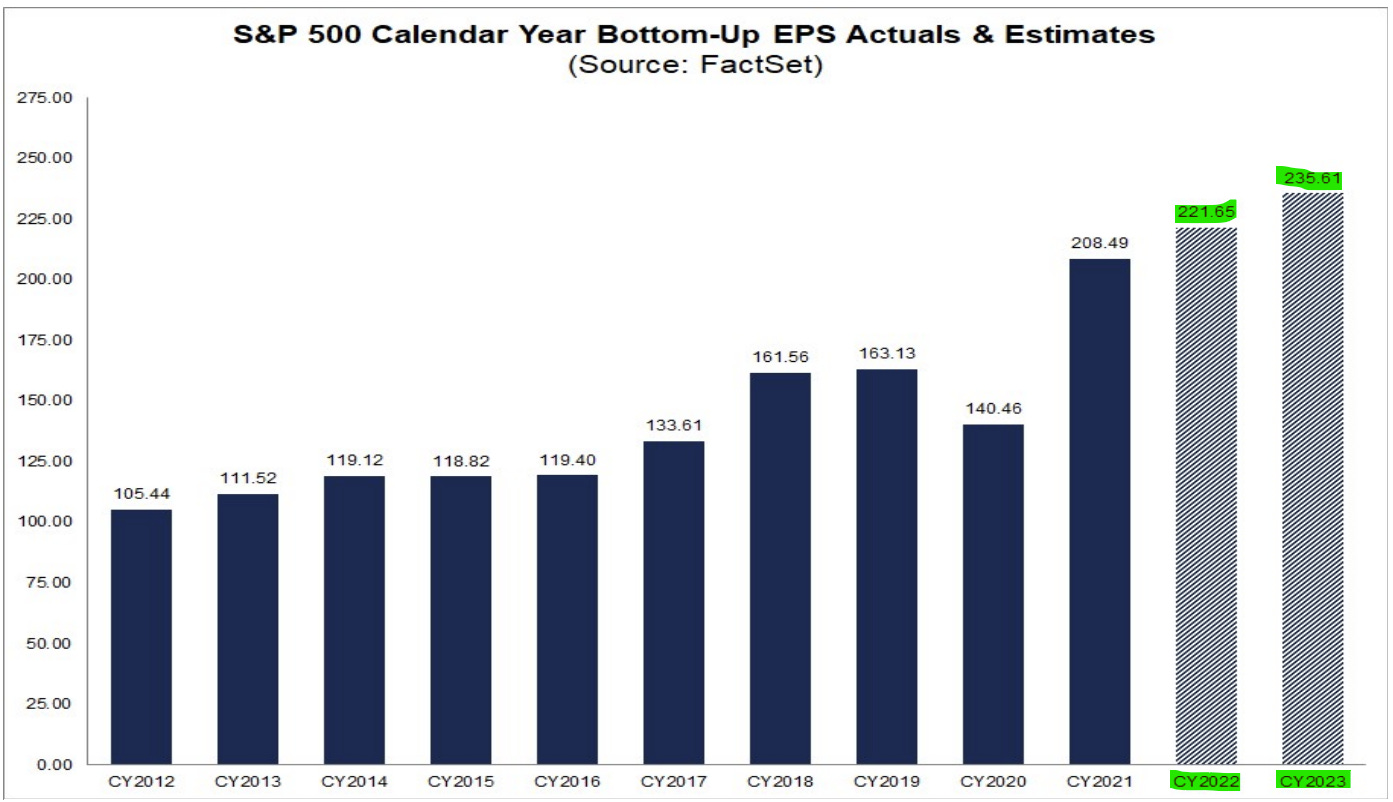
Switching now to the S&P 500 EPS Actuals & Estimates: 221 for 2022 & 235 for 2023. No (real) recession on the horizon?
Going forward to the forward P/E ratio: S&P 500 Forward 12-month P/E = 16.3x
16.3x is below the 5-year average of 18.5x & below the 10-year average of 17.1x
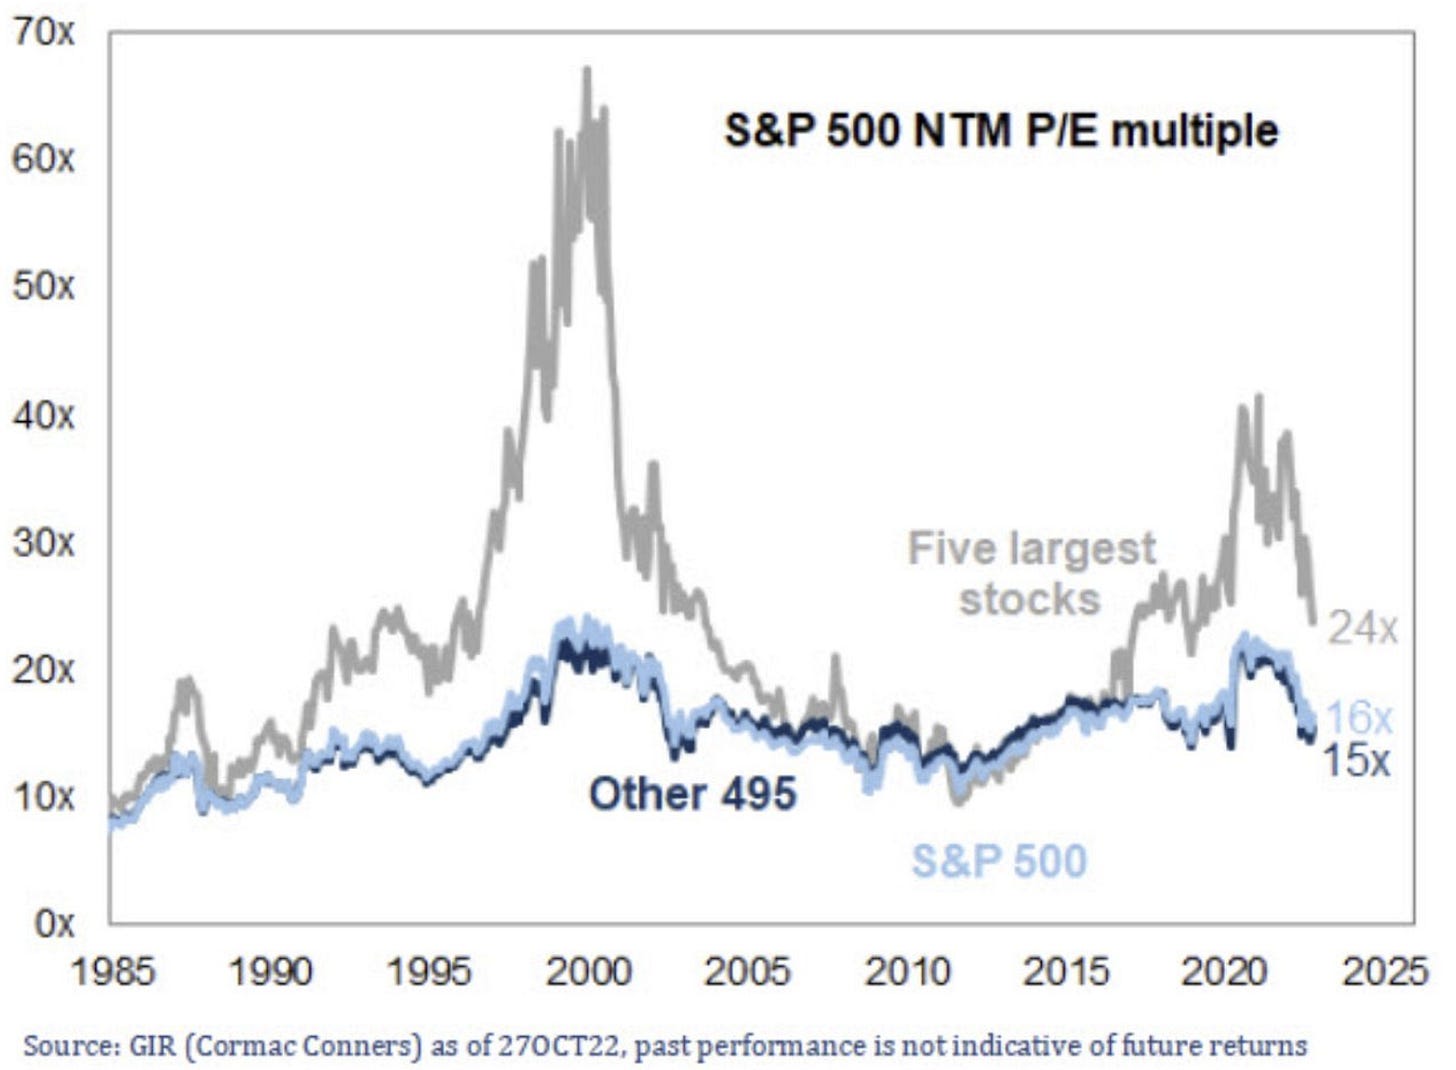
Note now this interesting Forward P/E Multiple breakdown: compression is present across the board, but not created equal and coming down from different levels:
👉 5 largest stocks quite a story since 2016: from a high of above 40x to a 24x now
👉 S&P 500 = 16x ‘vs’ 5 largest stocks = 24x ‘vs’ Other 495 = 15x
Now what’s in store for the S&P 500 going forward ?
👉 Short-term wise:
given the FED action (‘It is very premature to think about a pause in our interest rate hiking cycle’’) & big tax loss selling opportunity going into year end (see Gundlach), even with a Christmas rally it is hard to see the S&P 500 trading by year end at the 5-year average forward P/E of 18.5x which would correspond to a ~4,088 level … which would not be bad at all in any case …
On the other side, hiring remains very strong with the US adding 261,000 jobs which was way above estimates, hence hard to see the market tanking by year end. Moreover via Valuabl, profit margins for both “Main Street“ & “Wall Street“ (Public & Private) are the highest they have been in more than 70 years … surprised given the sentiment overall ?
Back to the S&P 500: in the summer, we were trading at a forward P/E of 15.5x which can be seen as a floor which would equate to a ~3,425 level
Now if you are like me (just here, no need on everything for sure😉) and you like putting all those words above into a single chart, there you go with 3 key variables for both a S&P 500 ceiling & a floor. All in all: S&P 500 ceiling at 4,088 & floor at 3,425.
Note that 2022 was a bear market, yet Profits have barely declined, surprised? Inflation a negative factor for valuations, though overall given profits hold, I think going into year end we will aim rather for the 4,088 ceiling than the 3,425 floor.
👉 Long-term wise, where with the S&P 500 ? Higher … reminder: the market is structurally net long if one believes societies & economies will evolve … which is not a hard assumption to have …
Technical Analysis S&P 500 long term view: we should watch the 'X' cross-over of the moving average: 50-week kissing the 100-week currently. I highly doubt we go a' la 2001 Dot-Com / 2008 Lehman even if we do cross and more, but might see some more selling pressure short term if we do actually cross. RSI not saying much at this point.
Now have you wondered what drove the S&P 500 returns since 2011?
~21% driven by P/E expansion - compressing since ~2021 as also shown above
~31 driven by earnings - gaining traction since ~2021 - less than expected still ?
~40% driven by share buybacks - huge & especially since the 2020 Covid crash
~8% dividends - less than expected ?
Revenues decomposition also: when one ‘Buys America’, one is actually quite diversified internationally given that ~40% of the Revenues come from abroad:
By sector, tech with the highest international source at 58% while Utilities just 2%:
Any stocks in the S&P 500 that both pay dividends & do share buybacks ? Answer via the scatterplot dividend yield & share buyback yield:
Now let’s see stocks with consecutive annual dividend increases (dividends streak) & buyback yield: some have a record of more than 30 years of paying dividends & they currently also buy back their shares in the 3-5% yield, resilience ?
Which ones are the most shorted stocks in the S&P500 in 2022? Scatterplot has the answer via Short Interest (%) coupled with Price % change (YTD):
📊 S&P 500: the 11 sectors via Key Metrics, Price & Valuation Scatterplots📊
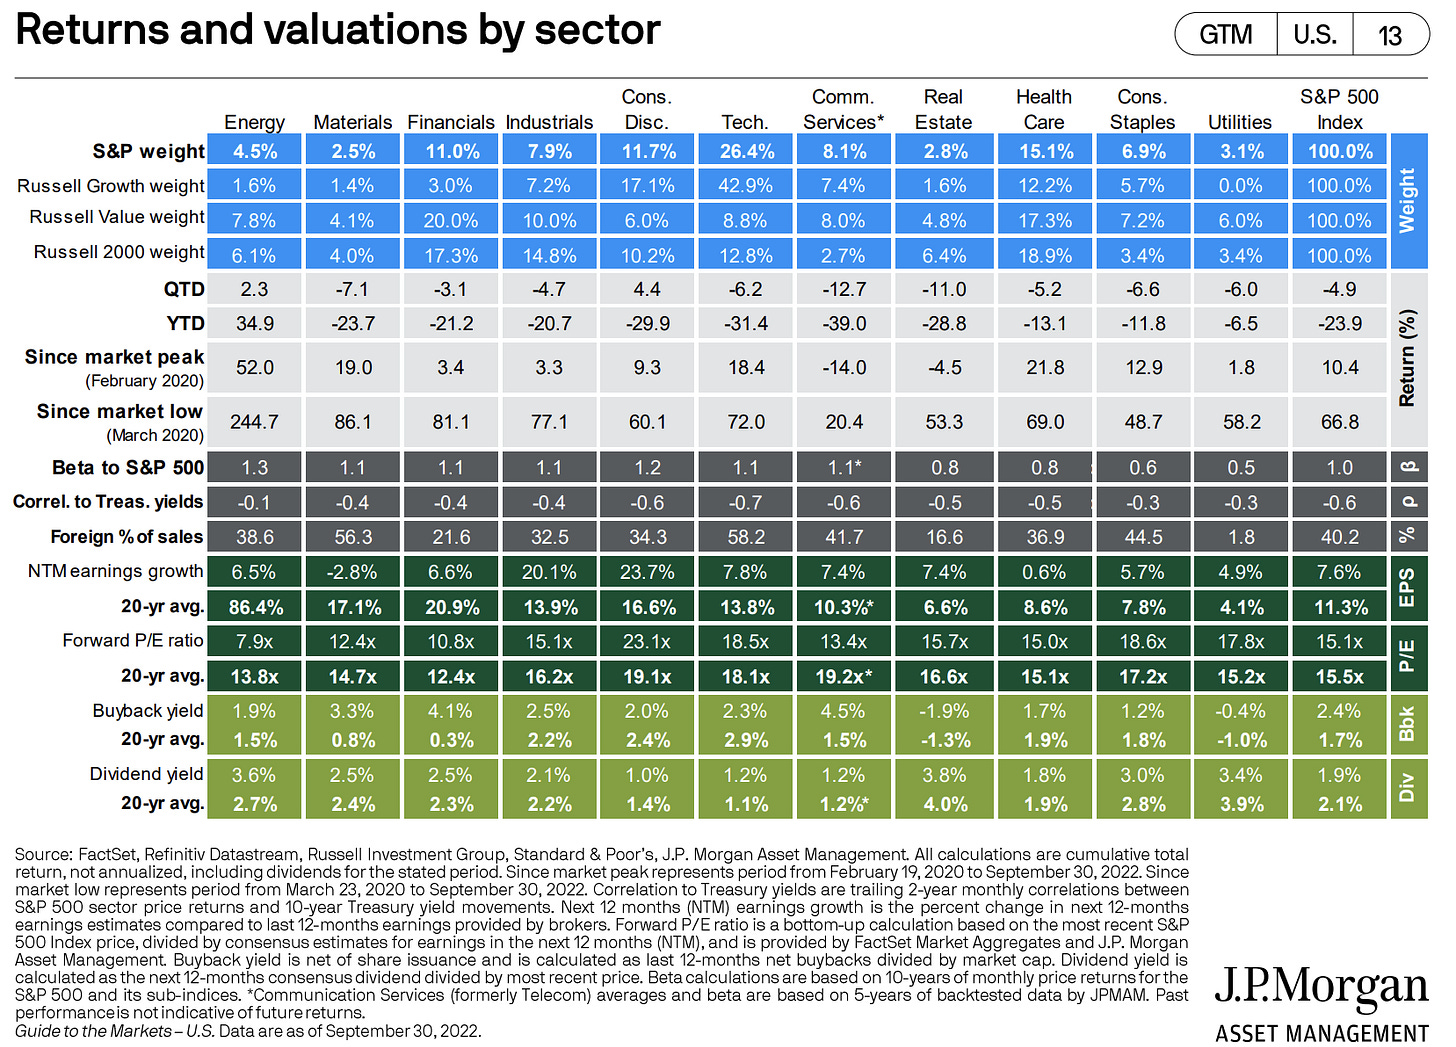
There is no single table out there like this one from JPM that highlights key metrics for the 11 sectors that shape the S&P 500 index:
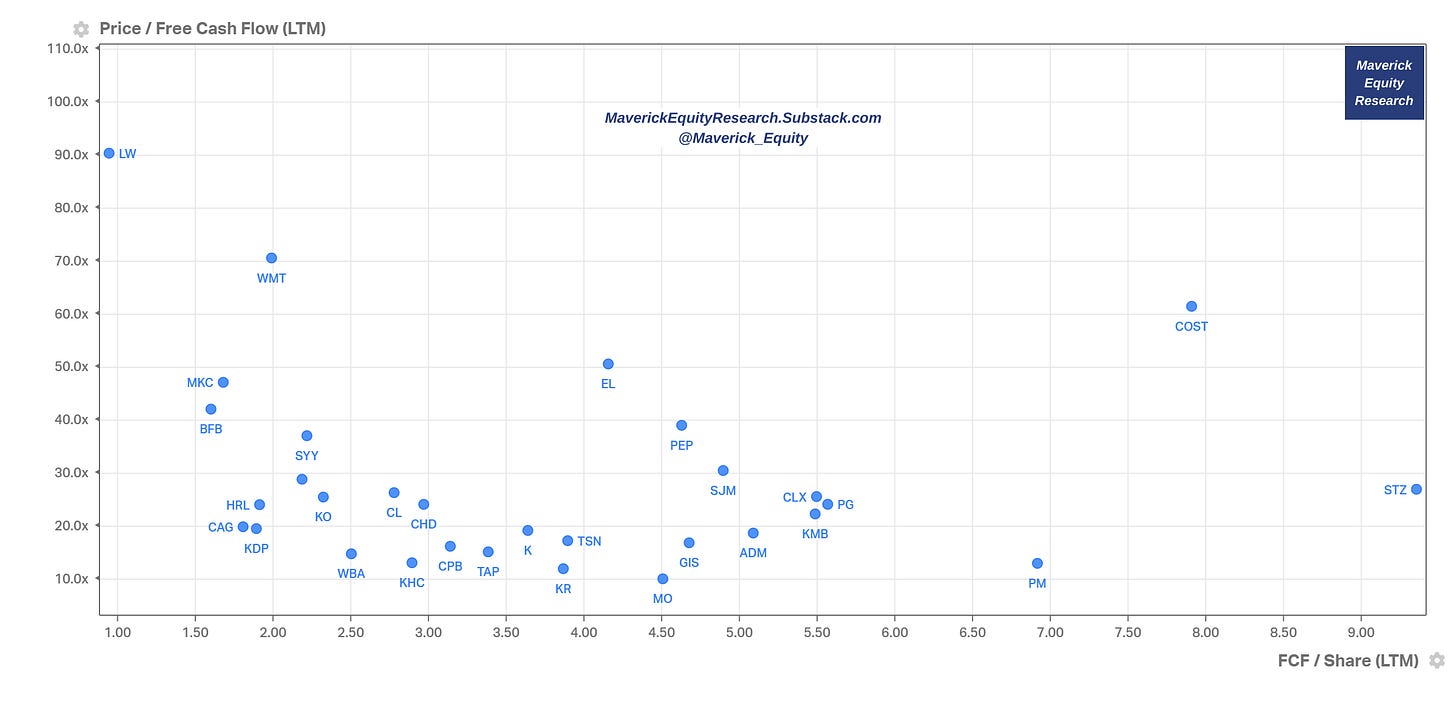
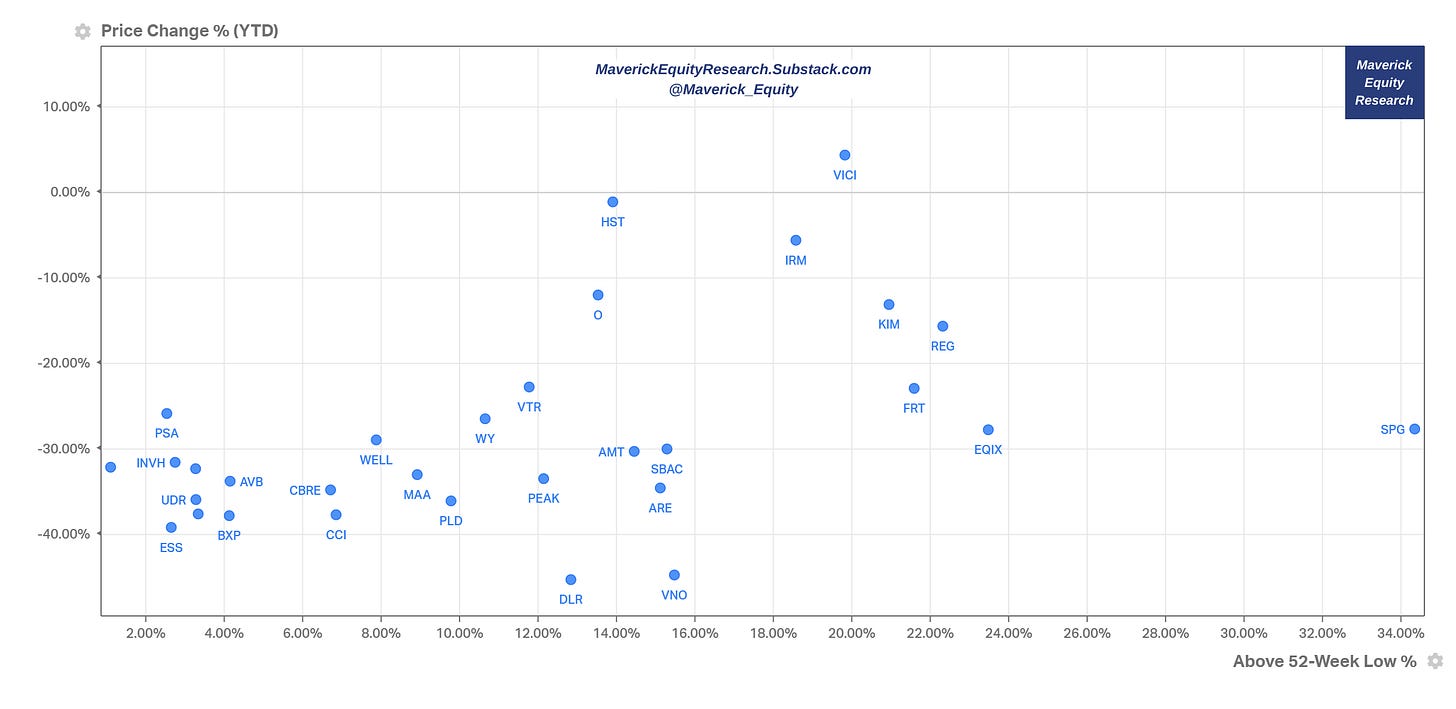
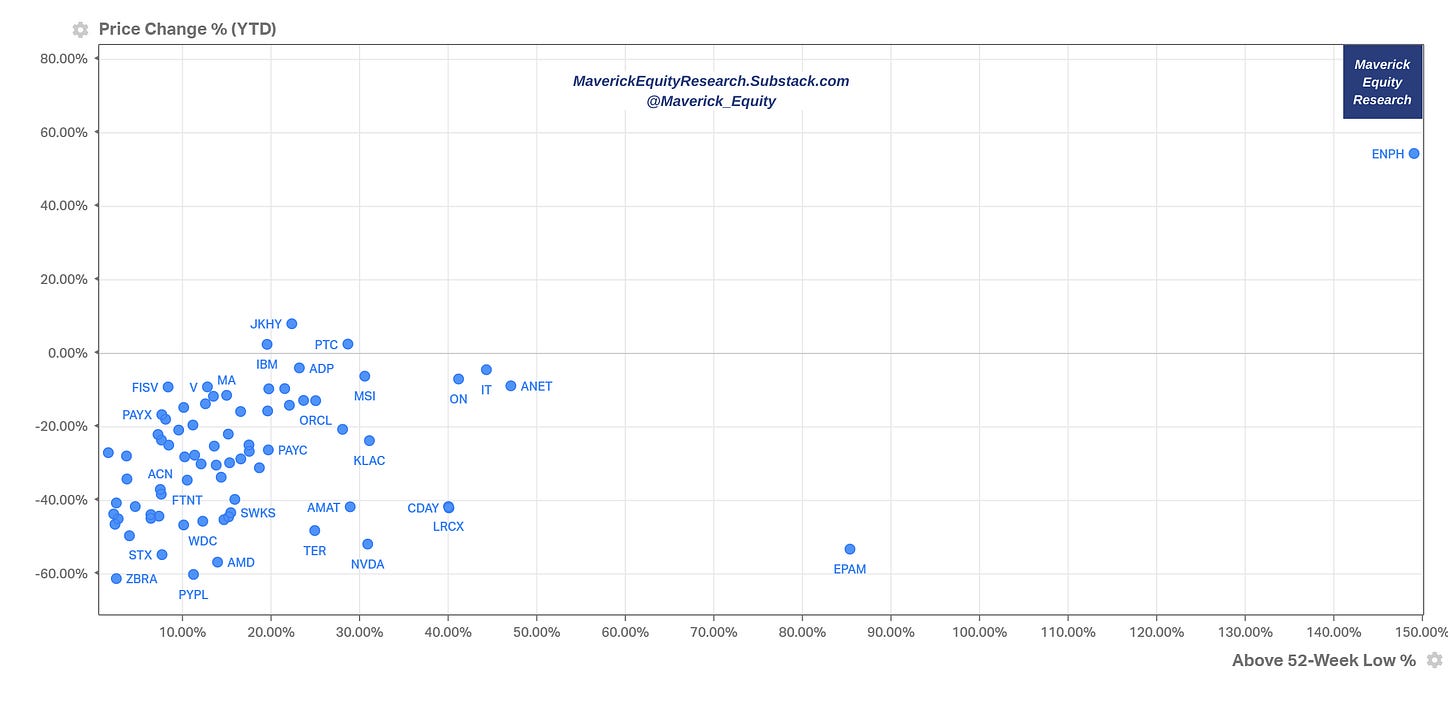
And now let’s dive into Price/Performance & Valuation Scatterplots for the 11 sectors.
General use case for this kind of scatterplots visuals? Check for outliers, market leaders & laggards, positive/negative momentum, relative strength and/or likely un/warranted cheap or expensive stocks:
XLY - Consumer Discretionary
XLP - Consumer Staples: LW luxurious leader, but check that multiple currently…
XLE - Energy: only sector where everything is in positive territory: OXY leading by far
XLF - Financials
XLV - Health Care
XLI - Industrials: have a look at LMT …
XLB - Materials: have a look at CF & NUE …
XLRE - Real Estate
XLK - Technology
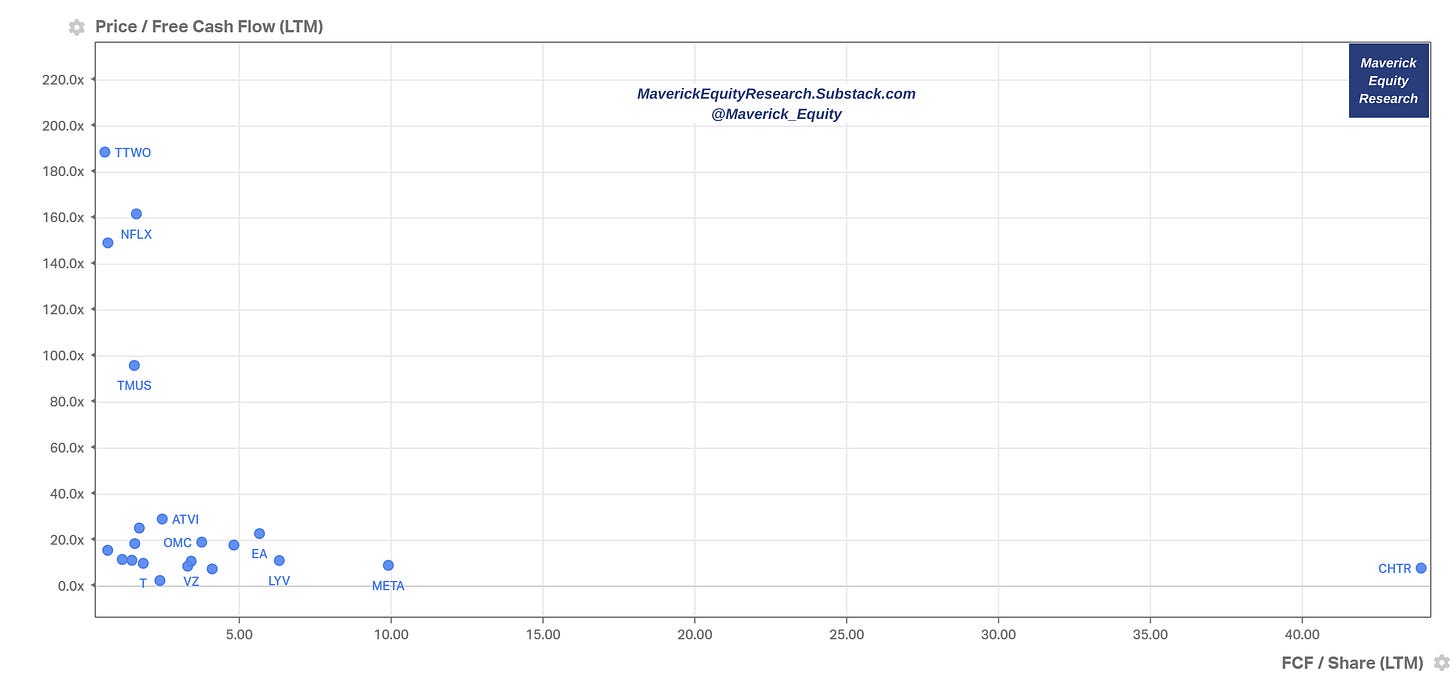
XLC - Communications: check that Netflix chilling in the Metaverse …
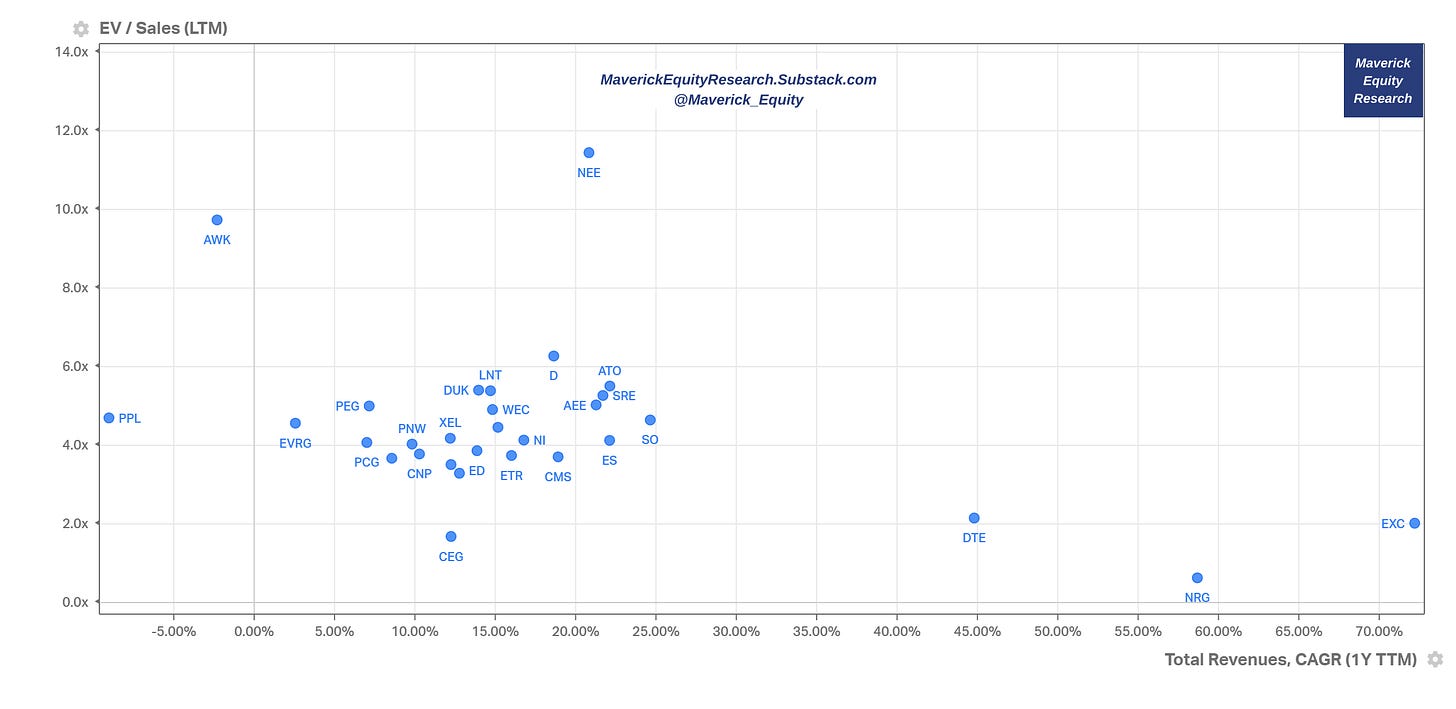
XLU - Utilities
📊 S&P 500: Special & Alternative Metrics 📊
Contrarian indicator - CEO Business Confidence:
👉 currently at the lowest level since 1985
👉 good time to DCA cheaper into equities and/or lump sums?
How about the Consumer Confidence & the S&P 500 subsequent 12-month returns ?
👉 8 sentiment peaks: +4.1%
👉 8 sentiment troughs: +24.9%
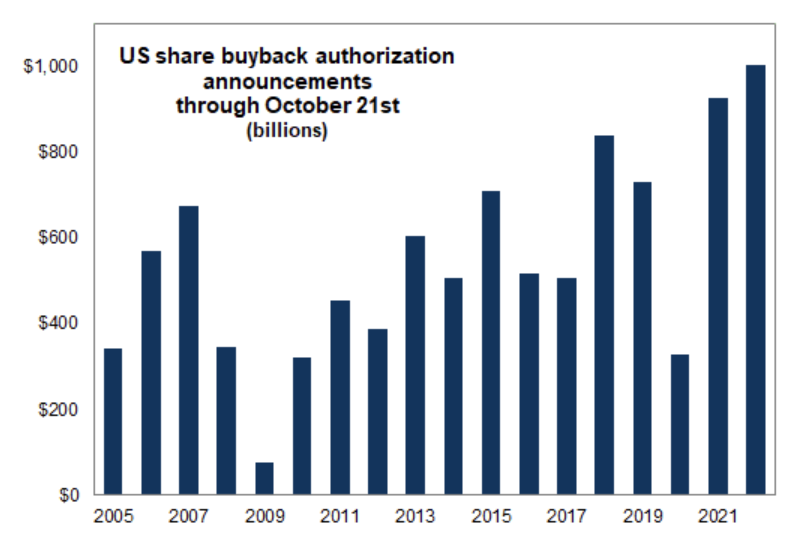
Stock Buybacks 'machine' via GS turn on 10/31 ahead of any ~1% tax changes:
Sign of a healthy/healthier market/rally vs June ? % of S&P500 stocks Up/Down when S&P Up/Down (Source: Nomura):
Have you wondered: what is the number of months in 2022 that the S&P 500 has been UP or DOWN at least 7.5%?
👉 5 times! Not much, a lot, an outlier ?
👉 Well, that is the most (at par) since 1937! That is since pretty much everybody started investing & trading. One more occurrence in November/December and we have one for the history books in 2022 ... let that sink in!
👉Choppy market, trying to time it ? Source: GIR
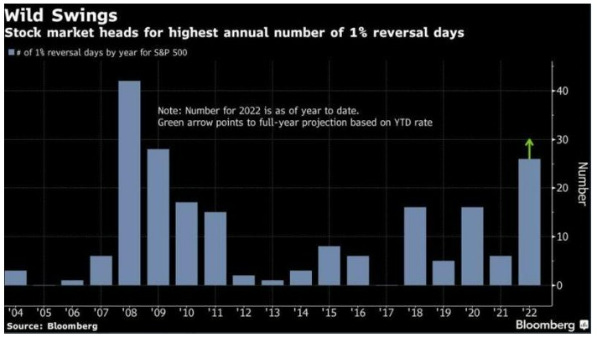
Curious about 1% intra-day reversal days? 2022 setting up to be the year with the most swings of this type since 2008
How about we connect that now with the ‘Capitulation’' story count via Bloomberg ? Note the Covid 2022 spike while also the bigger spike during the summer of 2022 while currently fading … maybe aiming for a Christmas relief rally ? Complementary, as reporter Jamie Gordon pointed: Moral of the story, go long whenever us journos get round to saying a capitulation has started … ;))
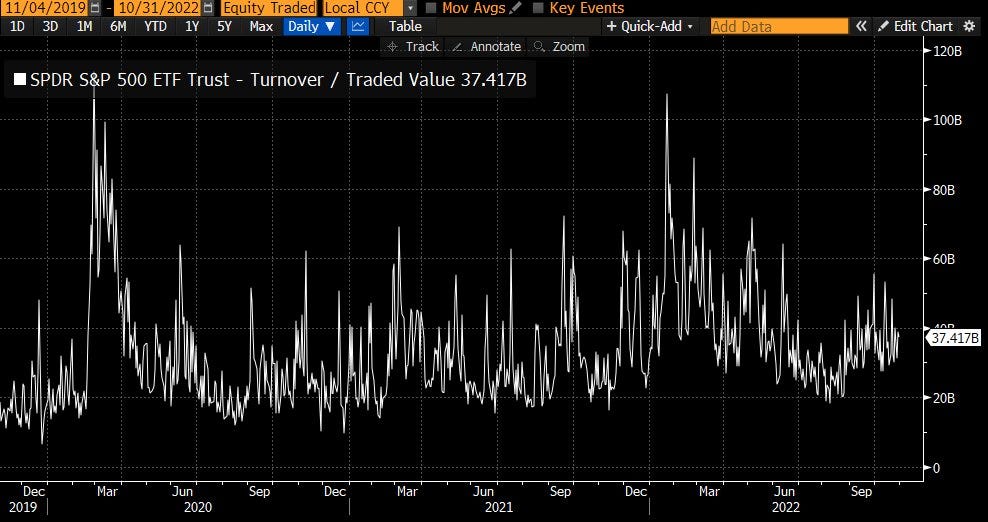
How about the S&P 500 turnover / traded value via Bloomberg? Note the Covid 2020 spike while in 2022: Q1 with a massive spike while now rising again
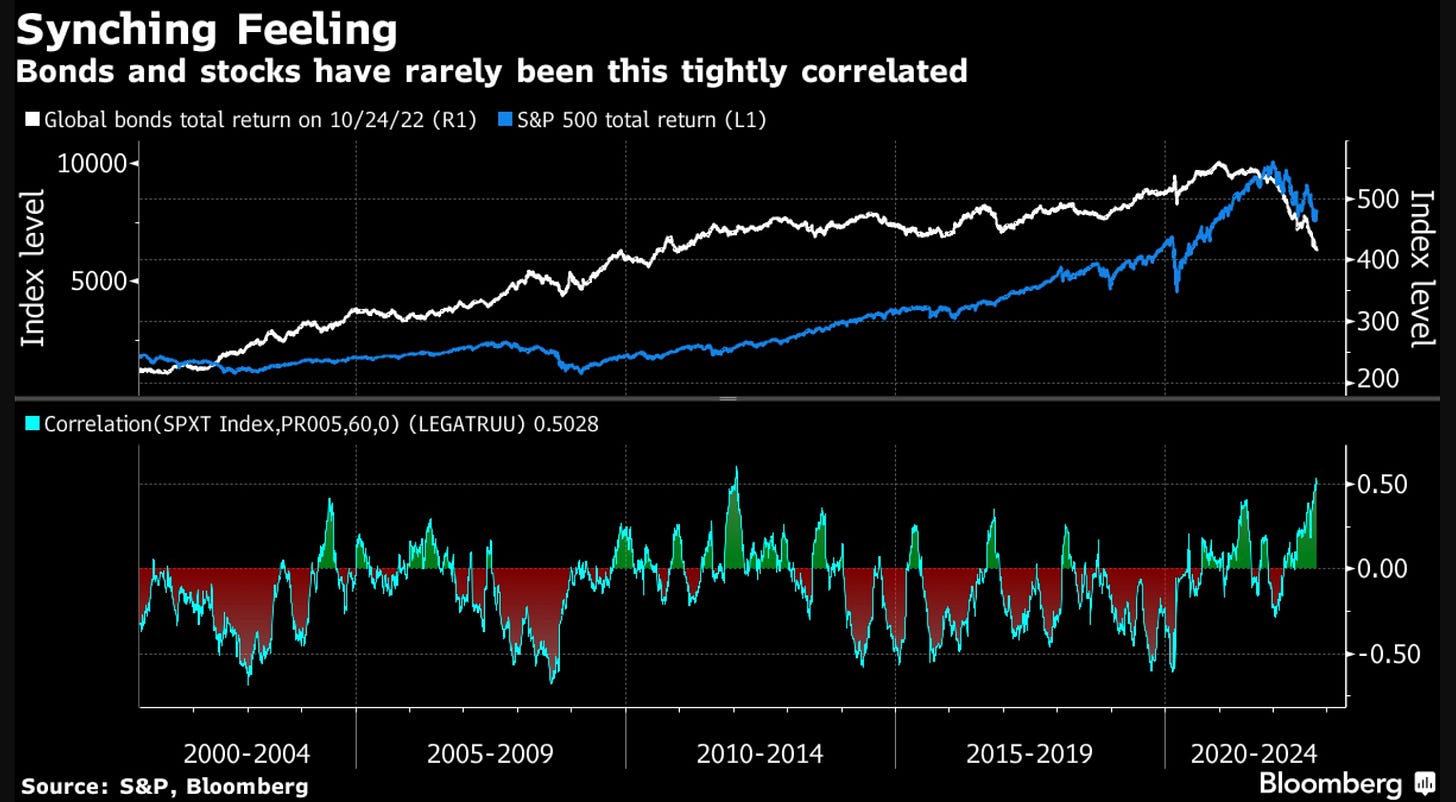
How about the S&P 500 return correlation with bonds ? In 2022 Global Bonds & the SPX recorded one of the tightest correlations compared to the last 20 years:
👍 Bonus charts 👍
Have you ever wondered the contribution of profits each sector from the 11 has to the S&P 500 index overall & the evolution in time? There you go with a freshly updated chart from 1976 to Sep 2022: Tech leading with 22% while Utilities & Real Estate with 2% on the other side. Q3 earnings for Tech was quite bad, will this share decline going forward or a temporary blip ? Food for thought …
Complementary, what are historically since 1965 the largest industry weighting of the top 5 stocks in the S&P 500? There you go & note that FAAMG are back to 2018 levels:
Who owns the US stock market by investor type ? 2 main takeaways:
👉market is structurally net long = tailwind, put that into memory as an investor …
👉what hedge funds do and related headlines/eye-balls click baits etc are not relevant in the bigger picture ...
Did you enjoy the S&P 500 deep-dive? Do you have questions, feedback or a custom request for a chart? Would be great to hear, hence just comment or reply to this email. I aim for future reports to improve even further, save you precious time and bring you valuable additional insights.
What would help a lot from your side? Very easy, just spread the word around & share this with people that might also be interested into this coverage.
Have a great day!
Maverick Equity Research




























Great article with fantastic charts and lots of good insights!
Awesome stuff in my inbox Mav! That SPY chart with the 3 variables each for a floor & ceiling is pure gold! Your research, commentary & charts are insightful & beautiful ... humor also :P ... unique report indeed, thanks! I will spread the word around right now!
2 questions please:
1) when will you do a full equity research piece? Too much growth/tech coverage around, value is back indeed, pick something from that space to start with ... just my suggestion ...
2) can you do on top also a technical analysis on the SPY?
Thank you!