✍️ S&P 500 Report: Valuation, Earnings & Fundamentals + Special Metrics #Ed 5
Breaking down the S&P 500 & the 11 Sectors via Sleek Charts - Edition #5
Dear all,
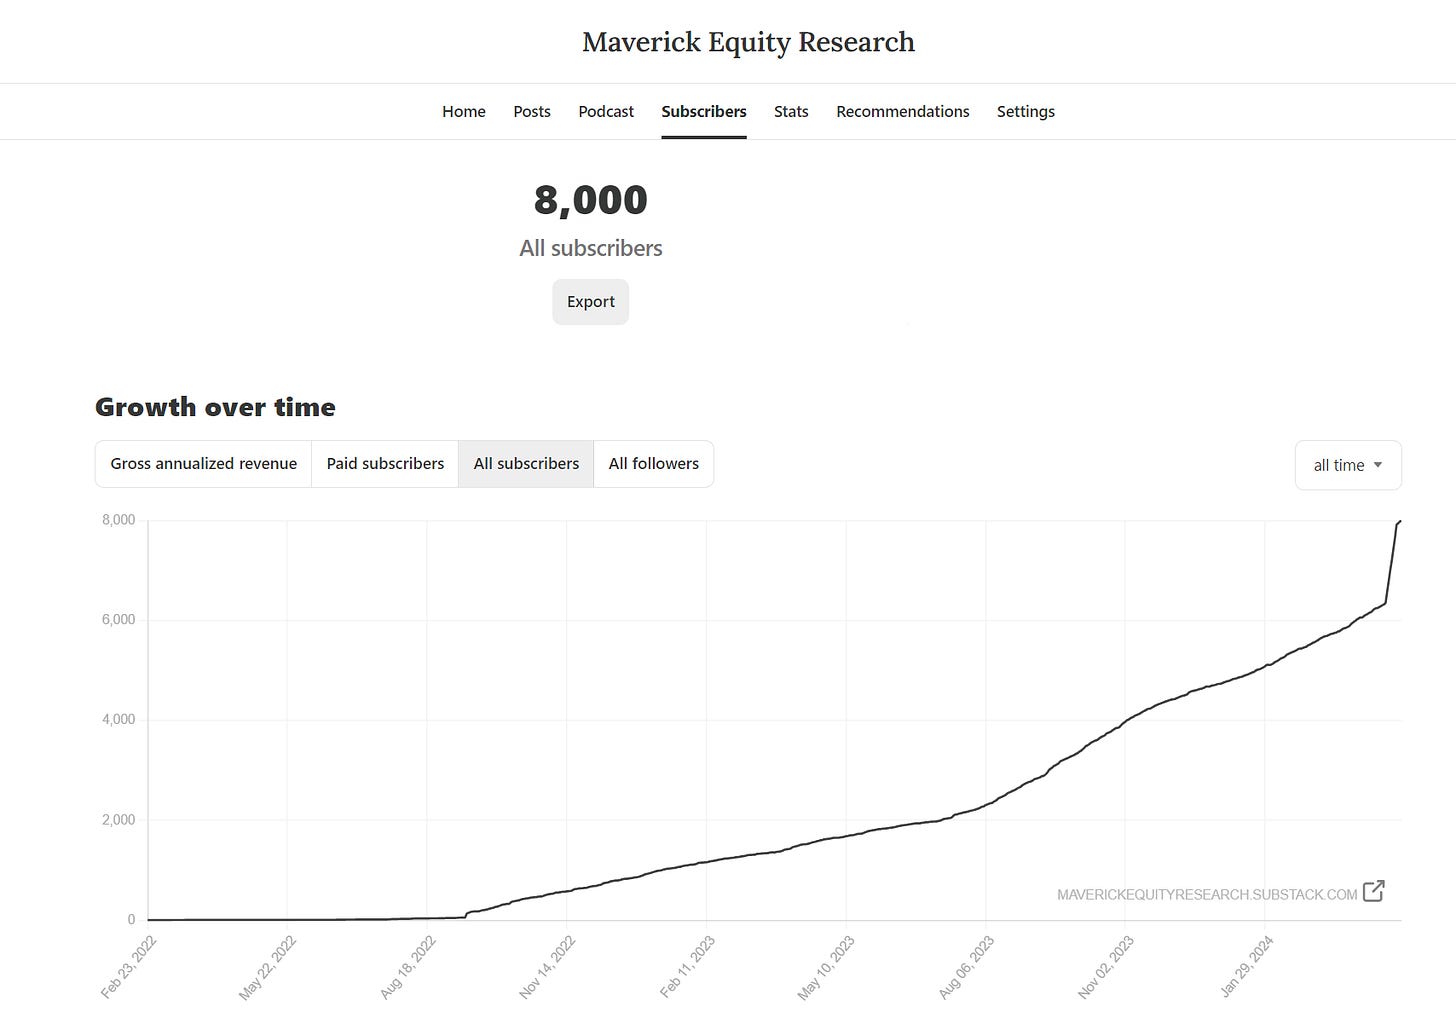
first of all, welcome to the +800 new readers for a total of 8,000! The independent investment research here is now read across 145 countries and 50 US states! Enjoy!
Second of all, Happy International Labour Day! A moment to recognize & appreciate the hard work, consistency and achievements of all men and women across the globe!
"All labour that uplifts humanity has dignity and importance and should be undertaken with painstaking excellence." — Martin Luther King Jr. —
"A hundred times every day I remind myself that my inner and outer life depend on the labours of other men, living and dead, and that I must exert myself in order to give in the same measure as I have received and am still receiving." — Albert Einstein —
"Without labour nothing prospers." — Sophocles —
From my side:
wishing you a well-deserved break and relaxation on Labour Day, as you recharge and prepare for your new ventures and projects ahead!
also a moment of kudos to you given that you likely save money, which = you pay yourself first, and invest which = the leverage that makes compounding work!
And now welcome to the ✍️ The S&P 500 Report: Valuation, Earnings & Fundamentals + Special & Alternative Metrics, a unique report via data driven research and visually appealing charts that simply tell 10,000 words!
A quarterly report given it’s comprehensive nature & fits well with both Bottom-Up & Top-Down approaches. Delivers a great overview via many angles for many use cases. If you know a better and comprehensive S&P 500 coverage (free or paid), let me know!
N.B. in case you missed the sister report with complementary coverage, there you go:
✍️ The S&P 500 Report: Performance, Profitability, Sentiment & More
Research is NOT behind a paywall and NO pesky ads here unlike most other places!
What would be appreciated?
Just sharing this around with like-minded people, and hitting the 🔄 & ❤️ buttons! That’ll definitely support bringing in more & more independent investment research!
A perfect time for another S&P 500 deep dive as we are into the deep part of the Q1 2024 earnings. Structured in 4 parts + bonus charts & designed to have a natural flow:
📊 S&P 500 Index Overall Valuation: P/E, FCF yield, P/S and sleek scatterplots
📊 Earnings & Fundamentals: actual earnings & expectations, fundamentals & more
📊 The 11 Sectors Valuation Breakdown: relative valuation, Mag 7 and scatterplots
📊 Special & Alternative Metrics: food for thought via sleek and intriguing charts
👍 Bonus Charts 👍
📊 S&P 500 Index Overall Valuation: P/E, FCF yield, P/S and sleek scatterplots
👉 Forward PE ratio (blue) = 20.7x
Buy it Low Sell it High fundamental metric, complementary context and insights:
Compared to historical averages, we are trading above via the current bull market:
20-year (grey) = 16.4x, 10-year = 18.6x, 5-year = 20.0x, 3-year = 19.6x
Relative to standard deviations +/- 1, +/- 2, check when we trade at extreme values:
we are above the +1 SD (orange) 19.3x, yet below the +2 SD (red) 22.2x that says overvaluation: the 2020-2021 excess shows that quite clearly = sell signals
-1 SD (light green) 13.5x which signalled the 2020 Covid bottom, while the crazy -2 SD (dark green) 10.6x which happened in 2008 and 2012 = strong buy signals
During recessions via the red bars:
the cheapest/bottom P/E happens while we are still in a recession, hence that is the time to buy! Yet, so many sell at the bottoms, mark losses via fear, no plan ...
once out of a recession, the P/E is already at the 20-year average at a minimum (like in 2010 after Lehman), if not +1 or +2 SD as in the 2020 Covid strong rebound
Maverick take-aways - this P/E view is simple yet important and a strong gauge:
the signal is very strong when we have a stock market correction: at -1 SD and even more at -2 SD I would be a buyer!
while when we have euphoria, especially when we got close or even above the +2 SD, it is a strong signal of overvaluation
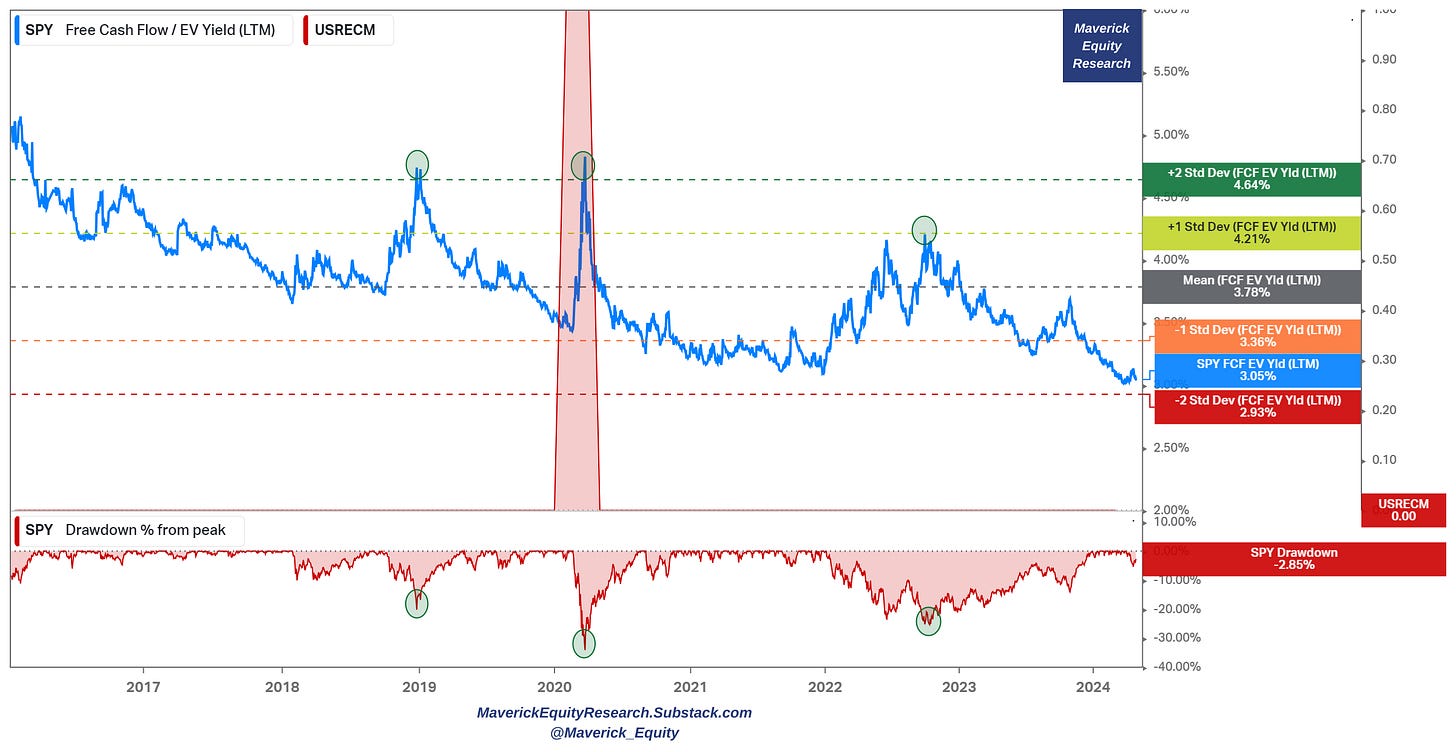
👉 Free Cash Flow Yield (blue) = 3.05%
Buy it High Sell it Low kind of fundamental metric (hence also the change of colors), complementary context & insights, and I also added the drawdowns at the bottom (red)
Relative to standard deviations +/- 1, +/- 2, check when we trade at extreme values:
we are below the -1 SD (orange) 3.36%, and also not far from the +2 SD (red) 2.93% which would indicate a strong overvaluation, hence call for caution
note how when we touched the +1 SD (light green) in 2022 it was a good sign of cheapness, while the +2 SD (dark green) during the 2020 Covid panic was a great time to buy (similar during the 2018 stock market drawdown)
Maverick take-aways - this FCF yield view is simple yet important and a strong gauge:
the signal is very strong when we have a stock market correction: at +1 SD and even more at +2 SD I would be a buyer!
while when we have euphoria, especially when we got close to the -2 SD it is a strong signal of overvaluation
Free Cash Flow Yield over Market Cap (above over Enterprise Value EV) = 3.75%
similar ways to look at it and interpret for likely current over or undervaluation
N.B. I prefer the FCF yield with over EV metric vs market cap alone, with EV debt is counted in and cash is subtracted (S&P 500 is quite cash rich), both good in any case
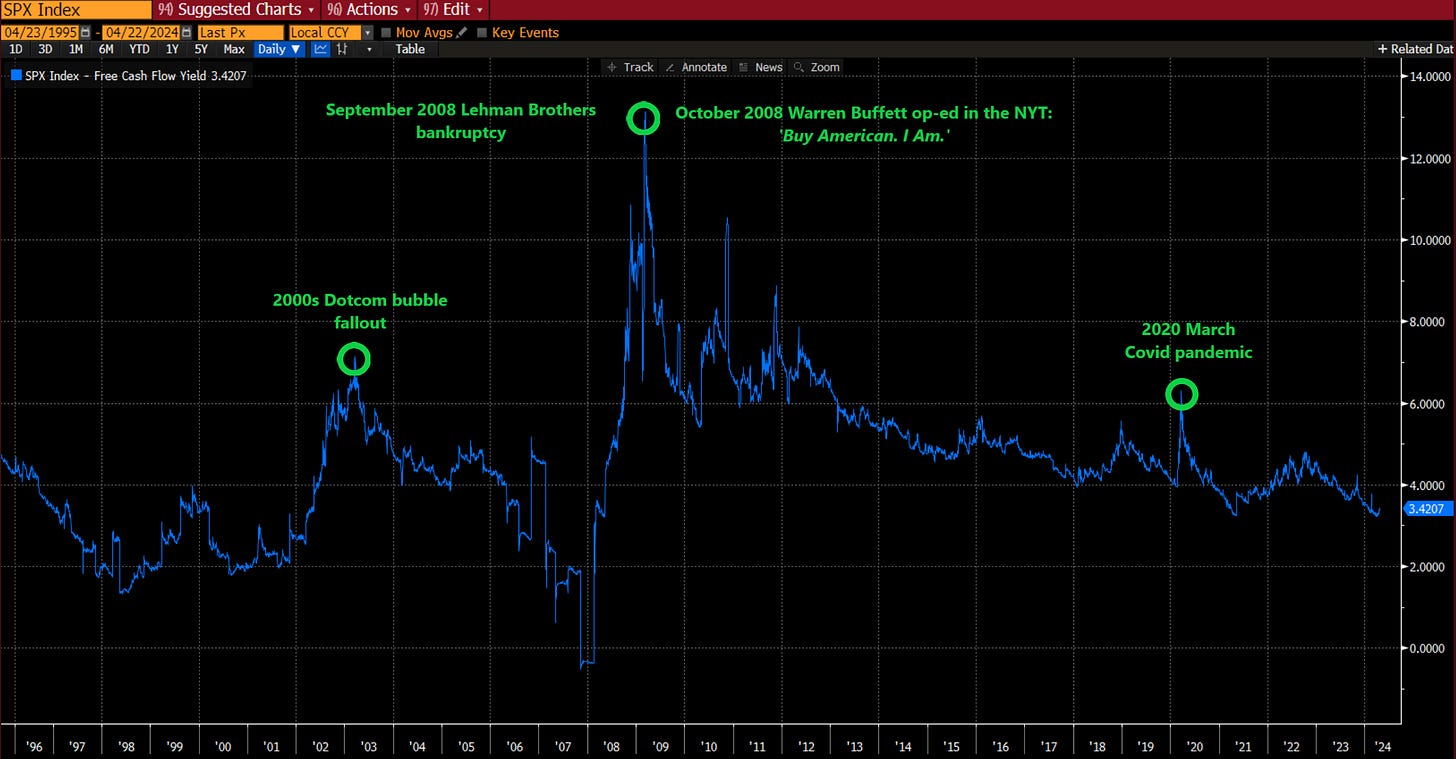
Zooming out via the Free Cash Flow Yield from 1995-2024:
2002 Dotcom fallout: shot above 6% when the S&P 500 reached its 49% maximum drawdown
Lehman collapses in September 2008, while Buffett shortly after in October says 'Buy American. I Am.' in a New York Times op-ed as the FCF yield was above 10% … let that sink in .. and bring the sink if you wish …
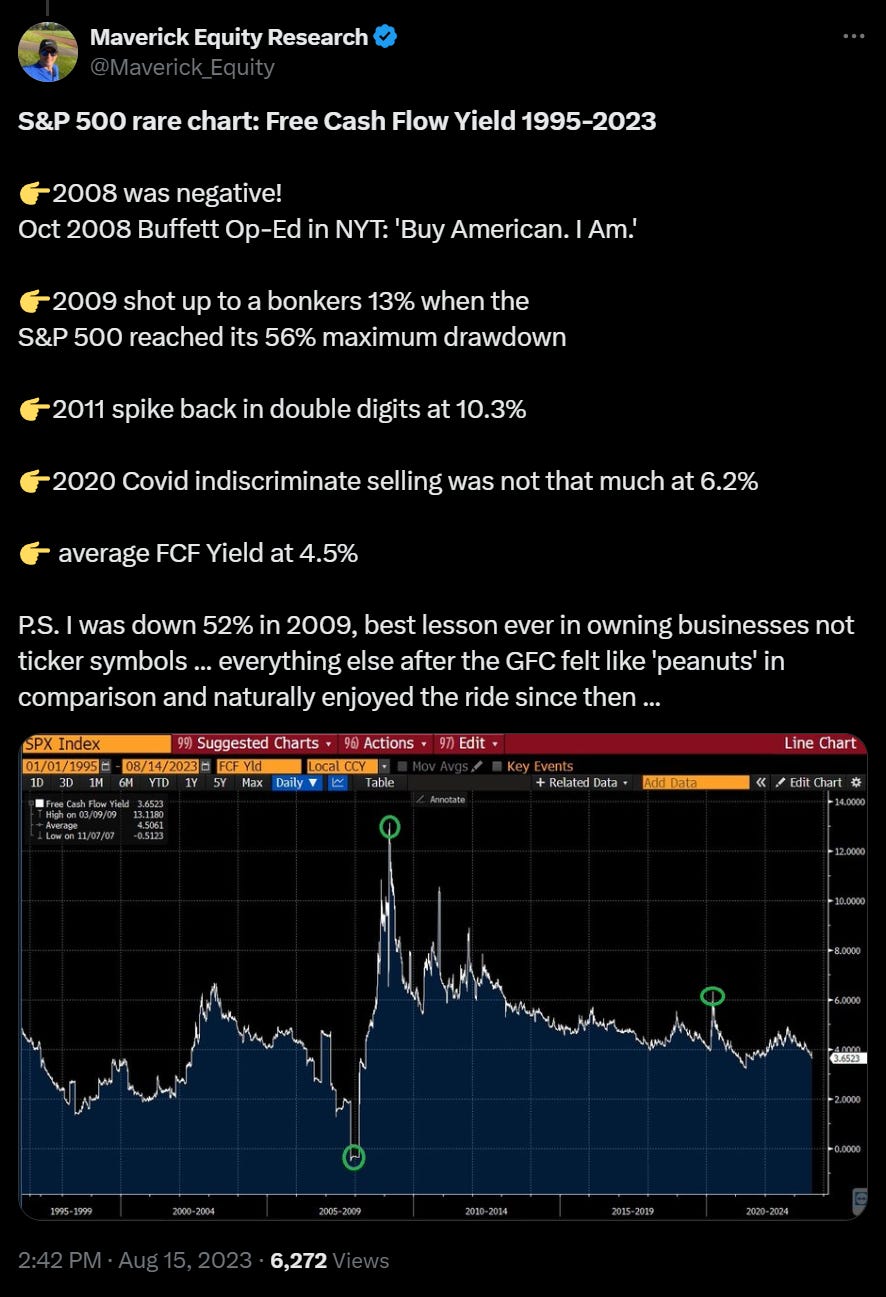
2009 FCF yield shot up to a bonkers +13% when the S&P 500 reached its 56% maximum drawdown … now those were quite some crazy times …
2020 Covid: shot above 6% when the S&P 500 reached its 34% maximum drawdown
P.S. I was down 52% in 2009, best lesson ever in owning businesses not ticker symbols: everything else after the 2007-2009 GFC felt like 'peanuts' via a direct comparison …
Free Cash Flow yield: Buy it High Sell it Low gauges aka rules of thumb:
at 6% it is already good to be a buyer …
at +10% it is like 1 or 2 times in a generation ...
Complementary, my twitter post from 2023 on the FCF yield + context:
👉 P/S ratio (white) currently = 2.73x
below the 2020-2021 mania highs
whenever this goes to below 2x, I would get very tempted to buy … let alone if it ever goes below 1x like in the 2007-2009 GFC, temptation senses would be all over
N.B the correlation with bank reserves (blue), we can say that liquidity matters …
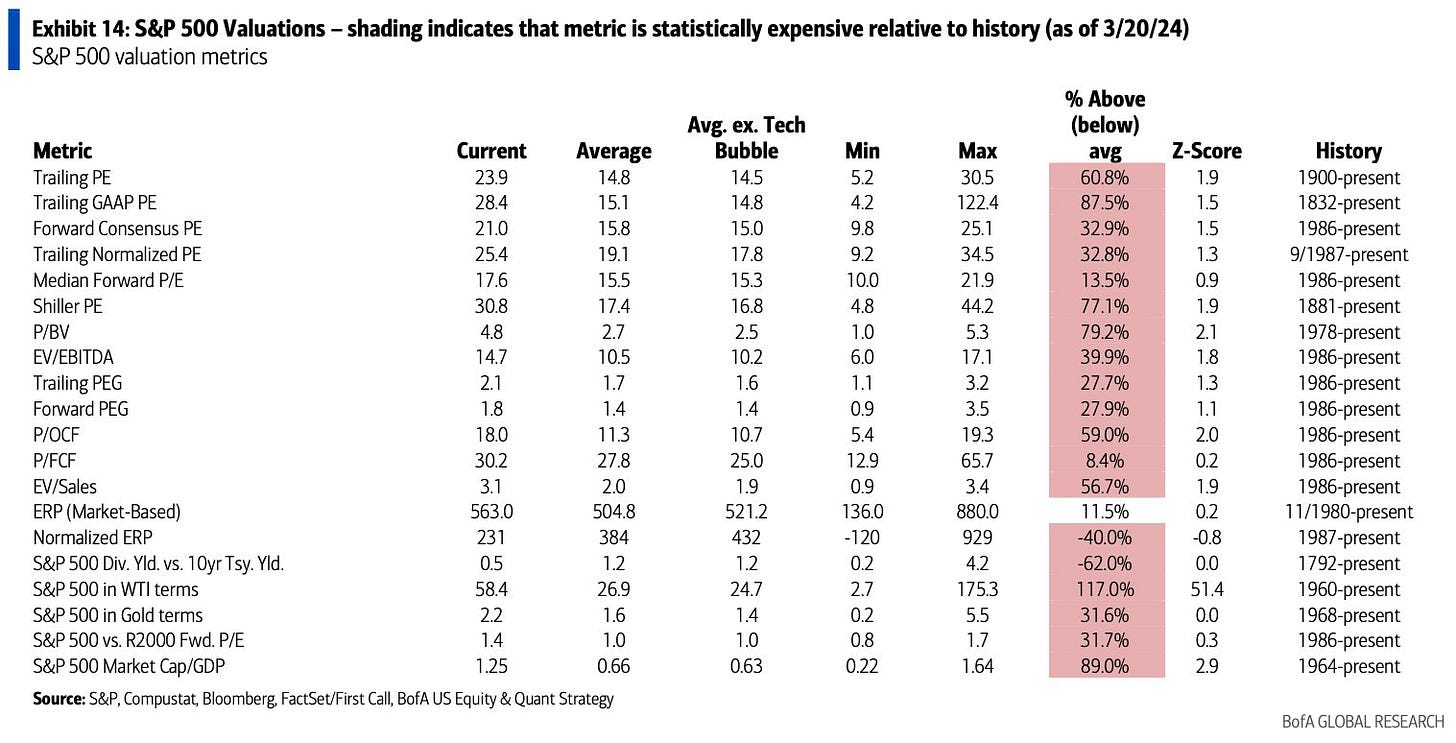
👉 S&P 500 comprehensive statistical valuation metrics via Bank of America:
except the ERP - Equity Risk Premium (market based), relative to historical average values, the S&P 500 is expensive statistically speaking
a general simple note, given that lately we are hovering around all-time highs, that is to be expected … and the more the economy evolves and the S&P 500 performs, the statistical relationship will keep holding …
hence, this is rather a complementary way to connect one’s dots …
👉 Now that we looked at the index level, let’s get granular & dive deeper inside the index via the single stocks that shape the S&P 500 index.
How = via sleek ‘2D’ scatterplots
Mission = chasing outliers, positive/negative momentum, over/under valuation:
P/S multiple with Revenue growth (next year estimates) for a ‘Top-line’ view. Interpretation: forward P/S multiple the stock is trading for the given estimated Sales growth - a rule of thumb: one aims to pay a low multiple for high growth
Nvidia (NVDA) and Super Micro Computer (SMCI) quite some outliers …
Complementary here: the percentile of each stock’s forward P/S ratio vs their 10-year history coupled with the total return in the last 3 years (quite a Maverick-esque visual which you do not see around)
Micro Computer (SMCI) was excluded as it was distorting the chart big time: a +2,200% 3-year return, and naturally at a 99th percentile P/S - let that sink in!
quite some names trading at their +90th percentile P/S
use case: spotting names that did return well, yet not at a very high P/E 10-year percentile is one way to look - check your top names and connect the dots …
P/E multiple with Earnings/EPS growth (next year estimates), a ‘Bottom-line’ view.
Interpretation: Forward P/E multiple the stock is trading for the given estimated Earnings growth - a rule of thumb: one aims to pay a low multiple for high growth
Illumina (ILMN) looking very expensive via this single view …
Complementary here: the percentile of each stock’s forward P/E ratio vs their 10-year history coupled with the total return in the last 3 years (quite a Maverick-esque visual which you do not see around)
use case: spotting names that did return well, yet not at a very high P/E 10-year percentile is one way to look - check your top names and connect the dots …
Micro Computer (SMCI) was excluded as it was distorting the chart big time: a +2,200% 3-year return, and naturally at a 99th percentile P/E - let that sink in!
Nvidia (NVDA) off the chart almost …
P/FCF multiple with FCF/Share (last twelve months) for a ‘Cash Flow’ view.
Interpretation: P/FCF multiple the stock is trading at for the given level of FCF/Share - a rule of thumb: one aims to pay a low multiple for high FCF/share
Tesla (TSLA) a big outlier via this single view …
Check also Lockheed Martin (LMT) …
Complementary here: the percentile of each stock’s P/FCF ratio vs their 10-year history coupled with the total return in the last 3 years (quite a Maverick-esque visual which you do not see often around).
use case: spotting names that did return well, yet not at a very high P/FCF 10-year percentile is one way to look - check your top names and connect the dots …
quite some outliers here both on the negative and positive side
Nvidia (NVDA) off the chart almost …
Maverick take on the current S&P 500 valuation overall:
we are not not overvalued nor undervalued, about fairly valued … if I would have to choose binary from the two, the small tilt would go towards overvaluation now
key reminder: the market is structurally net long, hard to stop the moving train if you believe humanity and societies will evolve!
the latter is one key reason why I believe it is way easier to spot fear and bottoms, than greed and tops! Moreover, tops are rather like a process, whereas bottoms are rather events or a series of events and the metrics to spot it are more telling in these cases (e.g. the above P/E, FCF Yield interpretations to spot a bottom)
just need a cool head and income/cash during the tough periods to ride them out, and further more take the opportunity to buy great businesses cheaper!
📊 Earnings & Fundamentals: actual earnings & expectations, fundamentals & more
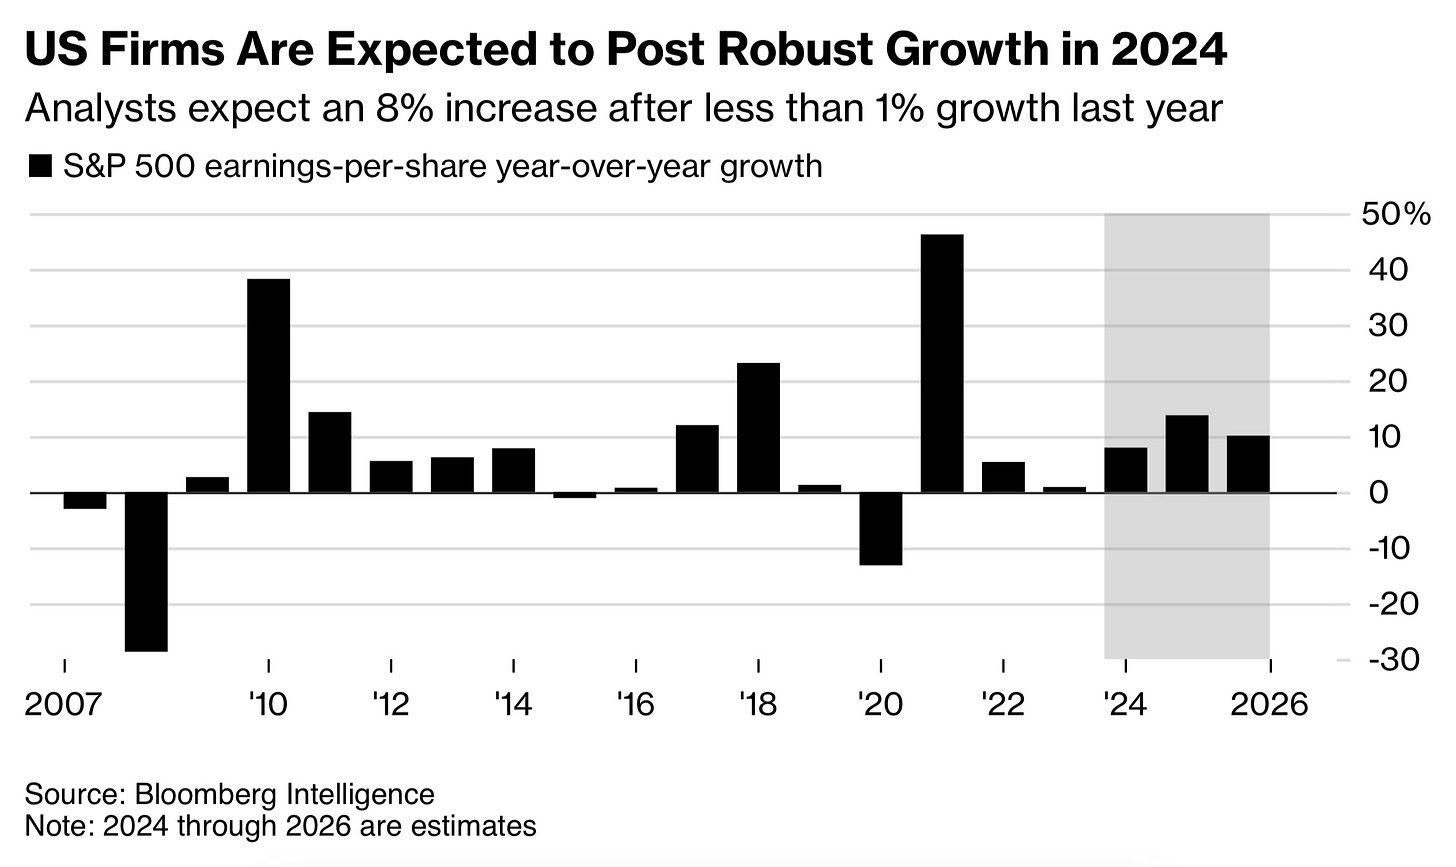
👉 Q1 2024 actual earnings scorecard:
revenue growth +4.5% (not bad at all ...)
earnings growth +3.9% (not bad at all either ...)
Earnings expectations:
👉 overall 2024 earnings expectations are high with a 8% growth after < 1% in 2023
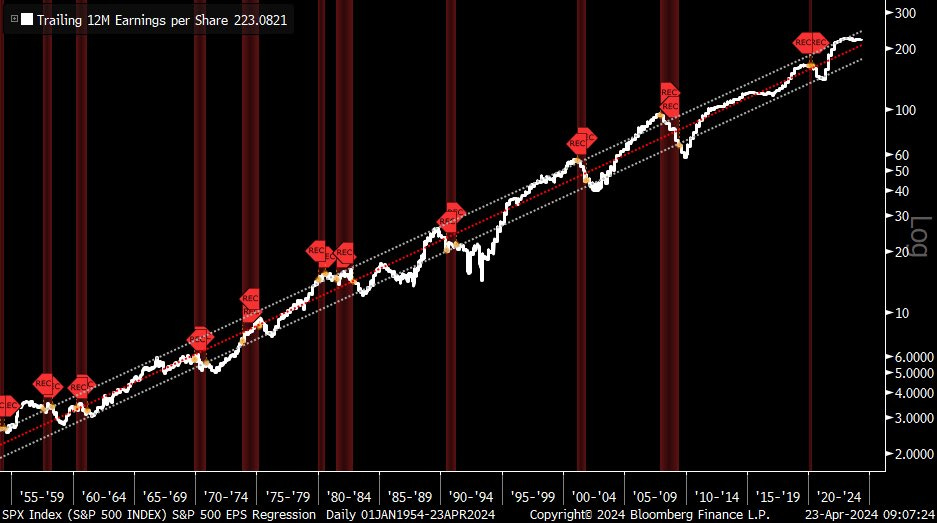
The long term trend of the Trailing 12-month EPS (earnings per share):
being close or even above the upper limit of the long-term trend indicated many times overstretching, hence expected mean reversion (see 2000 / 2007 recessions)
the same when we fall below the lower limit of the trend, it’s cheap & buy time …
We are not in any of the extreme bounds now, so it looks decent while the earnings season is young and evolving …
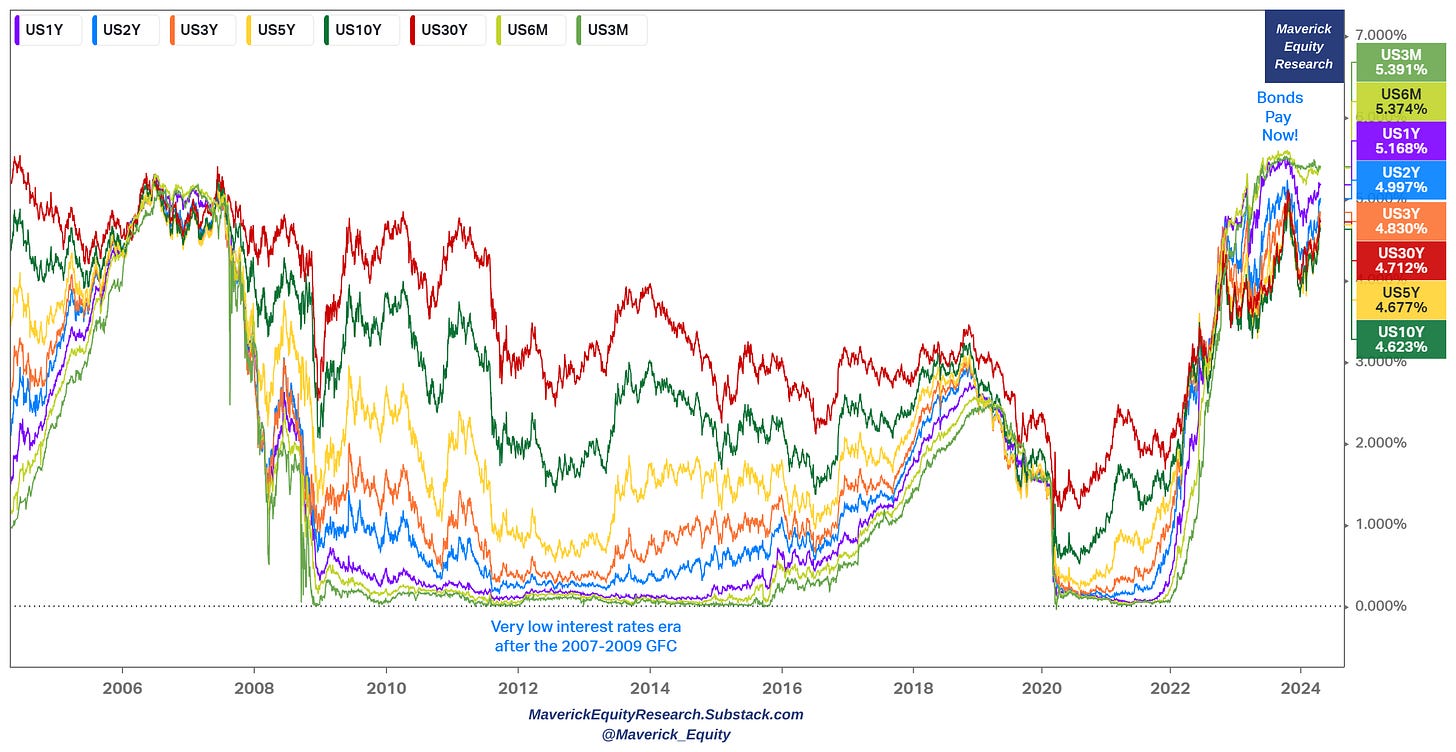
👉 ‘The Maturity Wall’ = the idea of the corporate interest expense and the risks that debt burdens will start to hit big time = quite a fear-mongering recurring theme since the US FED started in 2022 rising interest rates at the fastest pace in 4 decades.
👉 Current values for US yields, and like before, above even the 2007-2009 period
Chart - U.S. yields 3m, 6m, 1y 2y 3y 5y 10y 30y with a 20-year lookback period:
Nonetheless, how about ‘The NON-Maturity Wall’?
👉 most S&P 500 companies have negotiated fixed rates ... and less than 10% will need to be refinanced in 2024 ...
👉 despite all the rate hikes of 2022 and 2023, the interest rates paid by the biggest US concerns are PEANUTS, barely off the bottom and around all-time record lows
👉 With the interest rates hiking cycle pretty much done and hovering around the top, it’s effect is NOT transmitted to the balance sheet of the S&P 500 companies. Not only many took debt with fixed rates, but also the overall debt levels are LOW!
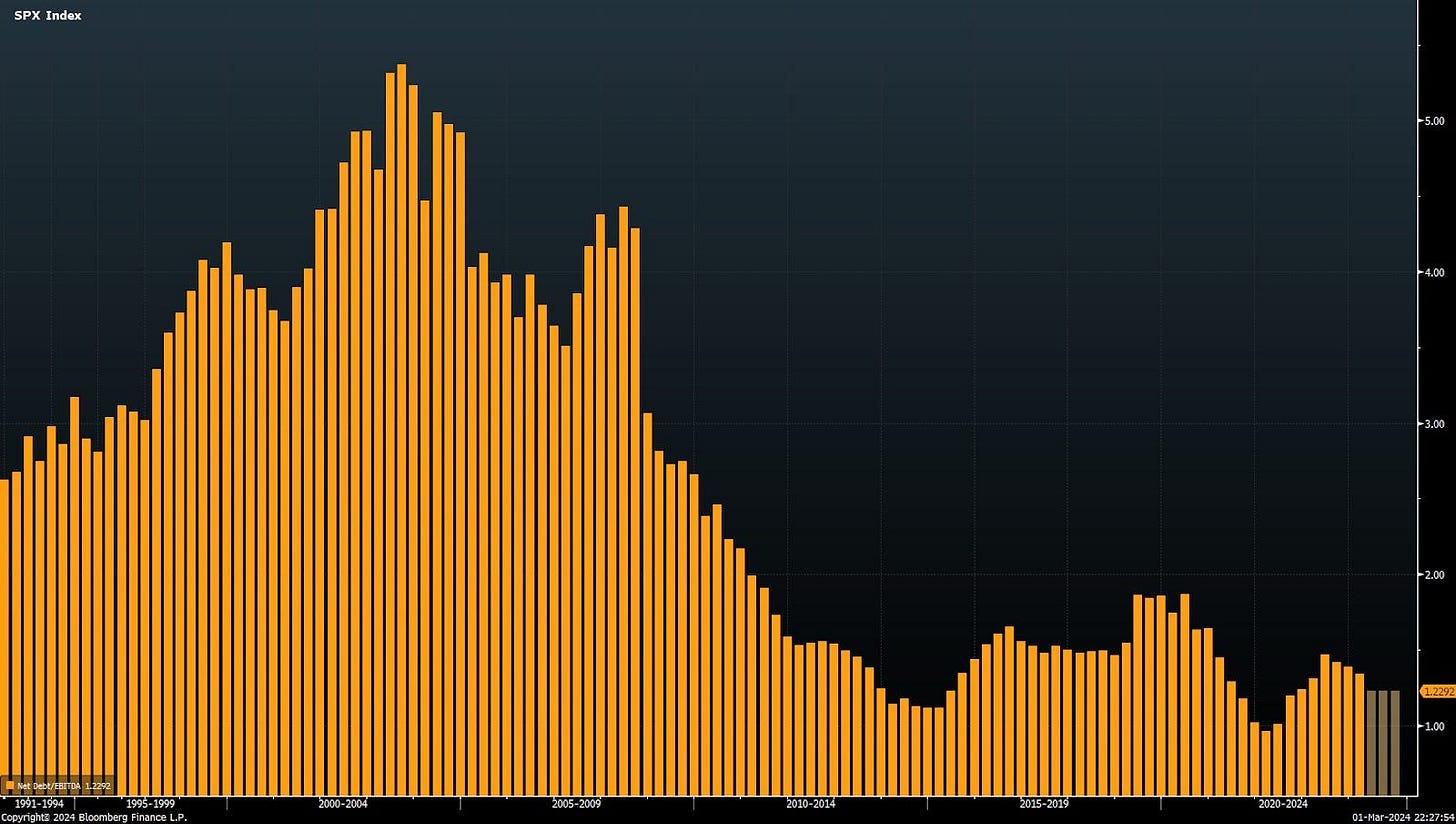
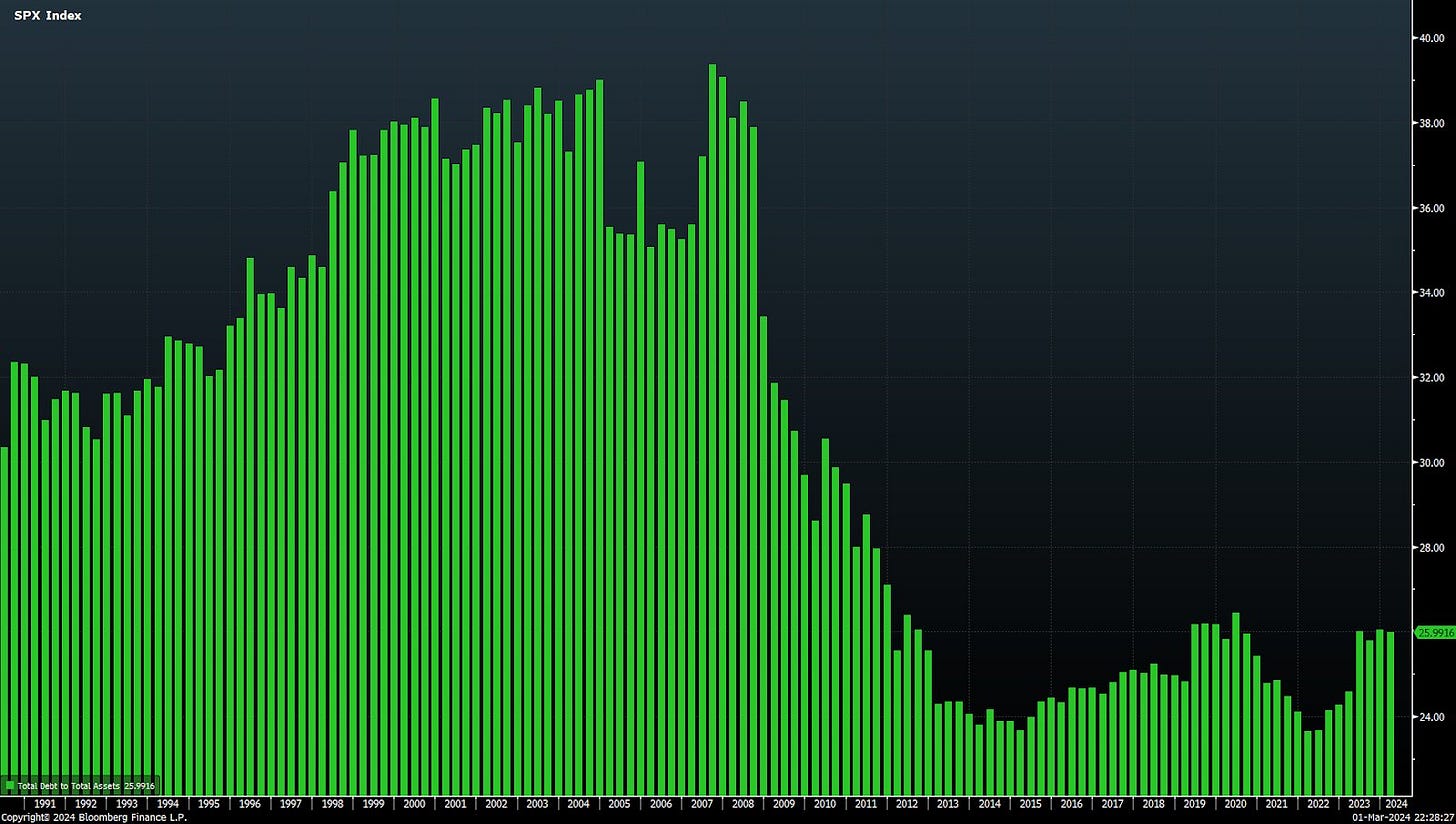
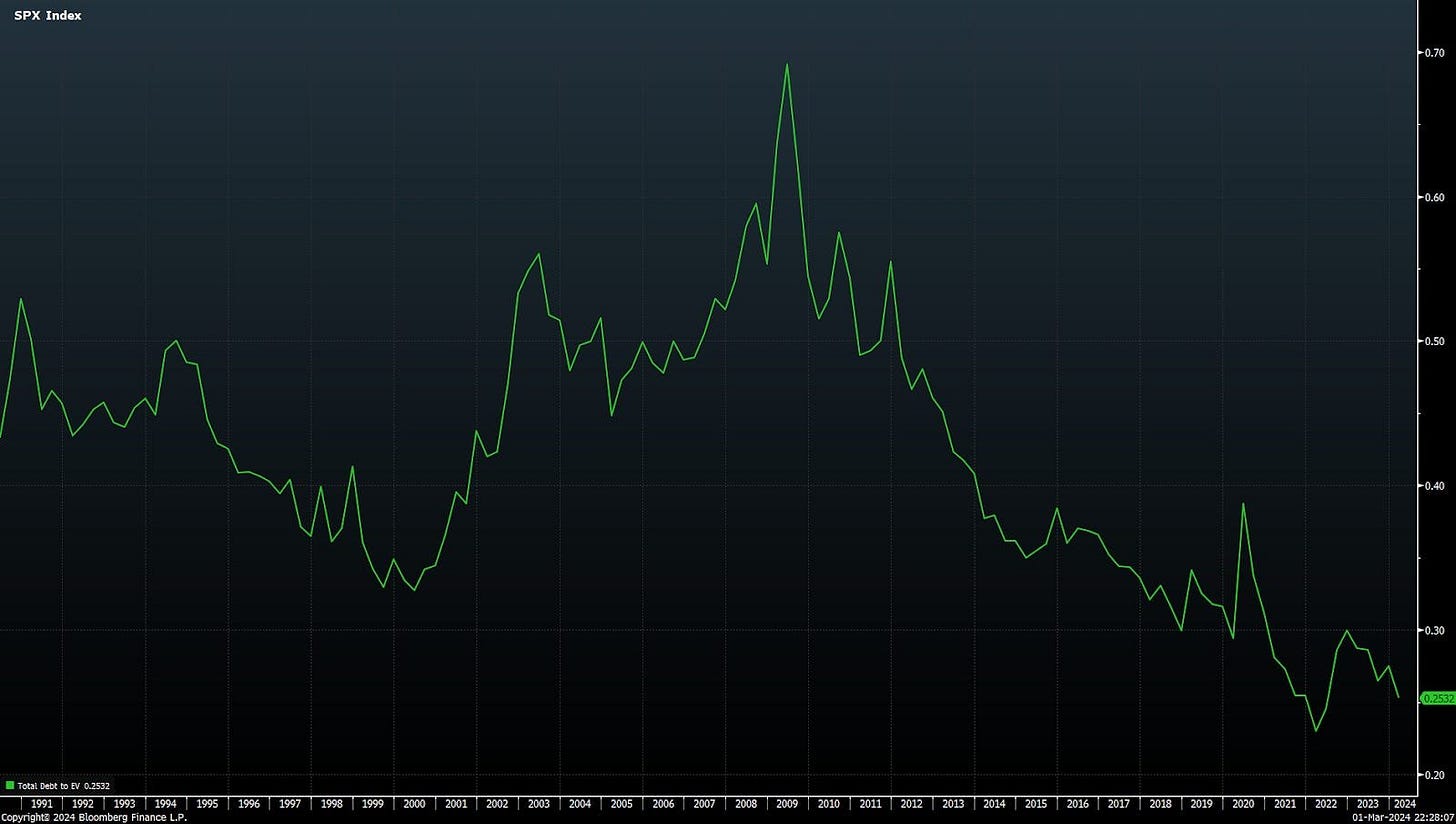
Talking is easy & cheap, doing with data, chars and insights is expensive. Hence, let’s check the (safe) balance sheet of the S&P 500 companies:
Net Debt / EBITDA at one of the lowest points historically … let that sink in!
Total Debt to Equity guess what? Sends the same safe balance sheets message
Total Debt to Total Assets - same …
Last but not least, Total Debt to EV (Enterprise Value) with the same message
📊 The 11 Sectors Valuation Breakdown: relative valuation, Mag 7 and scatterplots
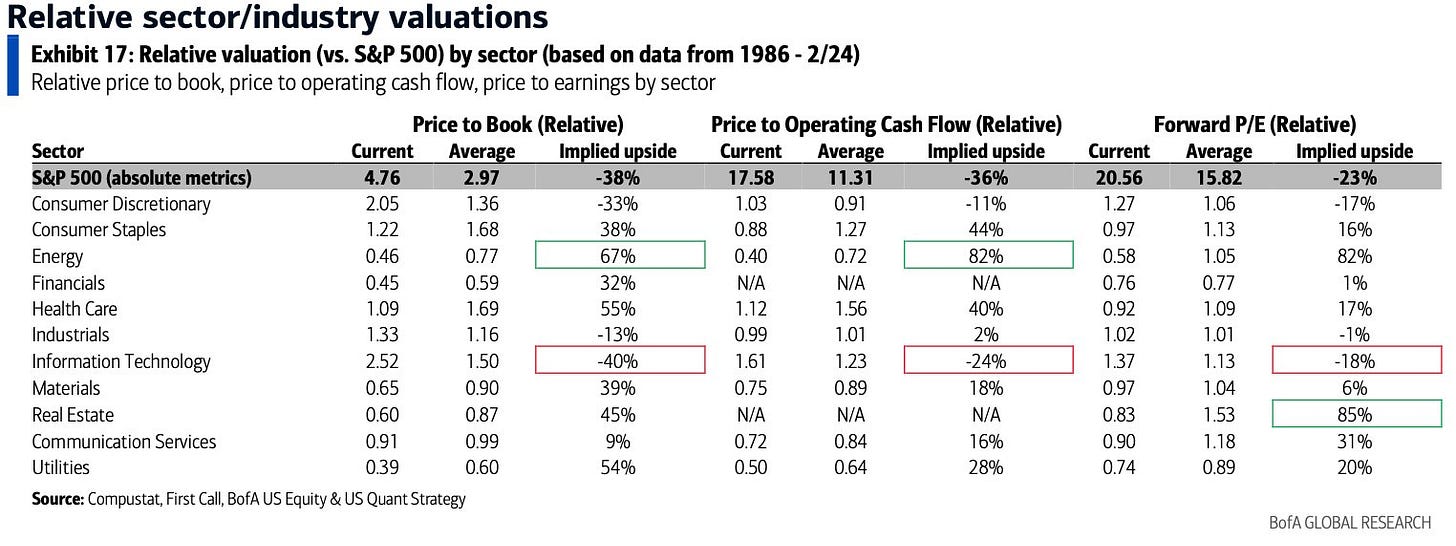
👉 Relative valuation - the 11 sectors VS the S&P 500 overall: via Price/Book, Price/Operating Cash Flow and Forward P/E (each multiples with it’s pros and cons for each individual sector as a representative metric). Have a look for:
the 'cheap' side: energy, real estate and utilities
the 'expensive' side: technology & consumer discretionary
👉 On the mighty tech, a dedicated special chart: valuations over the past 35+ years!
Tech valuations = well BELOW both post-Covid & Dotcom bubble peaks, forward P/E:
BigTech (dark blue): trading at 29x P/E versus the 2000s DotCom 62x P/E, while above the 22x median
Software excluding Big Tech (green): trading at 31x P/E versus the 2000s DotCom 70x P/E, while above the 21.8x median
Hardware + Semiconductors excluding Big Tech (light blue) trading at 20x P/E, versus the 2000s DotCom +75x P/E, while above the 15x median
👉 On the mighty tech, a dedicated special one for the Magnificent 7 ‘Mag 7 group
Magnificent 7 stocks trade at way higher forward P/Es: from 23.5x for Google to 52.9x for Tesla, hence pulling up materially the 20.7x S&P 500 overall average
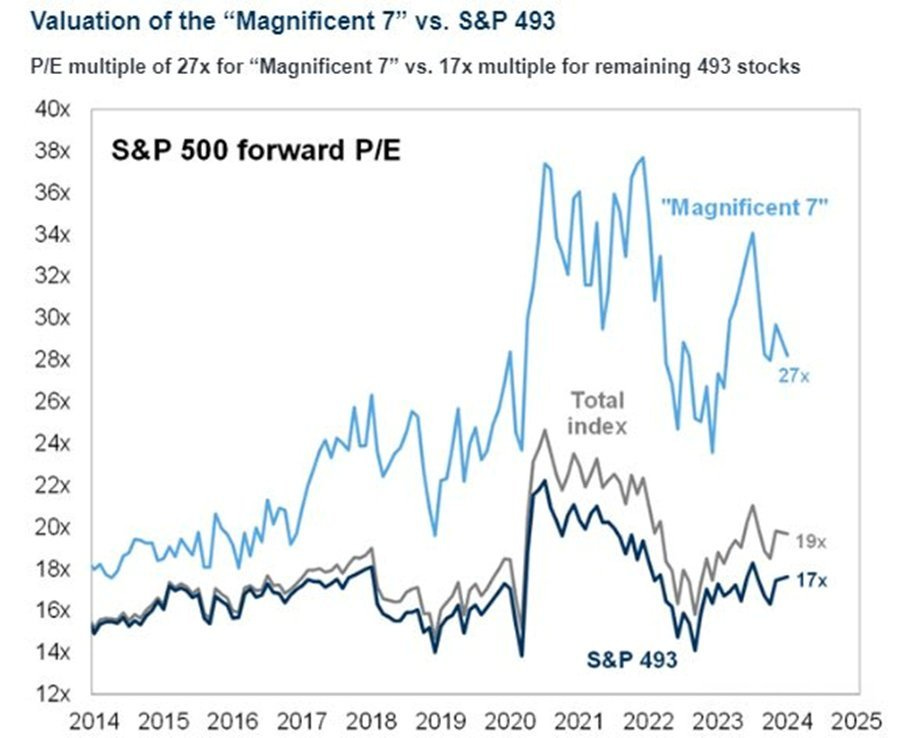
Complementary - the S&P 500, S&P 493 and the Magnificent 7 via forward P/E:
Mag 7 with a 27x average
S&P 493 at 17x, hence one can say that the S&P 493 might not be expensive now
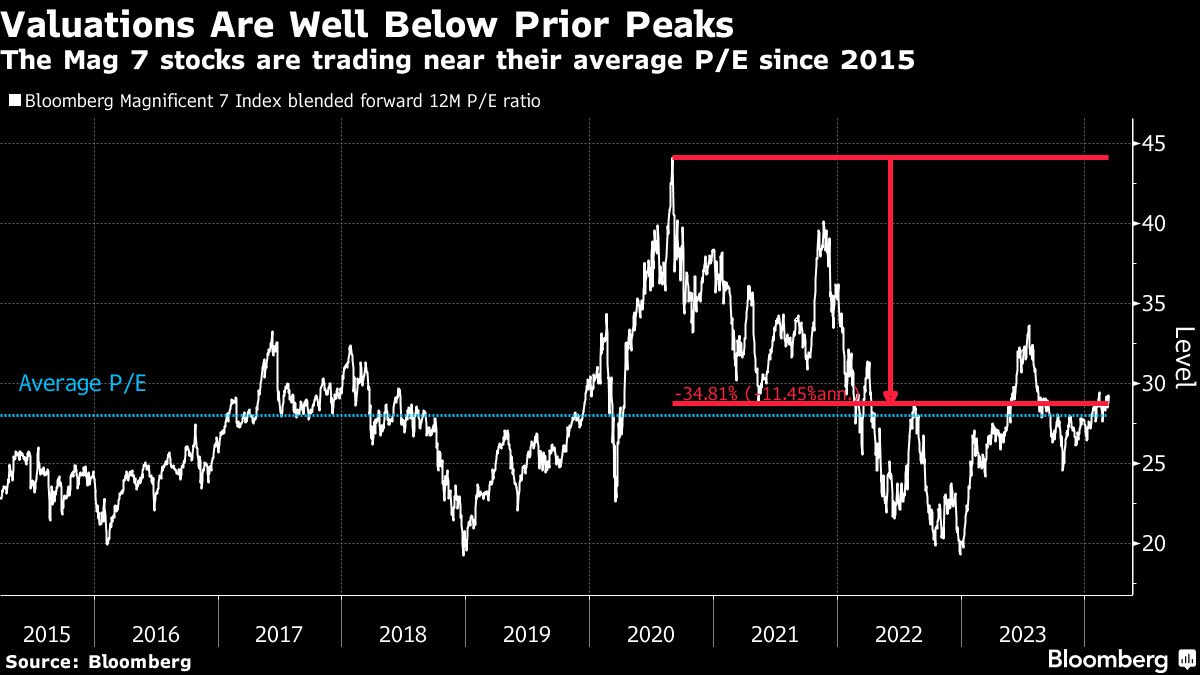
Given the high 27x P/E values for the Mag 7, does it mean themselves are overvalued?
not necessarily, actually they are just trading near their average value since 2015
Now let’s get granular and dive deeper inside the sectors via the single stocks that shape each of the 11 indices!
Mission = chasing outliers, checking own names and connecting many own’s dots
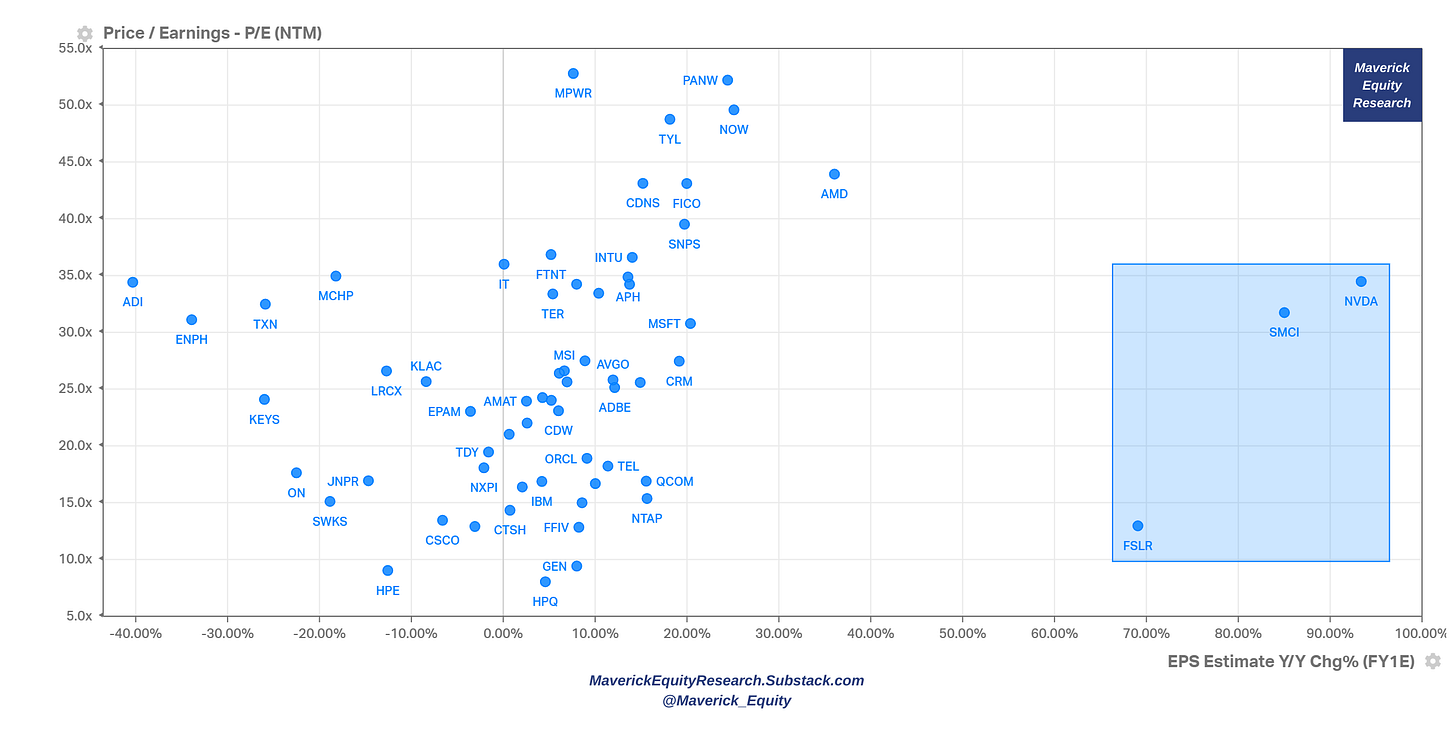
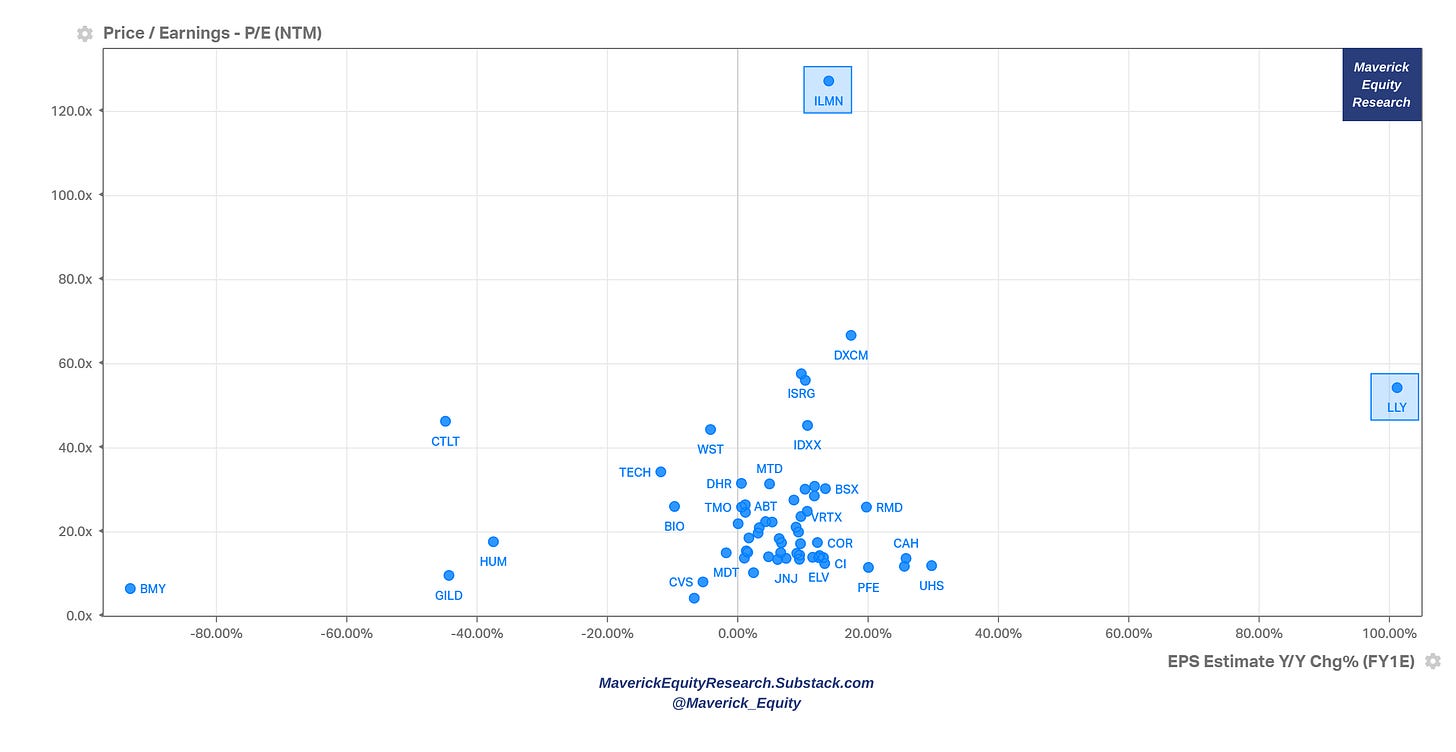
How? Via sleek scatterplots: the forward P/E multiple with Earnings/EPS growth (next year estimates) for a ‘Bottom-line’ view
Interpretation: Forward P/E multiple the stock is trading for the given estimated consensus Earnings/EPS growth
A simple rule of thumb: one aims to pay a low multiple for relatively high earnings growth, and/or check how justified a given multiple is for a given name
👉 XLK - Technology
(Nvidia) NVDA, Super Micro Computer (SMCI), First Solar (FSLR) the outliers …
👉 XLC - Communications
Netflix (NFLX) not chilling at all here … nor Facebook (META) & Google (GOOGL)
👉 XLY - Consumer Discretionary
highlighting Tesla (TSLA), AirBnb (ABNB), Amazon (AMZN) and especially GM
👉 XLE - Energy
highlighting Buffett’s Occidental Petroleum (OXY), Exxon (XOM), Chevron (CVX)
👉 XLRE - Real Estate
highlighting the popular among retail Realty Income (O), and CBRE Group (CBRE)
👉 XLF - Financials
first thing I always look here is Berkshire (BRK) and then Goldman Sachs (GS
check also now Visa (V), Master Card (MA), MCO (Moody’s), MSCI Inc (MSCI) and S&P Global (SPGI)
👉 XLV - Health Care
highlighting Eli Lilly (LLY) and pricey Illumina (ILMN)
👉 XLP - Consumer Staples
highlight the mighty Costco (COST), Coca-Cola (KO) as the 1st stock I ever bought, Pepsi (PEP) and Archer-Daniels-Midland (ADM)
👉 XLI - Industrials
highlighting General Electric (GE), 3M (MMM), John Deere (DE) & Axon (AXON)
👉 XLB - Basic Materials
highlighting DuPont (DD) … they report earnings today Wednesday May 1st … an earnings call I like to jump into quite often, though not this time …
👉 XLU - Utilities
highlighting Constellation Energy (CEG) which has also been quite in the news making all-time highs, besides that Dominion Energy (D) as the other outlier
📊 Special & Alternative Metrics: food for thought via sleek and intriguing charts
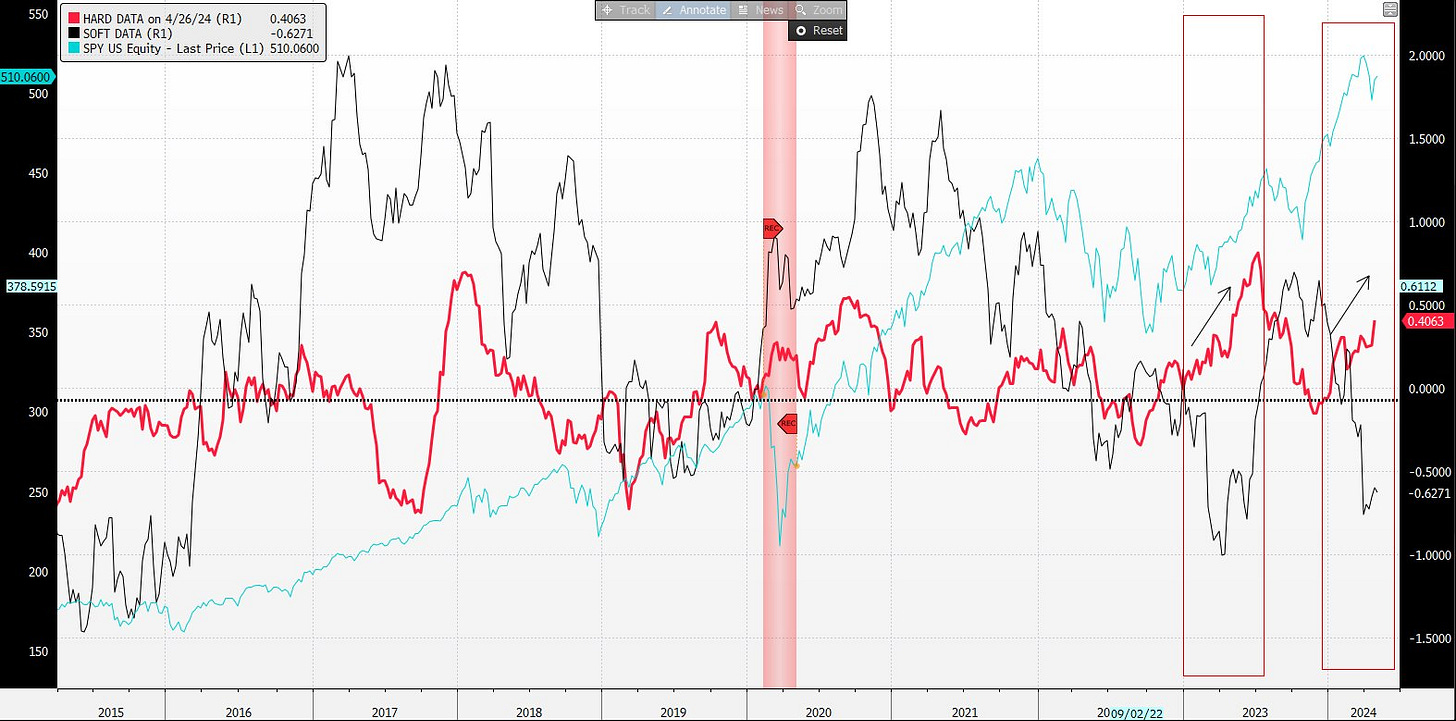
👉 S&P 500 (green), Hard (red) and Soft (black) economic data surprises:
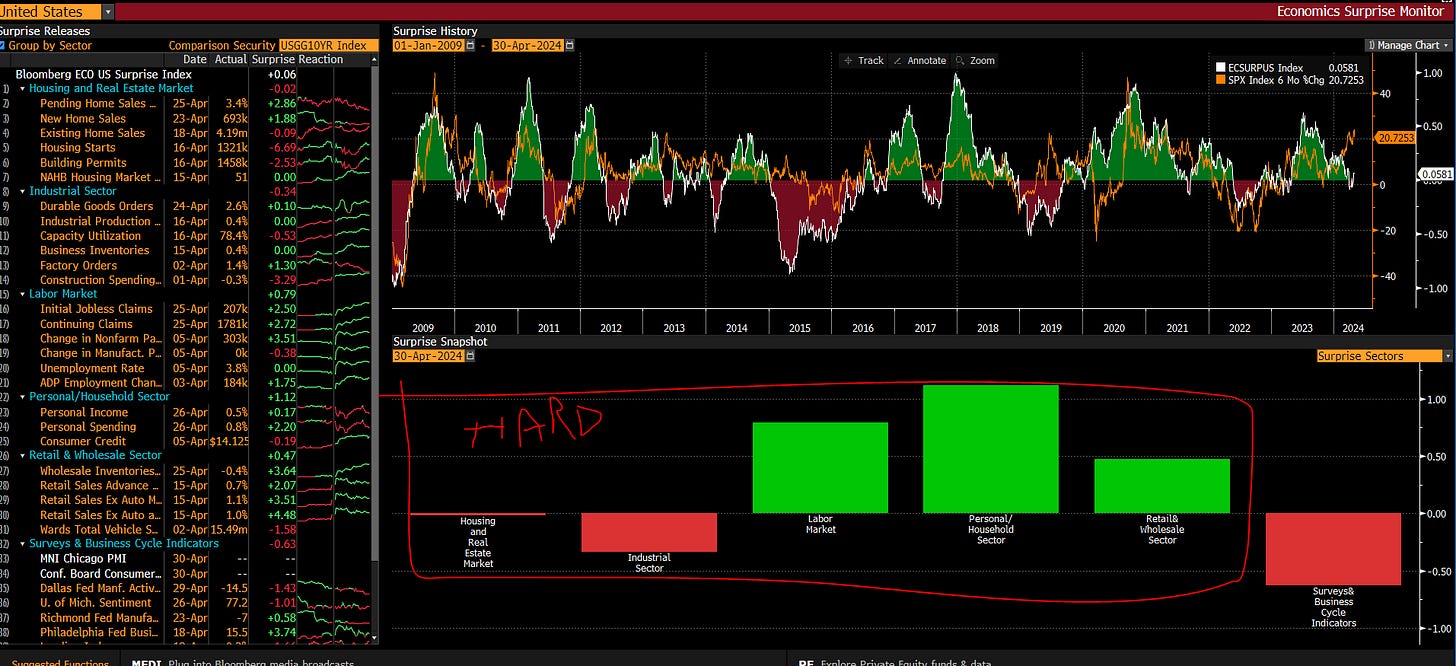
‘Hard’ data surprises diverging again from ‘Soft’ data surprises (2024 vs 2023)
Which one is the market following again? The hard econ data …
Hard VS Soft economic data = fundamental VS surveys & business cycle indicators …
which one you rely more in general?
Mav take: real fundamental data for the win medium-long term, but on the very short term not much changes prices more than sentiment …
N.B. ‘The Ultimate Compilation of Sentiment Metrics for the Economy and the Stock Market’
is a project I’m working on these days and scheduled for 2024/2025 which will be delivered via a dashboard, a framework, a book(let) or so
time will tell: a function of time, data, costs, resources etc … stay tuned!
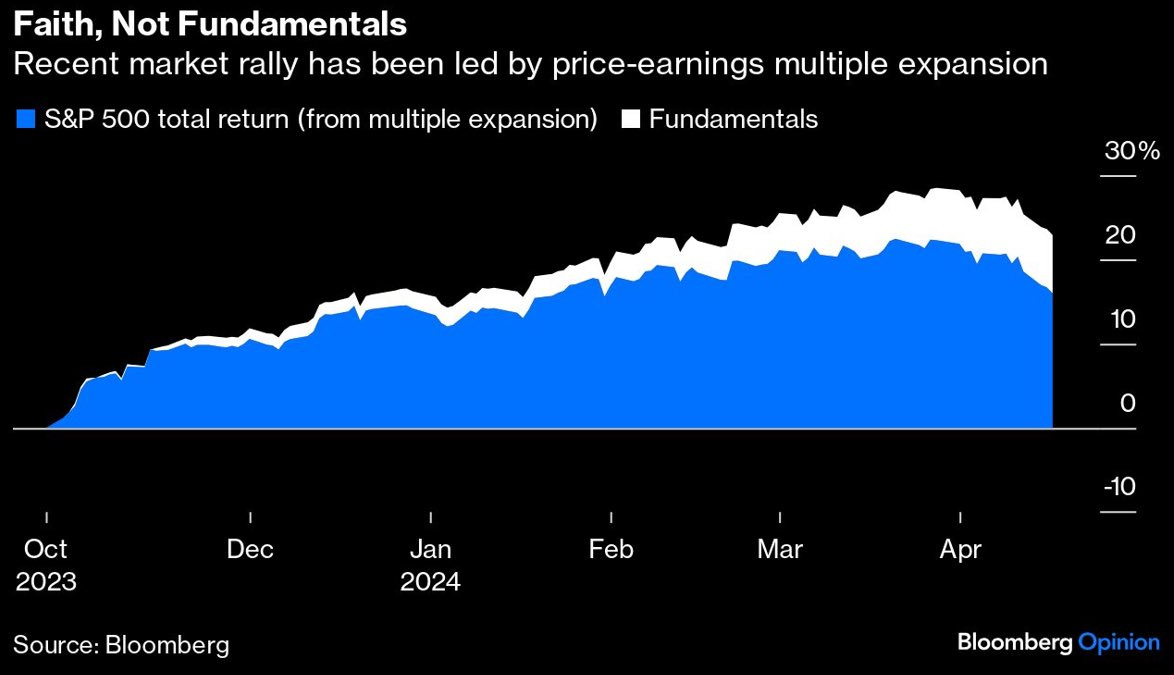
👉 The recent rally has been more about P/E multiple expansion than fundamentals
with good expected earnings, the beginning of the year returns were too good and too fast, and lately we did cool-off a bit which is normal
overall, I am not concerned … +7% so far in 2024 is still very good
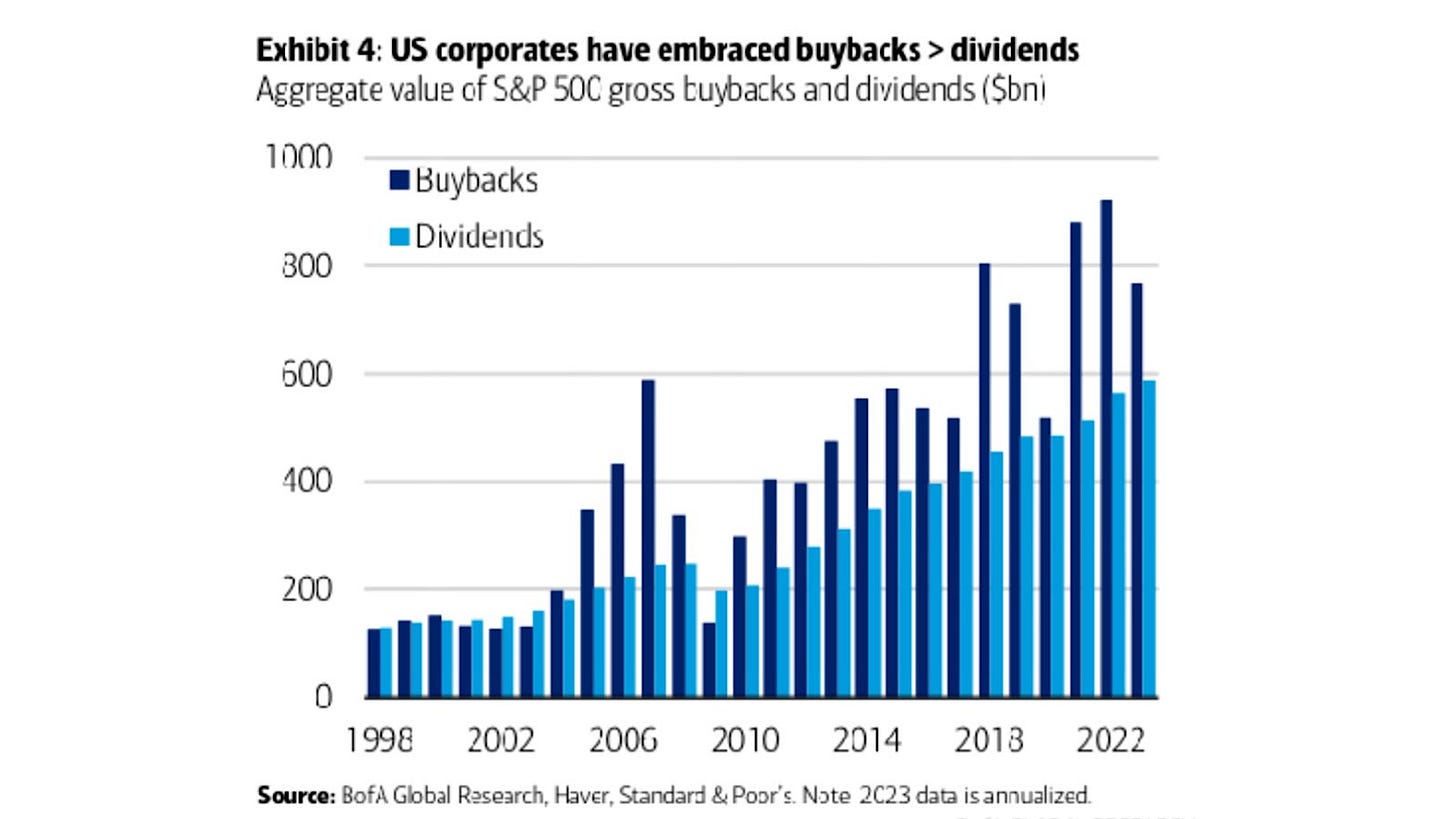
👉 S&P 500 stock buybacks:
after falling in 2023, will likely exceed 900m in 2024 and $1 trillion in 2025
the Magnificent 7 accounted for 26% of buybacks in the index in 2023, and Q4 filings show they're currently authorized to repurchase $215 billion in stock, 30% higher than the level authorized at the same time last year
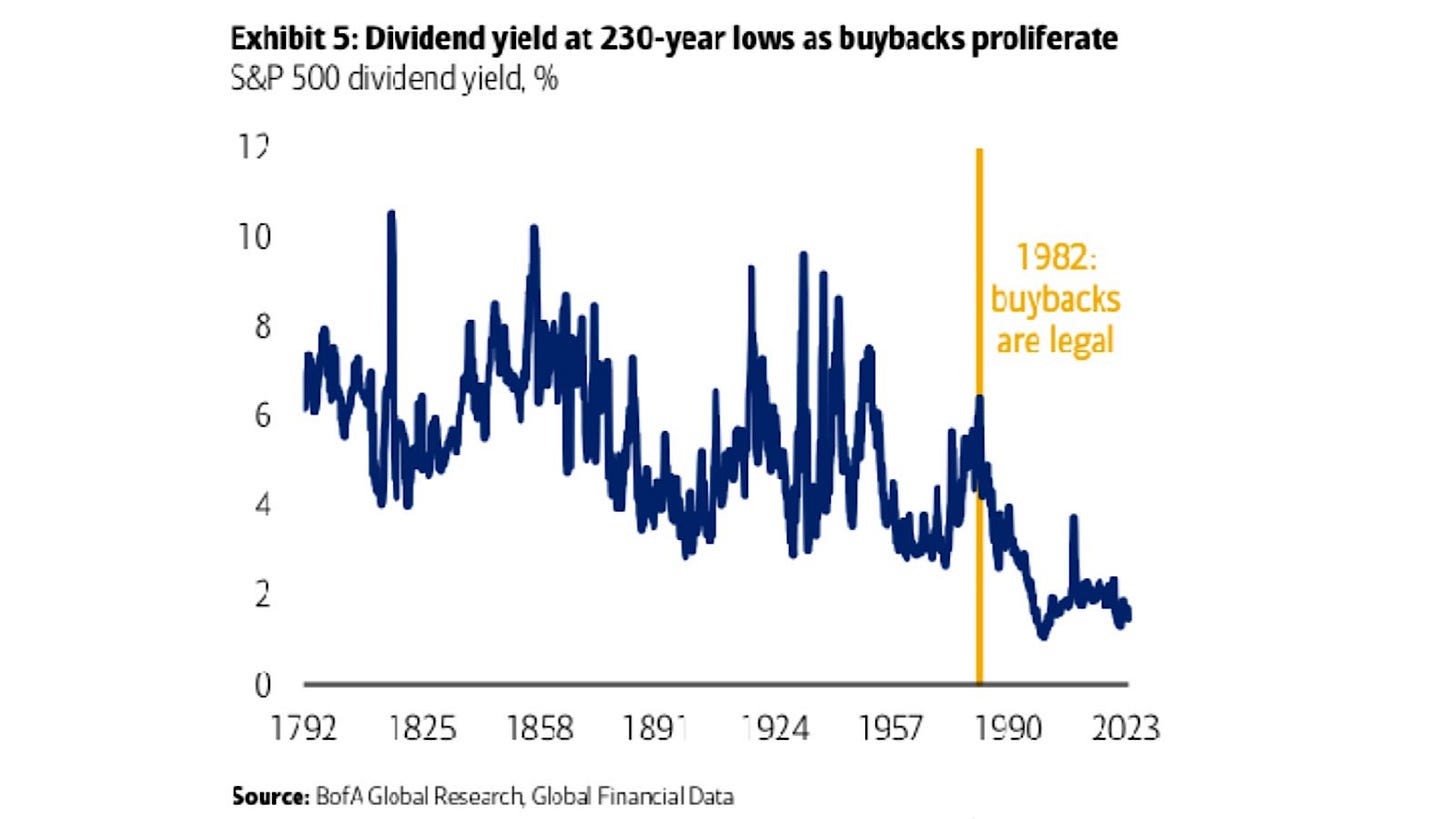
👉 How about dividends vs buybacks?
dividend yield at 230-year lows as buybacks proliferate, 1982 enabling quite a role
sending a dividend, a tax event is created for investors … with buybacks, there is flexibility: one can create his own dividend when he /she wishes, if not, no tax
companies that reduce share count via buybacks at low valuations, create value for shareholders and tend to outperform
Maverick eagle-eye on stocks buybacks & dividends during tough times:
in corrections, recessions, panics I like to hunt for companies announcing share buybacks: not small amounts for ‘cosmetics’ and ‘PR’, but material programs which signal that the business model is solid, can weather the storm and that they are smart by creating value for shareholders - if it is a company that pays a regular dividend and they maintain it or even increase during those times, even better!
during the 2020 Covid period, plenty of great companies did that and performed very well since then + great time to buy quality stuff via a big discount
👉 S&P 500 and Credit Spreads - a key long-term view:
credit spreads are low at 9-10%, hence with low corporate default worries, the S&P 500 made quite some new highs in 2024, passed the previous all-time high that we had before the Russia-Ukraine war
corporations are expected to have a good earnings season now this year, unlikely that we face a credit crunch in the near term despite we’re still in a high interest rate environment (more on that in my next state on the state of the US economy)
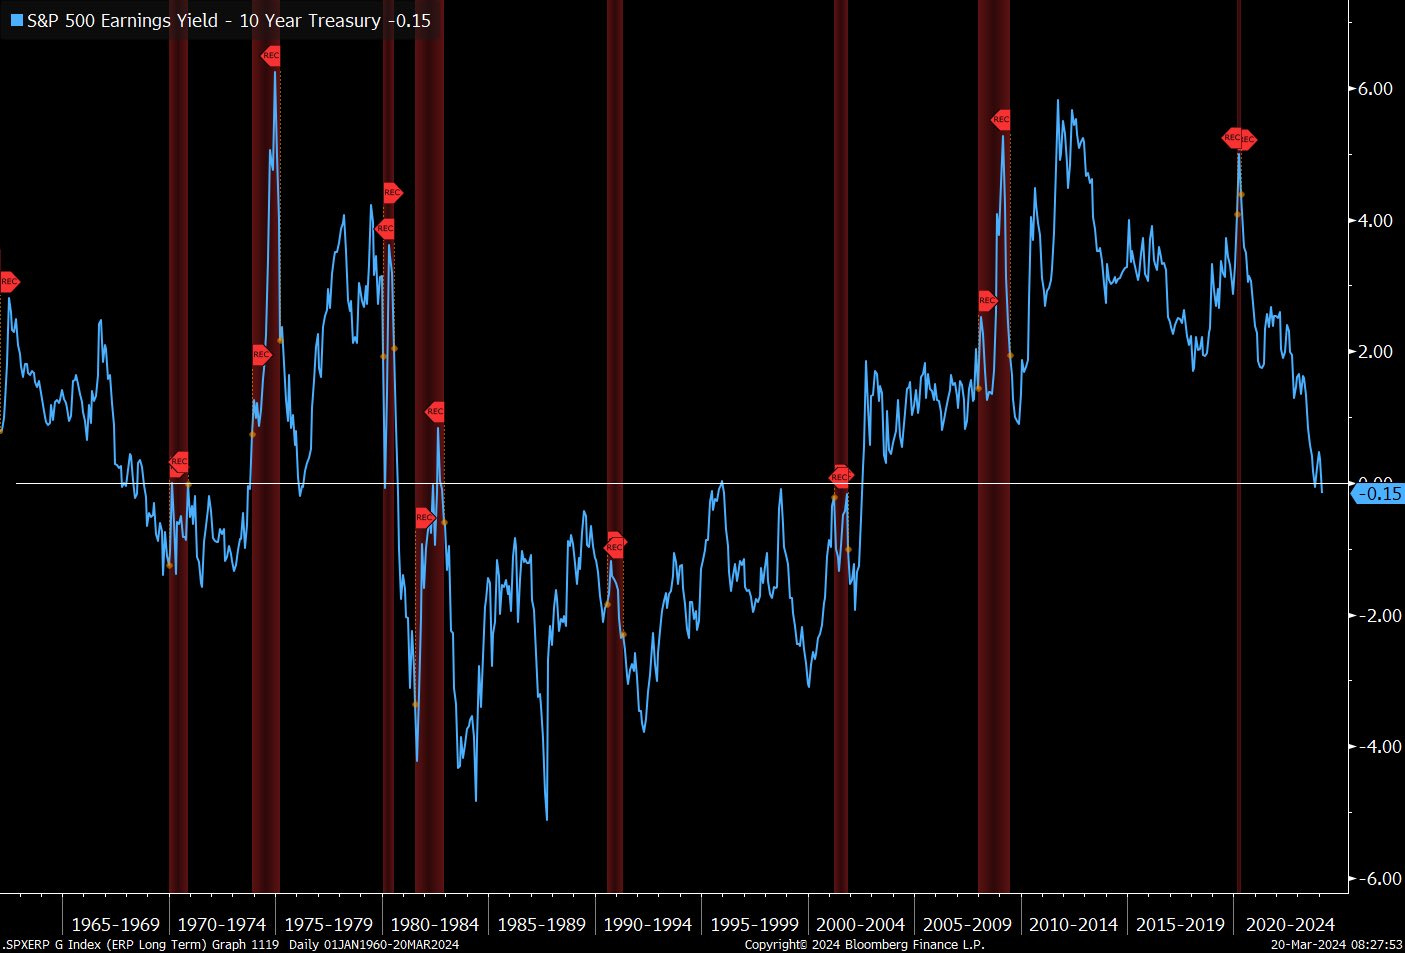
👉 S&P 500 Equity Risk Premium (ERP):
negative for the first time since 2002, normally not good for future returns but also
debatable for future returns: it stayed negative throughout the 80s-90s bull market
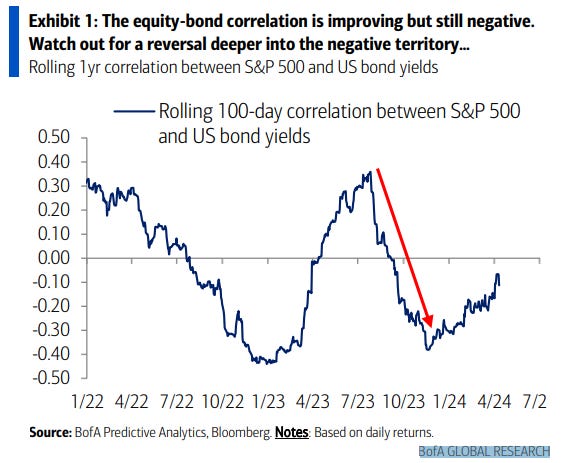
👉 S&P 500 and US bond yields for the equity-bond correlation:
improving but still negative, watch for a reversal deeper into the negative territory … this is a ‘game’ around inflation uncertainty / certainty …
N.B. Inflation deep dive via my next special Macro report dedicated to this key topic is currently work in progress, with a likely release in the middle of May
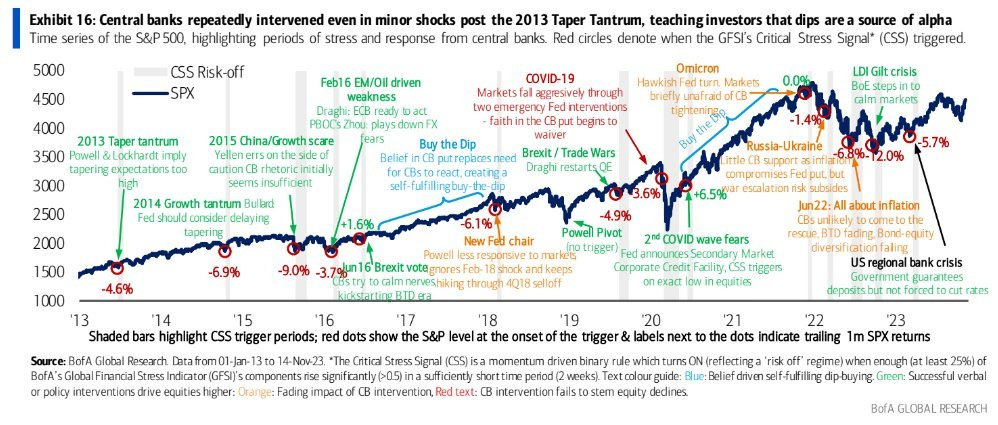
👉 S&P 500 and central banks interventions:
various periods of stress, where red circles denote critical stress signals triggered
buying the dips has been very good, opportunity not throwing in the towel
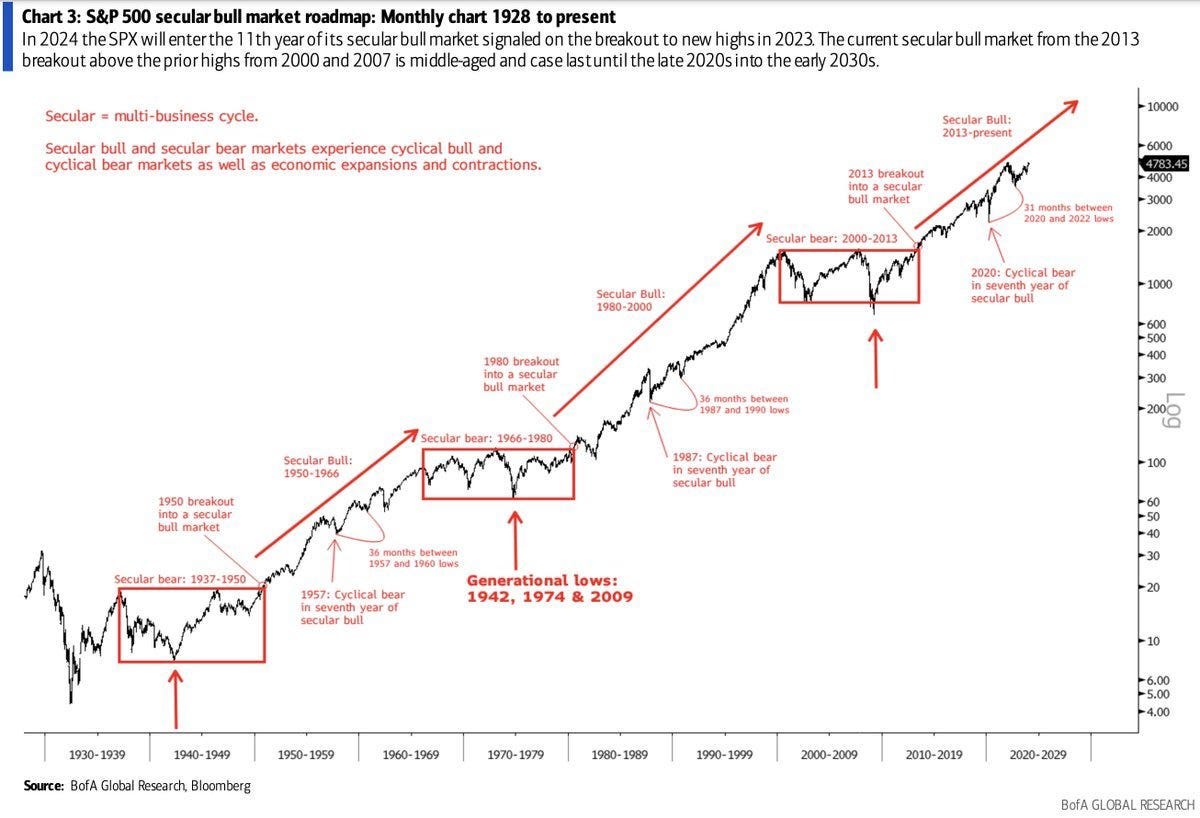
👉 Special one: the S&P 500 secular bull market roadmap - monthly chart from 1928
in 2024, the S&P 500 entered the 11th year of its secular bear market signaled on the breakout to new highs in 2023
👍 Bonus Charts 👍
👉 Remember Ghost Busters? ‘Who you gonna call?’ Maverick for myth busters! 👇
So, we often hear that the stock market anticipates (by 6 months) & prices in an incoming recession, but that isn’t quite true:
81% of the value drop happens during the ACTUAL recession, not 6 months prior
S&P 500 drawdown during recession (dark blue bars) VS the drawdown including the time period 6-months prior to recession … let that one sink in
P.S. a very representative data set given almost 100 years, hence many business cycles
👉 S&P 500 price declines around recessions
12 recessions since WW2, we have a median of a 24% drop
every recession and stock market decline that comes with it is different, yet a key note is: stocks bottomed and resumed upward long before recessions ended
P.S. this is price decline, it does not include dividends which you got (1.5 - 2.0% yearly)
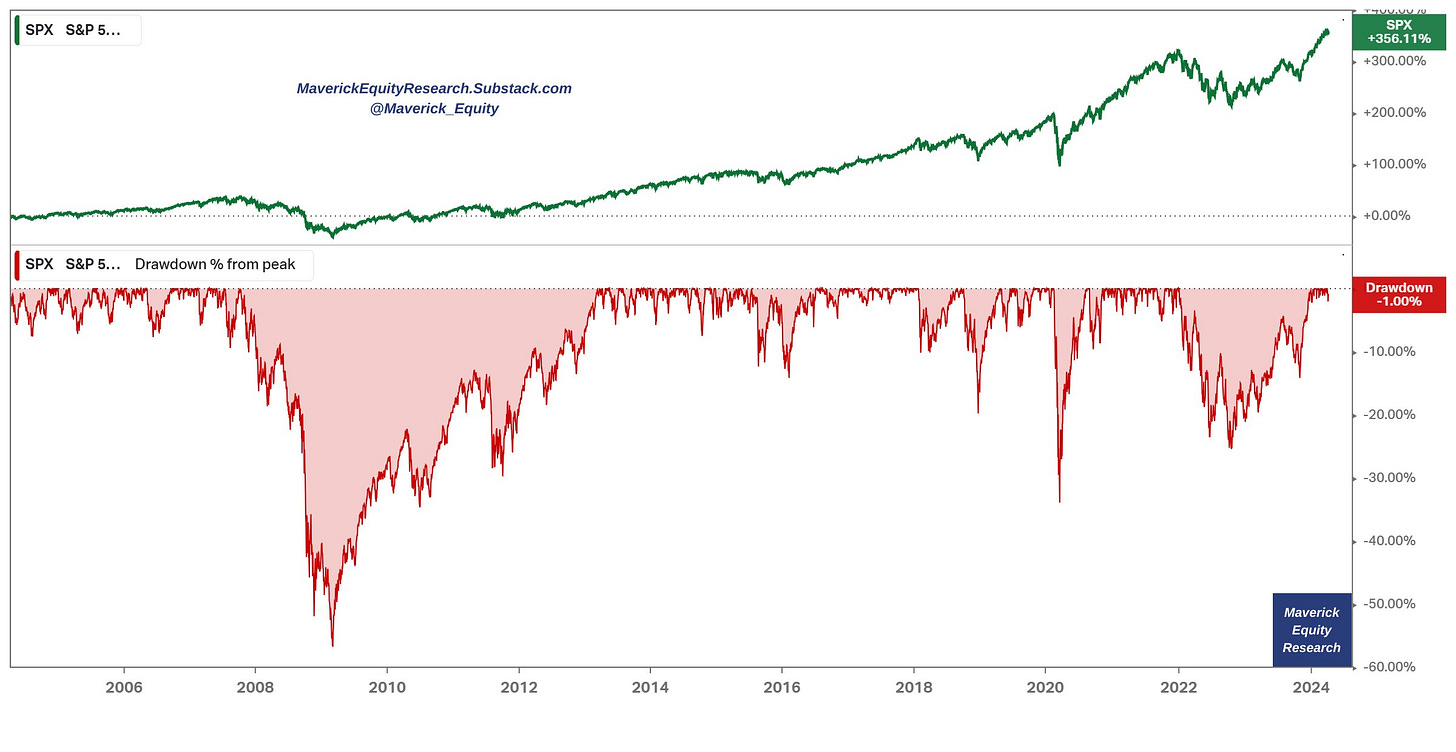
S&P 500 drawdowns via the last 20 years as an alternative complementary view:
2007-2009 GFC was very bad, I was down 52%, yet hey, I am around, great lesson, great experience, into business owner mindset, not moving tickers on a screen …
returns keep coming, compounding happens …
same drawdown view but via calendar years
A closer look at drawdowns since 2020, S&P 500 and the average retail investor:
S&P 500 with a -34% drawdown in 2020 Covid, and -25% in the 2022 bear market
How did retail investors do on average?
-32% during 2020 Covid, -36% in 2022
by now fully recovered … which is key … drawdowns are part of investing …
👉 S&P 500 intra-year declines & recoveries:
14.2% average declines in a given year should be something one is comfy with
so that one can enjoy positive annual returns in most years, 33 out of 44 since 1980
👉 And another Maverick myth buster take - passive investing and S&P 500 are used like twin brothers and sisters, yet the S&P 500 is not as static as many believe:
1995-2022, there are on average 26 constituents changes each year, let that sink in!
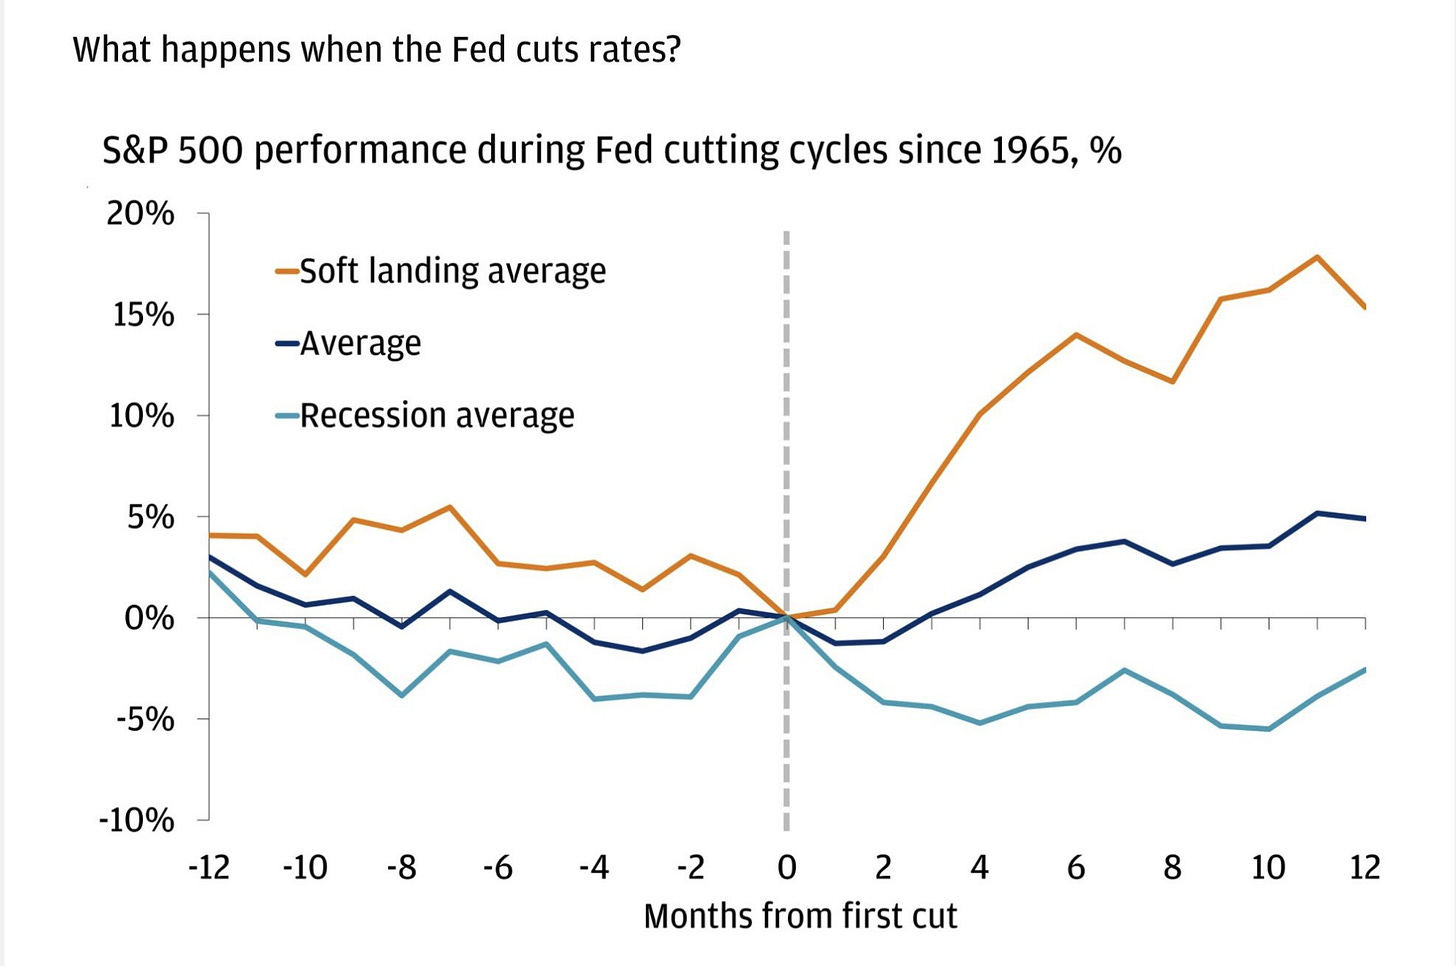
👉 What happens with the S&P 500 when the FED starts to cut interest rates? Via the cutting cycles since 1965 (quite representative post WW2 economies):
if rates cuts due to a recession then negative performance in the next 12 months
quite positive on average (5%) and very positive in a soft landing scenario (15%)
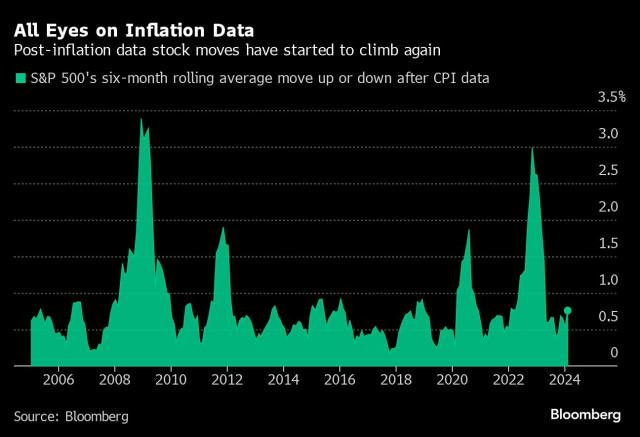
S&P 500 and Inflation, a sensitive relationship during inflation surprises/uncertainty: post-inflation data and stock moves up or down since 2005:
2020 and 2022 were 2 years when inflation data (CPI) data moved stocks a lot as inflation started to come higher and higher and higher …
yet check 2008-2009 … when we had both inflation and deflation uncertainty
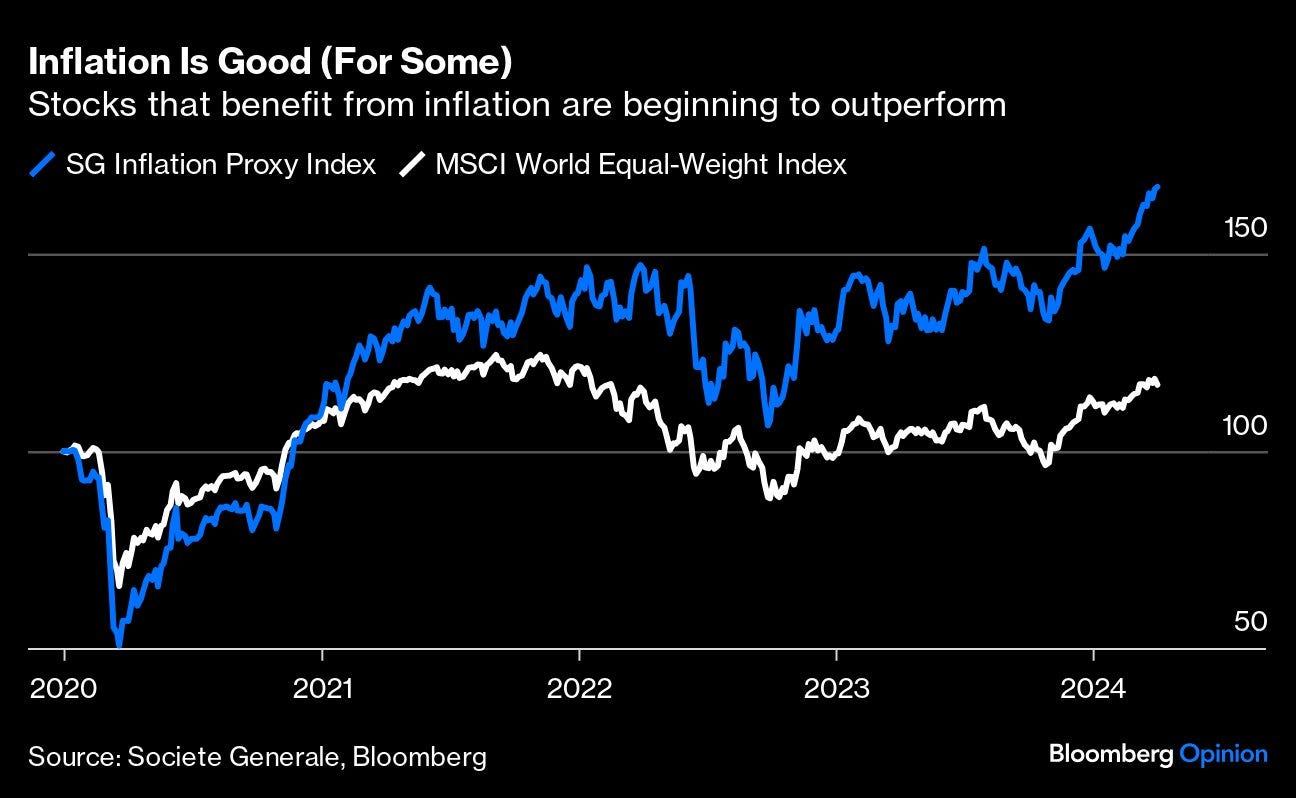
Mav’s take on stocks and inflation: stocks are one of the best hedges for inflation … !
N.B. one day I’ll write a big piece on the key subject: Risk Management and Hedging!
likely 2024/2025 and to be delivered via a dashboard, a framework, a book(let) or so
time will tell: a function of time, data, costs, resources etc … stay tuned!
Moreover, specific baskets of stocks, can not just be a hedge against inflation but can benefit from it and outperforming … let that sink in!
Valuation and Sentiment via 1 sleek chart and going beyond the S&P 500, namely Global Equity Indices (MSCI ACWI Index) Above 200-DMA
currently 66% of global stocks are trading above their 200 DMA
we can see how that is far from the above 80% or even 90% levels that signal overvaluation and/or overheated market sentiment that happen before corrections
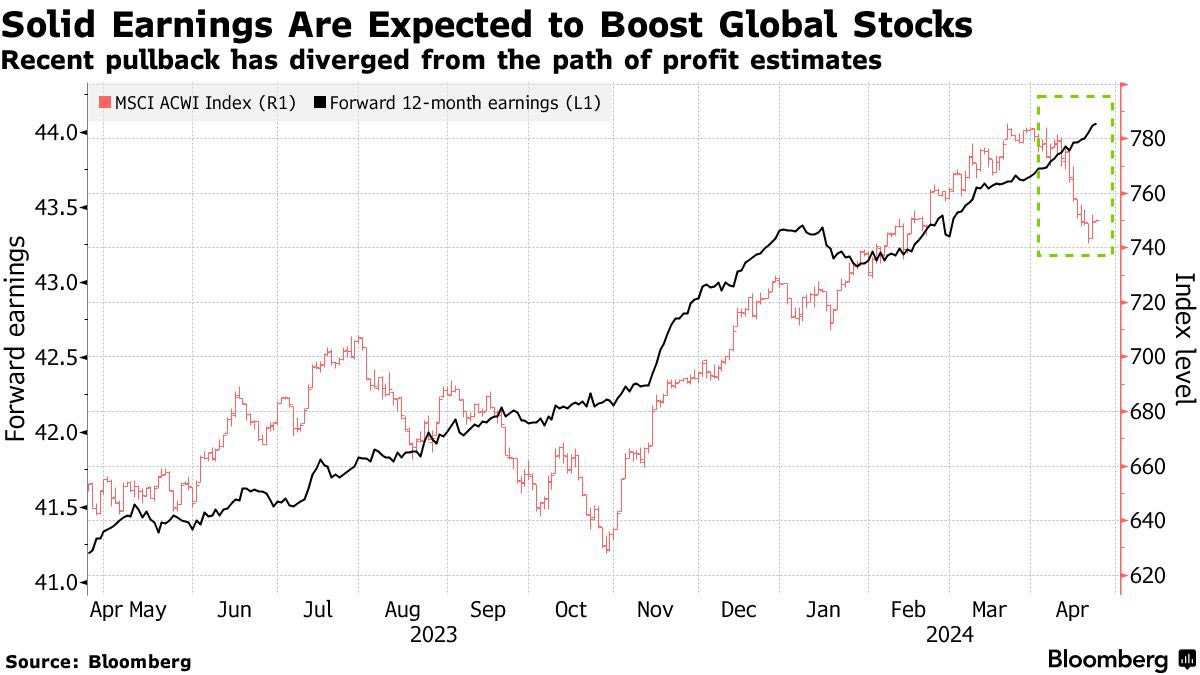
Complementary, solid earnings are expected for global stocks (MSCI ACWI Index)
note, the recent pullback (red) diverged from the path of profit estimates (black)
Research is NOT behind a paywall and NO pesky ads here unlike most other places!
Did you enjoy this extensive research by finding it interesting, saving you time and getting valuable insights? What would be appreciated?
Just sharing this around with like-minded people, and hitting the 🔄 & ❤️ buttons! That’ll definitely support bringing in more & more independent investment research: from a single individual … not a bank, fund, click-baity media or so … !
Have a great day!
Mav 👋 🤝























Good job!!!
Tech and Ev’s are coming and they are coming big my Taylor in China just said his 20k stock chinnese Ev beat a Honda integra type r 2023 ….