✍️ The State of the US Economy in 35 Charts, Edition #1
GDP, Job Market, Interest Rates & Yields, Consumers and Inflation. Higher US Yields and Recession probability. Research via charts that say 10,000 words ...
Dear all,
welcome to the +300 new readers for a total of 2,750 enjoying independent research!
“The best thing a human being can do is to help another human being know more.” from the one & only Charlie Munger. Just like with investing, knowledge compounds!
‘The State of the US Economy in 35 Charts’, edition #1 + addressing 2 key questions:
what is driving the recent higher US Yields
recession likelihood
Report is designed to have a natural flow & great to get questions & feedback overall.
Structured in 5 parts + 2 bonus & highlights here in the ToC as executive summary:
📊 GDP: 5.6% or 1.5%? Likely growing at the 3% long term average which is good
📊 The Job Market: just like the summer, less crazy hot, but still hot & strong
📊 Interest Rates & Yields: peak rates & yields are here, or rather sooner than later
📊 The Consumer aka People: out & kicking strongly: holidays, consuming, investing
📊 Inflation: cooling off, cooling off
👍 What is driving the recent higher US Yields: GDP growth & supply of treasuries
👍 Bonus - Recession talk: low probability
📊 GDP 📊
GDP: a stunning +5.6% growth estimate for Q3 2023 via the Atlanta FED GDPNow 1st of September release. This is way above the +1.5% consensus which was lifted from 0% at the beginning of the quarter, and the actual +2.1% for Q2.
This will be very interesting to follow and find out the why behind the big divergence. I lean into the middle of 5.6% and 1.5% for a 3.5% which is very good & close to the long term 3.18% average.
Addressing 3 misconceptions or lack of rigor that I have seen around this often:
👉 Atlanta FED GDP growth estimate is not nominal, but real after counting inflation
👉 best viewed as a running estimate aka a ‘Nowcast’ based on available economic data for the current quarter, and not an outright ‘Forecast’ of real GDP growth - also note that it is not an official GDP forecast from the Atlanta FED
👉 no subjective adjustments - based solely on the mathematical results of the model
📊 The Job Market 📊
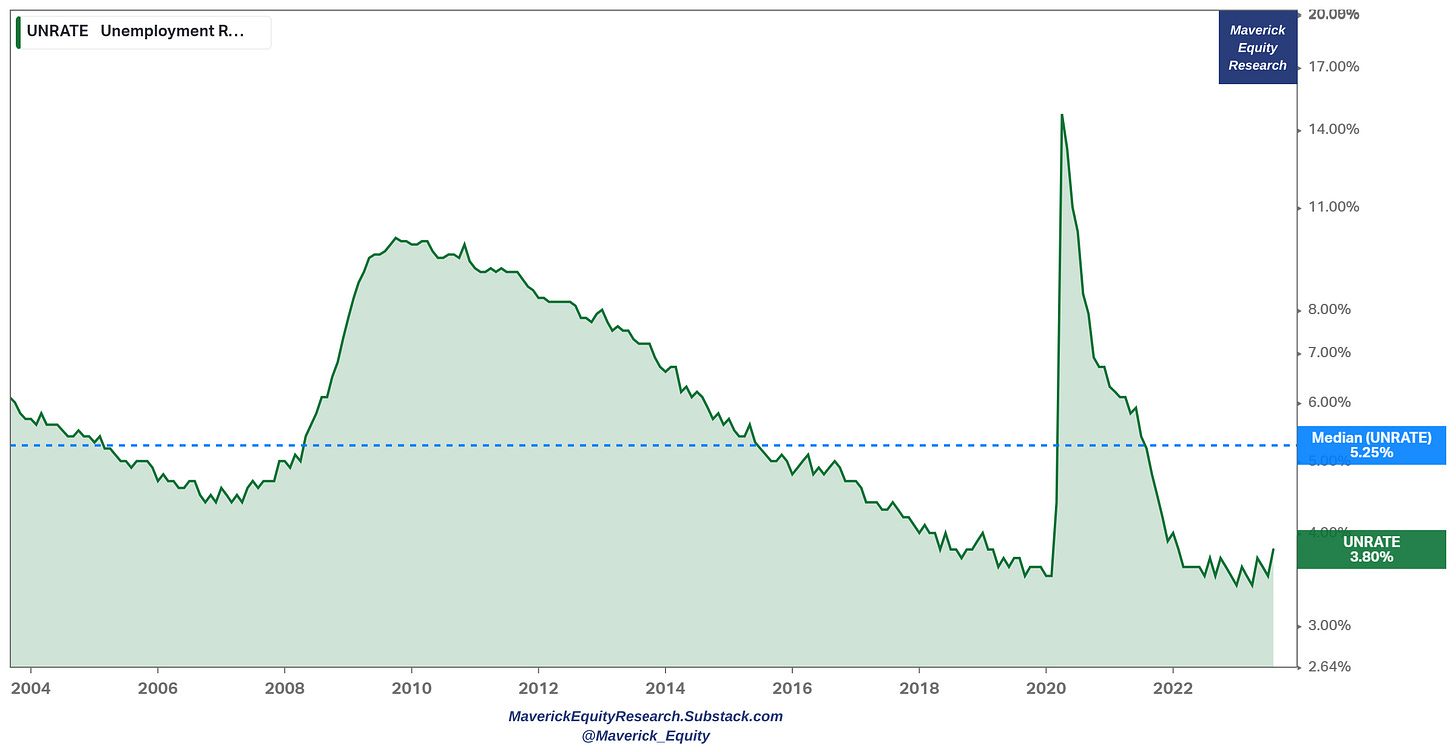
Unemployment Rate (UR) at a very low 3.8%
materially below the 20-year median at 5.25%
note that the 3.4% in April was the lowest since 1969 … let that sink in!
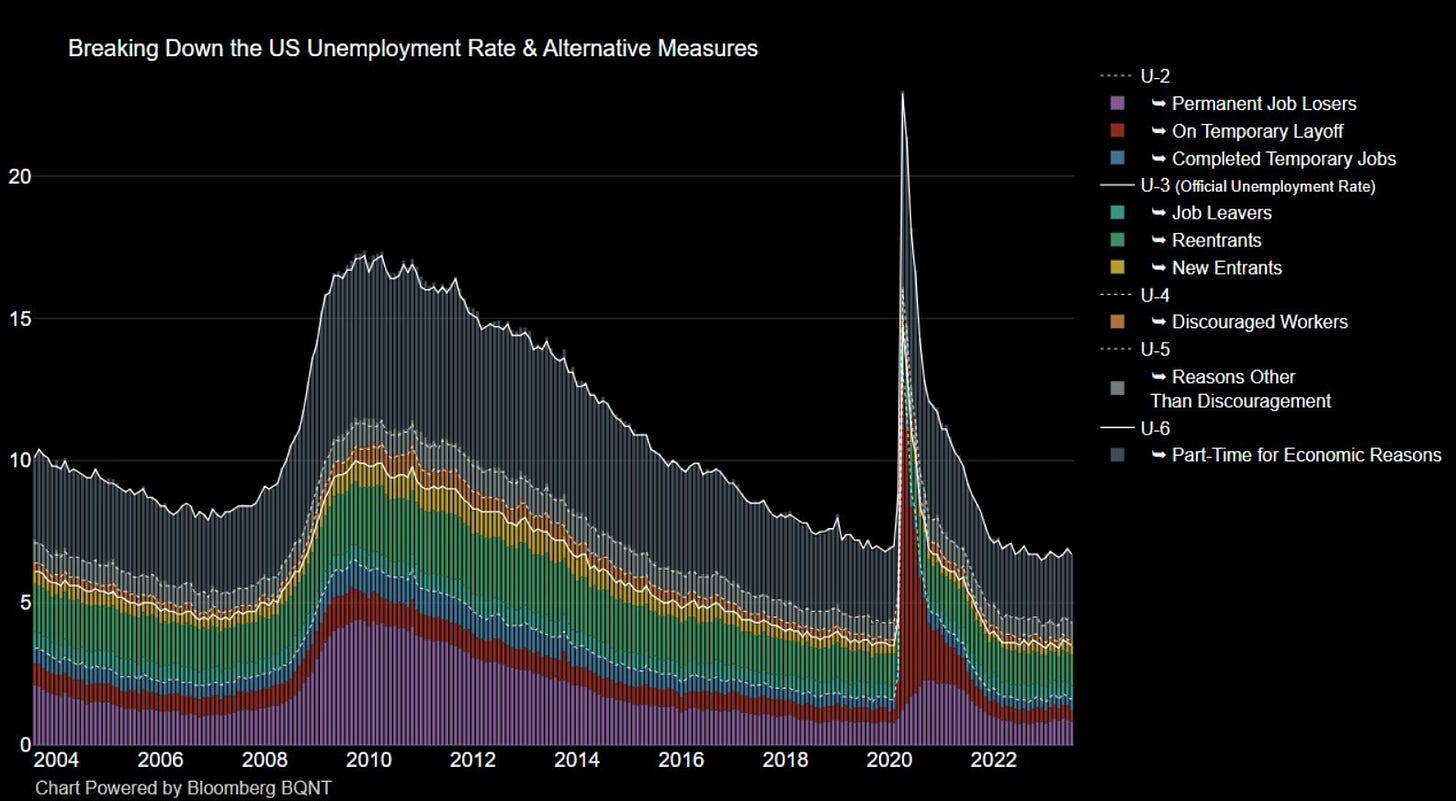
For further insight, breaking down the UR & alternative measures:
who would have imagined that after the 2020 Covid panic (bigger even than the 2007-2009 GFC) that we will recover that fast? Amazing what the economy can do!
Initial Jobless Claims down to 230k which is at the same pre-pandemic level and also below the 244k median. Continuing Jobless claims (1-week lag) down also to 1.702m and is at the same pre-pandemic level and also below the median of 1.805m.
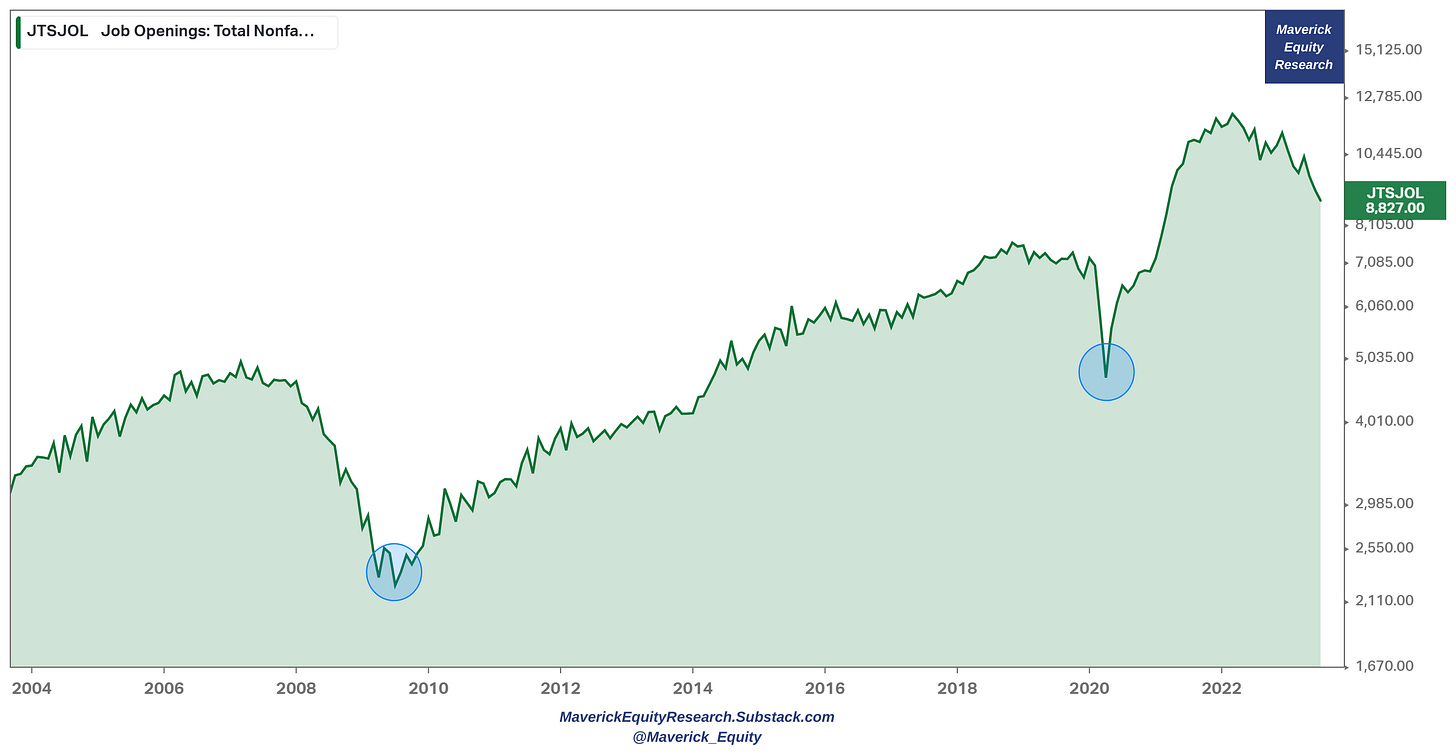
JOLTS (Job Openings) also show the strength in the labour market:
👉 8.8 millions of available jobs ready to be filled
👉 2 million extra jobs out there compared to pre-pandemic levels
👉 more than twice relative to the pandemic bottom with 4 million jobs added
👉 the recent drop is material while still my view on it is positive & simple: it's a plus reverse to have that many jobs ready to be taken
👉 N.B. the FED wants a bit looser job market in order to chill a bit with the fastest hiking cycle in recent decades and continue cooling off inflation
Therefore, should we slow down from here, there are more than decent 'job reserves’ available … that acts like a cushion which is nice to have.
For further insight, a view closely watched by Fed Chair Powell and other Fed leaders (as one of the factors driving inflation): JOLTS Job Openings (blue) & Unemployed People (red) as a telling visual if the job market is at any point in time ‘loose’ or ‘tight’:
after the 2007-2009 GFC we had for quite a while a ‘loose’ labor market
while now after the pandemic a ‘tight’ one after a great & fast recovery as the economy not just recovered the lost jobs from the pandemic but added way more
The 2 above now as a ratio: Job Openings to Unemployed People: at a nice 1.51x!
👉 job vacancies still exceed the number of unemployed by more than 50%
👉 prior to the pandemic it was about 1.2x and it peaked at 2x in 2022
👉 simply put, we have 1.51x job openings for every unemployed person = historically a great time to be looking for work and negotiating a decent salary ...
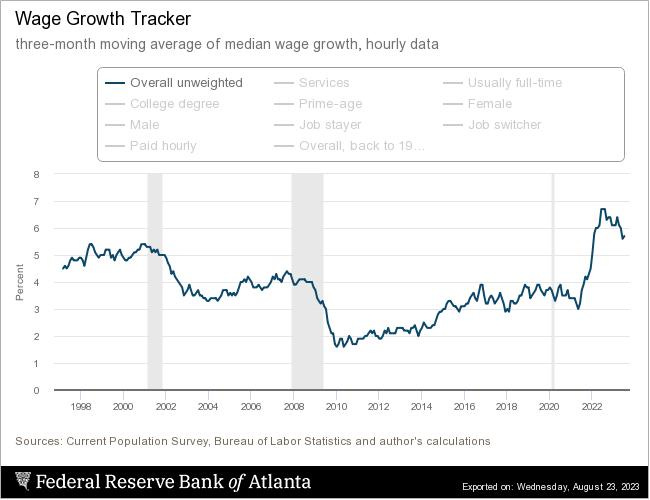
Next we look if the above translates into reality via wage growth. Yes, +5.7% wage growth for July 2023 = the highest since the Atlanta fed tracks this, namely 25 years
👉 income from labour = the primary funding source of all consumption
👉 when that does well, consumer spending will naturally just follow (more on that below when I cover the consumer)
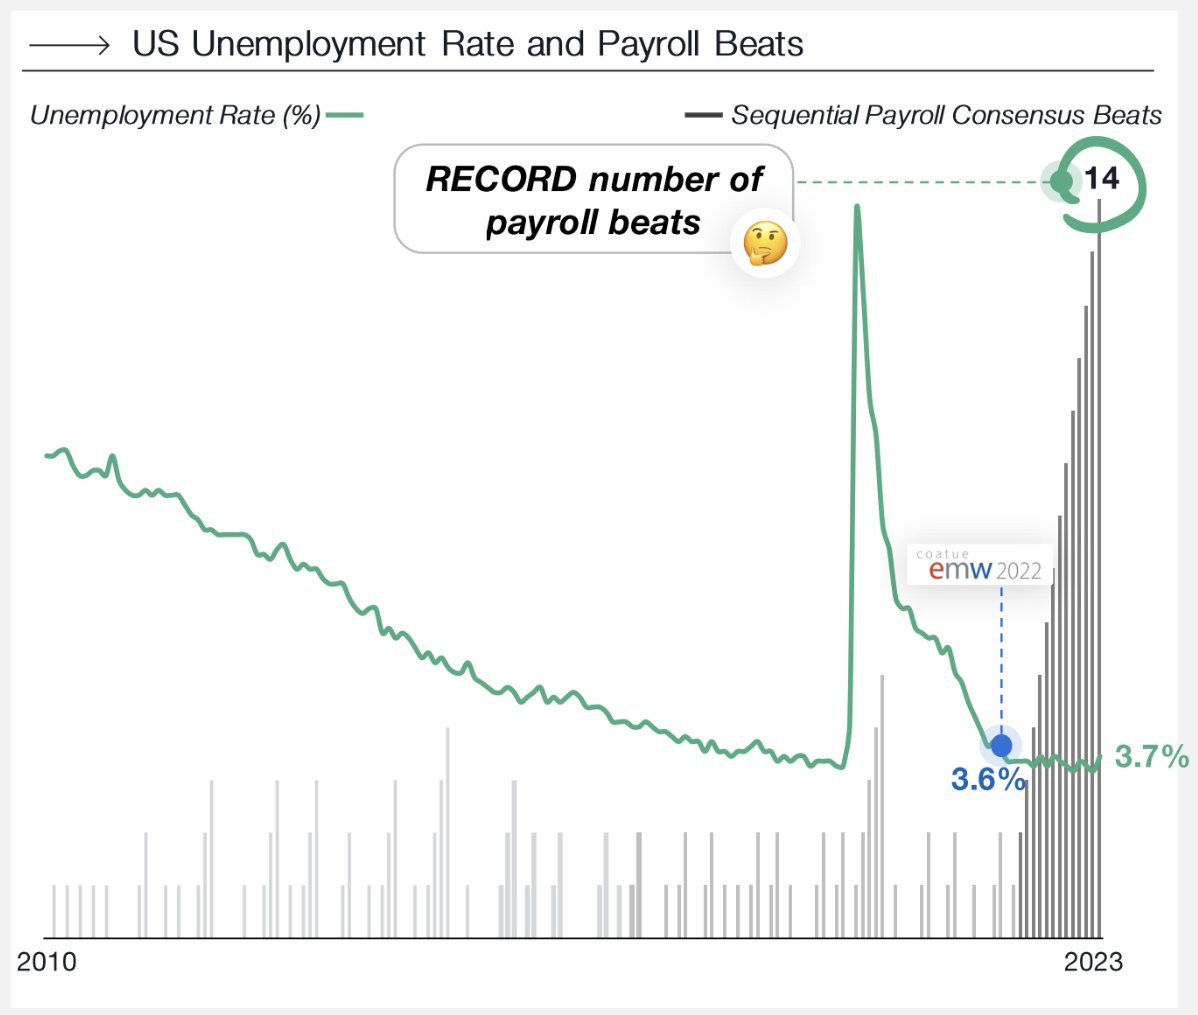
Payrolls beats have also been rocking it strong: 14 sequential consensus beats
📊 Interest Rates & Yields 📊
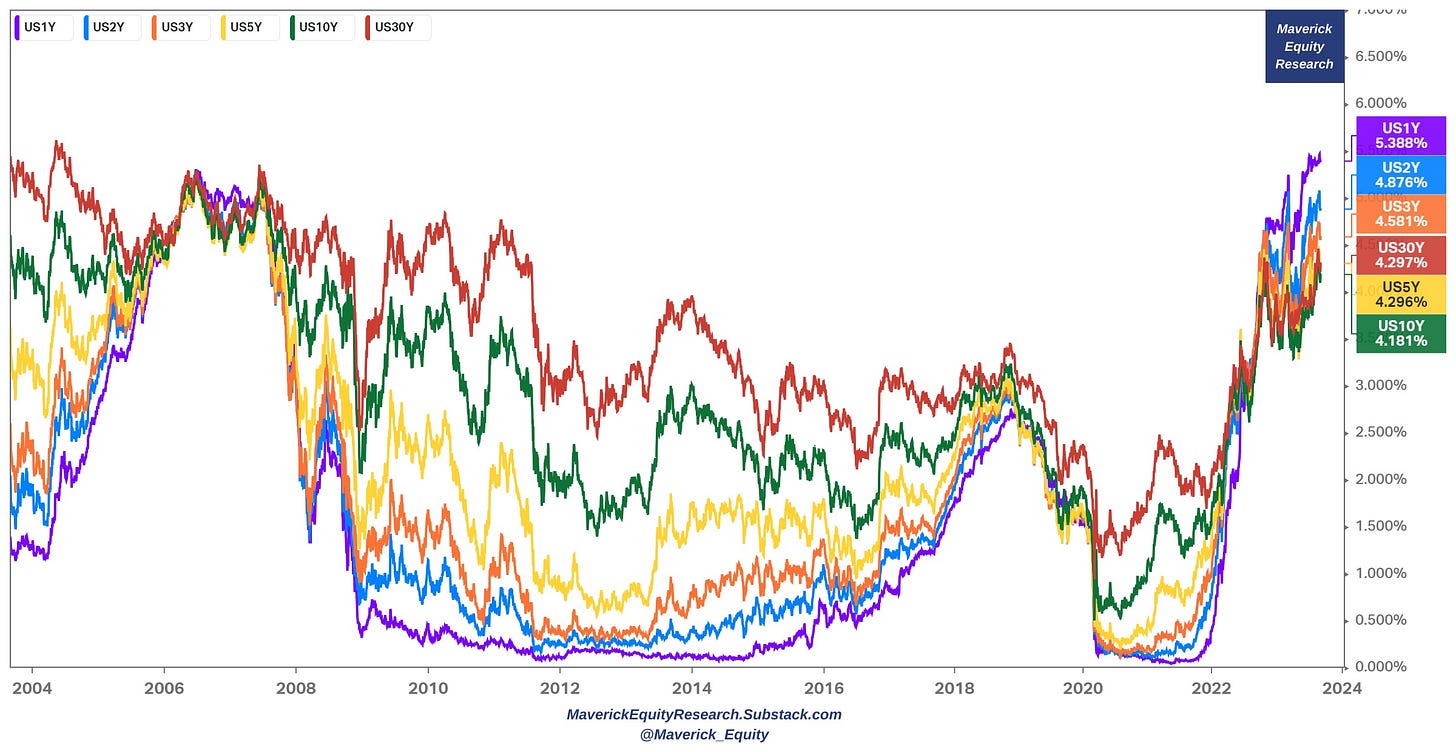
US yields: 1y 2y 3y 5y 10y 30y with a 20-year lookback period:
👉 3 hiking cycles in 20 years: not the 1st one nor the last one I tell you that
👉 currently above the 2015-2019 period, though below the 2004-2009 cycle with the exception of the very short end of the curve which is above
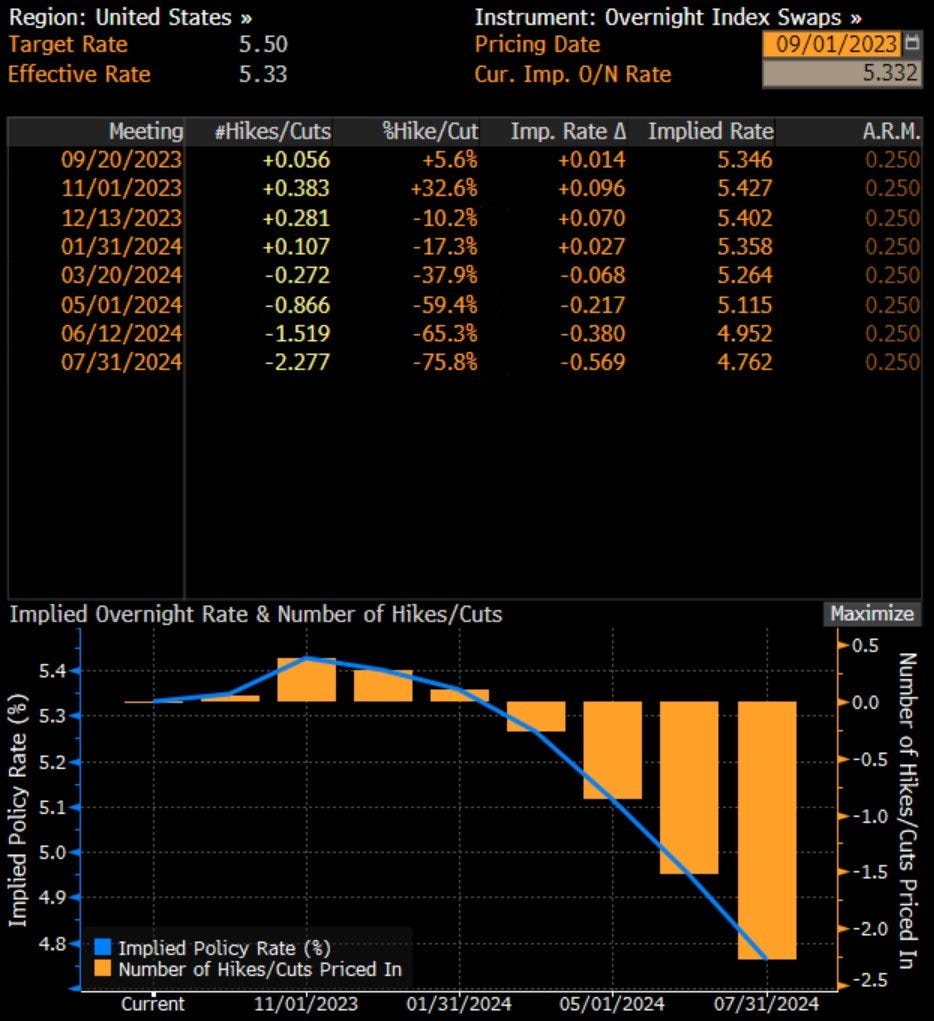
Where are we headed? FED interest rates pricing via the Fed Funds Futures:
👉 we have a chance close to 0 (5.6%) for a hike in September while a 1/3 (32.6%) chance that the Fed will hike once more in November
👉 rates on hold for about the next 6 months with first cuts around Q1-Q2 2024
👉 short-term interest rate markets are expecting peak FED policy rates in November at 5.42%, followed by interest rate cuts in 2024 - note that the 5.42% expected by the market is below the FED forecast of 5.6% = room for surprise higher
Takeaway: peak interest rates aka ‘peak FED’ should be here rather sooner than later!
Higher interest rates naturally made for high US 30-year mortgage rates: above 7% (4.46% median value for the last 20 years) and created many headlines:
Hovering now above the 2006-2008 peak levels, though 2 key notes for true insight:
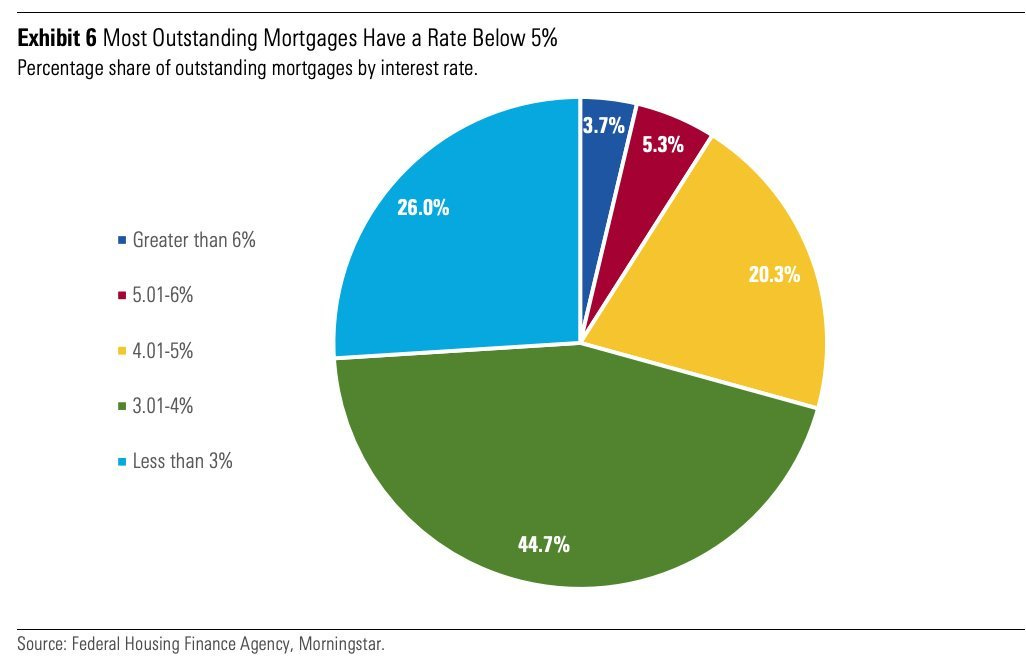
👉 distribution of mortgages by interest rates paid: 91% of people have a rate BELOW 5% which is close to the 20-year median of 4.46%. Detailed breakdown:
26% have a rate under 3.00%
70.7% have a rate under 4.00%
91% have a rate under 5.00%
96.3% have a rate under 6.00%
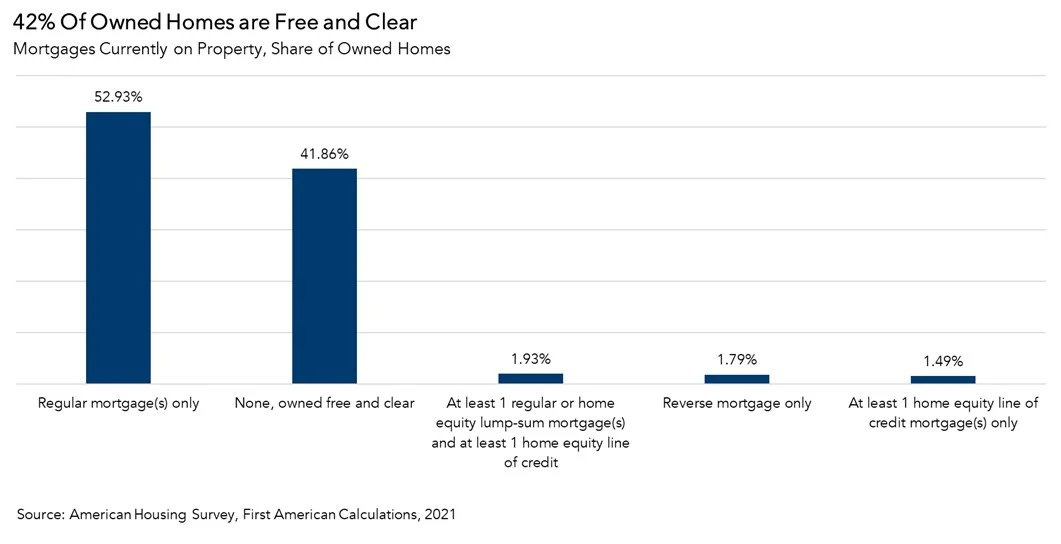
👉 How many owned US homes are free and clear from a mortgage? Via Census.gov:
42% in 2021 of all owner-occupied homes in the U.S. were owned free and clear, up from 34% percent in 2011. Of those who owned their home free and clear, nearly 78% were owned by homeowners aged >55
Q3 of 2023 nowadays, it is very likely higher: maybe even 45-50% given that most owners are 55+ which should be close to the end of the payment schedule
Combining the 2 above we have actually the story: if 42% of homes (likely more in 2023) are owned outright + 71% of mortgages below 4%, we can deduct that in excess of 80% of homeowners do not feel much the effect of high current mortgage rates.
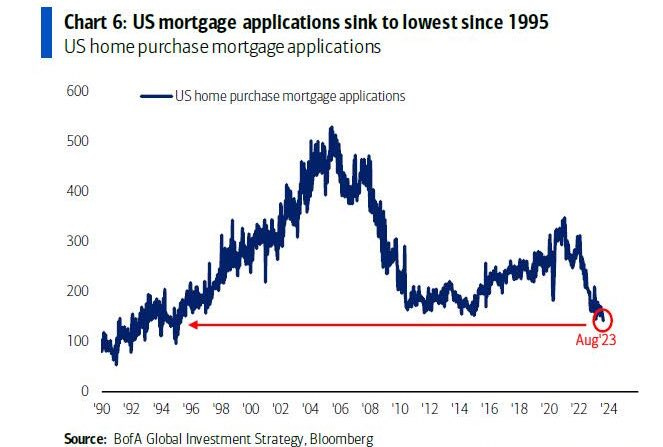
Easy for new people to take mortgages now? No, mortgage applications are at the lowest since 1995, but at no point in time everybody can be happy. And also let’s recall, the wage growth is quite solid which helps a lot.
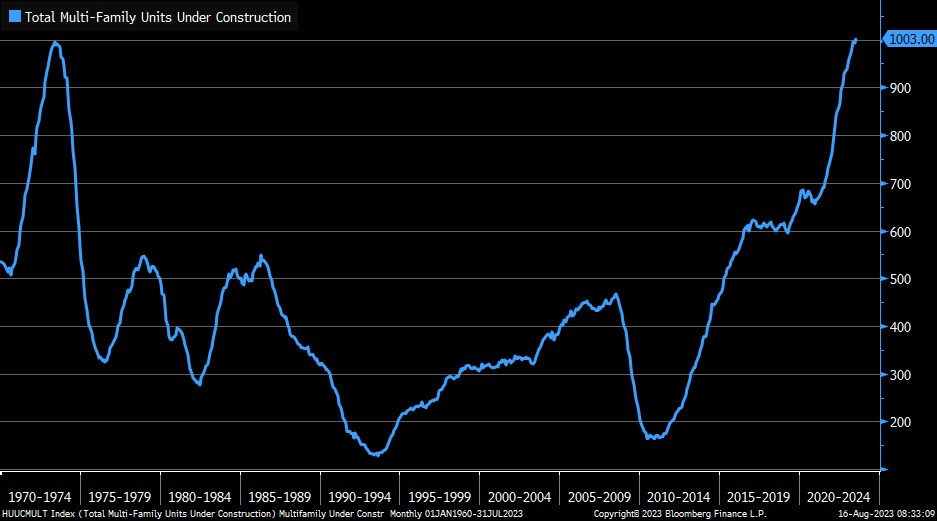
Now does this mean multi-family constructions are halted or dropping big time ? Not at all: a new all-time high in July with more than 1 million multifamily units under construction: rental market is always there to absorb housing needs besides outright buying via cash or mortgages.
Therefore, headlines are more doom & gloom than they should when it comes to the real estate market overall. But for clicks and views for advertising revenue they will keep rolling, and once interest rates, yields & mortgage rates will go down, headlines will find something else to beat the drum.
Nonetheless, it is worth pointing a material weakness of the current economy: the trinity high interest rates, commercial real estate (CRE) loans and regional banks!
CRE debt held more and more in recent years by small banks: currently they hold over 70% of CRE loans and the big question is how many loans will default
Regional banks - KRE ETF (140 constituents) -27.45% in the last year reflecting:
the lower quality of the loan book which is compounded by
if/when some banks need to raise cash to compensate for loan loss allowances and charge offs, they would have to sell their T-Bills at a material loss (if one can hold onto the risk-free T-bills until maturity, they are naturally not an issue)
the effects of high interest rates sometimes have a lag until fully felt
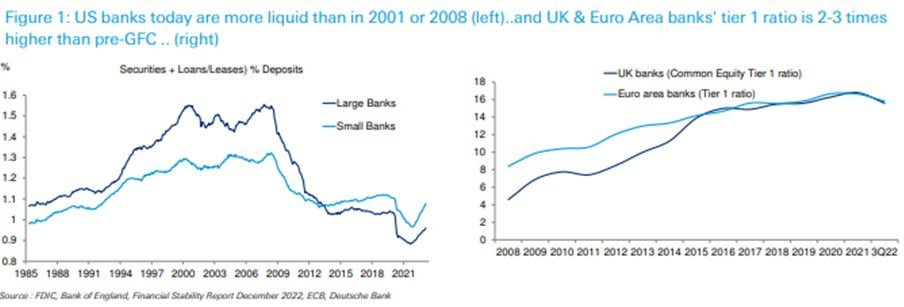
Nonetheless, banking sector comparisons between 2007-2009 and nowadays are way overcooked. In 2023 we saw how smoothly troubled SVB & FRC banks were managed. These days banks are way stronger than during the GFC: capital levels, liquidity, regulatory tools to intervene when needed!
As always, Maverick Equity Research is data first, opinion after hence there you go: US banks are way more liquid than in 2001 or 2008 while EuroZone and UK ones have tier 1 capital ratios 2-3x higher than before 2007-2009.
I did my thesis on the 2007-2009 Subprime Mortgage Crisis and one day on a special edition, I will post snippets with key takeaways. Until then, be it rather new to finance or more experienced, I highly recommend this great 65h course from Yale on the 2007-2009 Global Financial Crisis. Mixing top academician Andrew Metrick with top practitioner former Secretary of the Treasury Timothy Geithner = great insight!
The modules on the response to the crisis & responding to future crisis are key! It was great to revisit my thesis done many years before this course I did in 2018 and connect the dots further. They recently added a module on how Sillicon Valley Bank was solved in 2023 which is a great study case, so the course keeps getting updates.
📊 The Consumer aka People 📊
👉 the American consumer surprised economists again & again after the Covid outbreak as spending kept trending up & up … the job market helps a lot for sure …
👉 we know & often hear that the Consumer (Consumer Spending) is 70% of the economy - I would extend that and say that the Consumer IS THE Economy with our collective decisions to spend, save & invest. It usually drives growth during economic recoveries (pandemic rebound) and is key for overall economic growth …
👉 people are now out & kicking: holidays, consuming & investing …
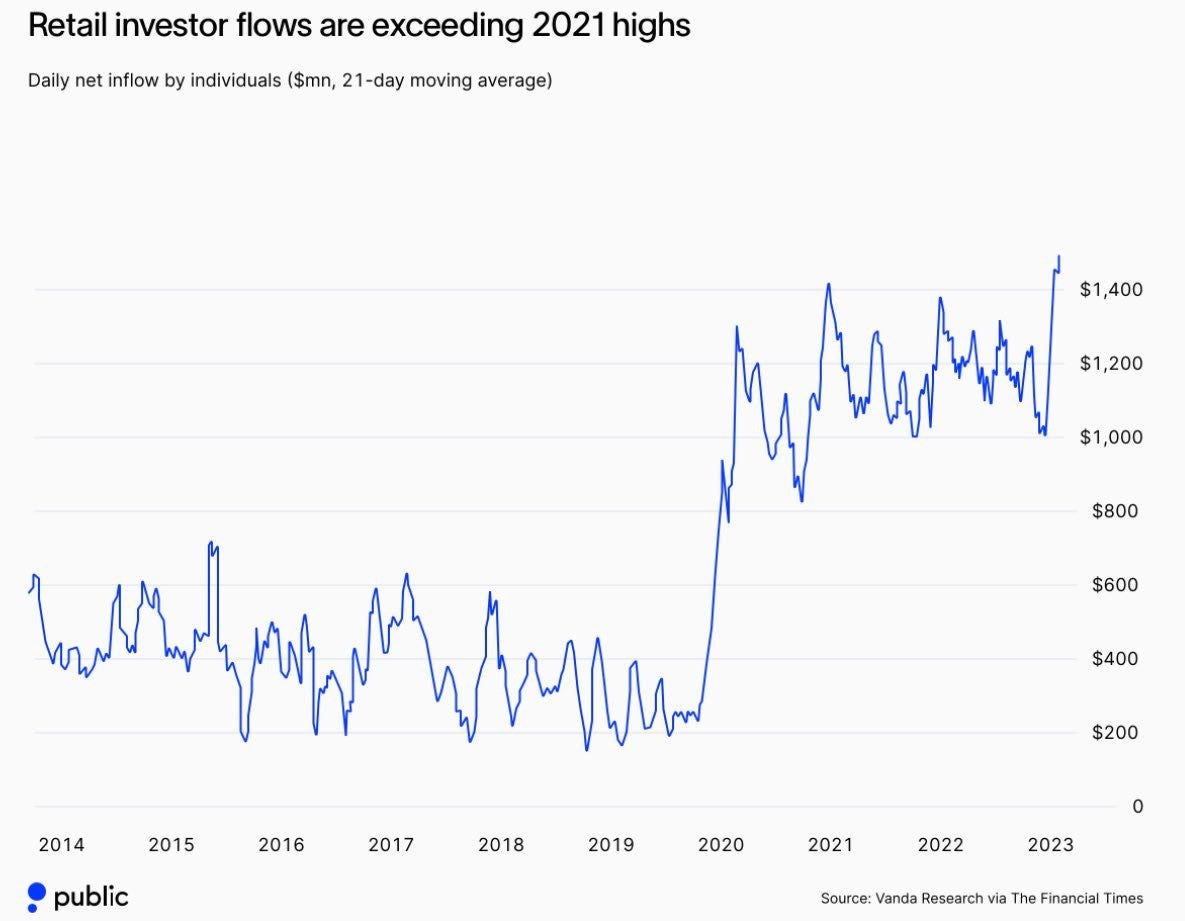
Investing wise, retail investors with an even bigger appetite than 2021 crazy highs: last month they poured on average $1.51bn/day into the US markets, which set the highest amount on record …
so it seems buying even while having holidays ;)
if consumers were in bad shape, I doubt would be spending & investing like now
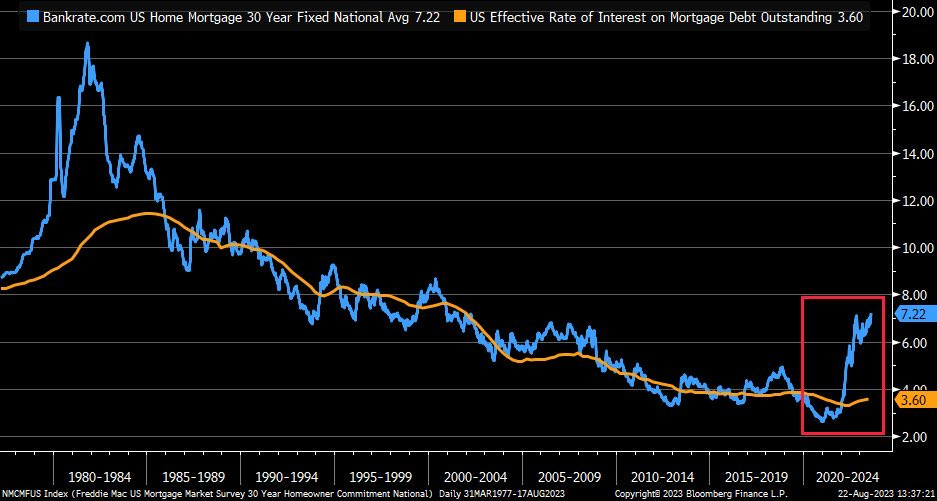
Recall the high mortgage rates from above? How comes it does not eat into the households & consumers pockets as they keep spending on and on?
average mortgage rate for CURRENT outstanding mortgages is just 3.6% (orange) & note the disconnection with the current 30-year fixed average at 7%+ (blue)
note also how the current mortgage rates have been trending down for decades, hence high real estate prices should not be surprising
Plenty of headlines say the ‘Consumer is in bad shape’: that it is squeezed by the FED’s high rates, inflation, but let’s look at a key chart that is not much mentioned: US Households: Checkable Deposits & Currency Held for insight into the liquidity position of households (amount of funds individuals hold in readily accessible forms).
👉 After the government fiscal stimulus, I do not see a bad shape, but a big cash reserve that went up from $1 trillion in 2019 to $4.5 trillion now. This amount equates to $17k per each US citizen for more than 4x cash today than available pre-pandemic.
👉 recall, that is after a pandemic, a recession, inflation, fastest FED hiking cycle in decades, war in Europe & recent banking turmoil
👉 just like with the job market, there is a big cushion here as well
📊 Inflation 📊
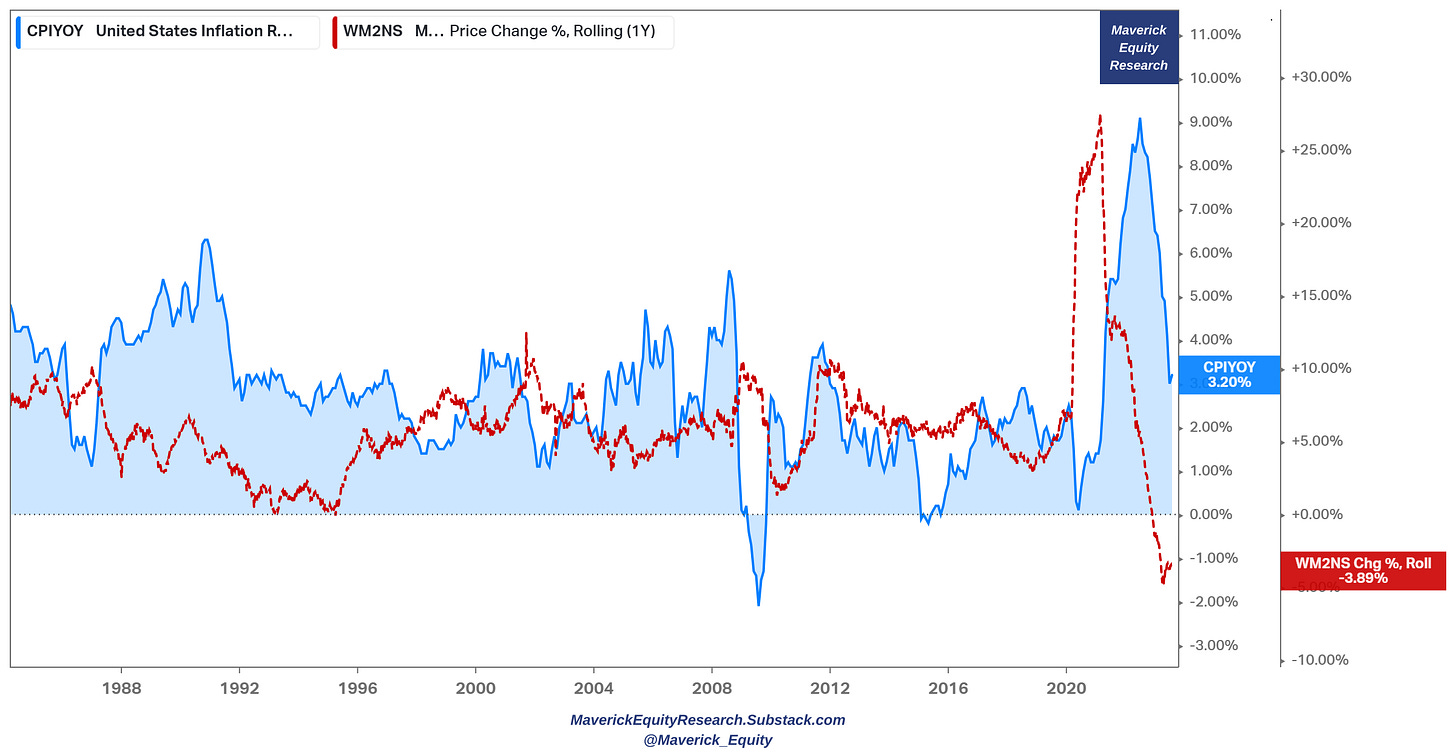
After peaking in June 2022 at 8.9%, inflation reversed and fell to 3.2% following the key driver M2 money supply growth rate at -3.89%. The latter turned negative in Q4 2022 for the first time since 1933. Yes, almost a century! Let that sink in! …
Therefore, if inflation is primarily monetary phenomenon (which is in my opinion), how could it not keep going down? US CPI Y/Y (blue) & M2 growth Y/Y (red):
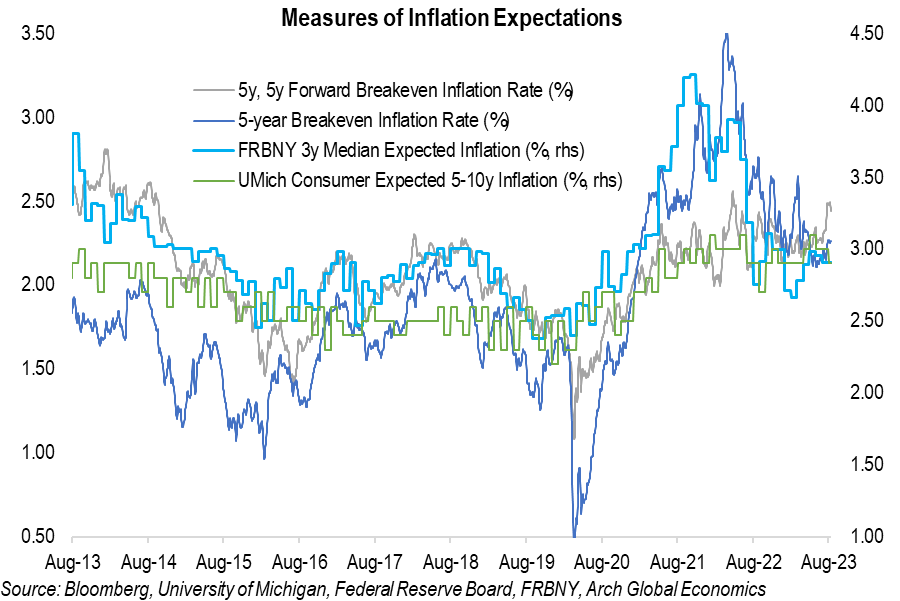
Inflation expectations in 1 chart: about 3% via various technical measures:
Complementary, US consumer inflation expectations via household surveys in order to depart from finance technical measures. Recall, the consumer is key & the economy!
University of Michigan inflation expectations survey: 1 year and 5-10y ahead
NY FED survey: 1 year and 3 year ahead
Takeaway:
👉 the NY Fed’s US consumer inflation expectations survey tells a very similar story to last Friday’s University of Michigan price expectations data: going down!
👉 despite rising gasoline costs, consumers think inflation more broadly will continue to slow
👉 bonus: the Fed has got to be happy also with that
N.B Inflation special report coming out soon from my side … stay tuned!
👍 What is driving the recent higher US Yields? 👍
We saw above the mix of:
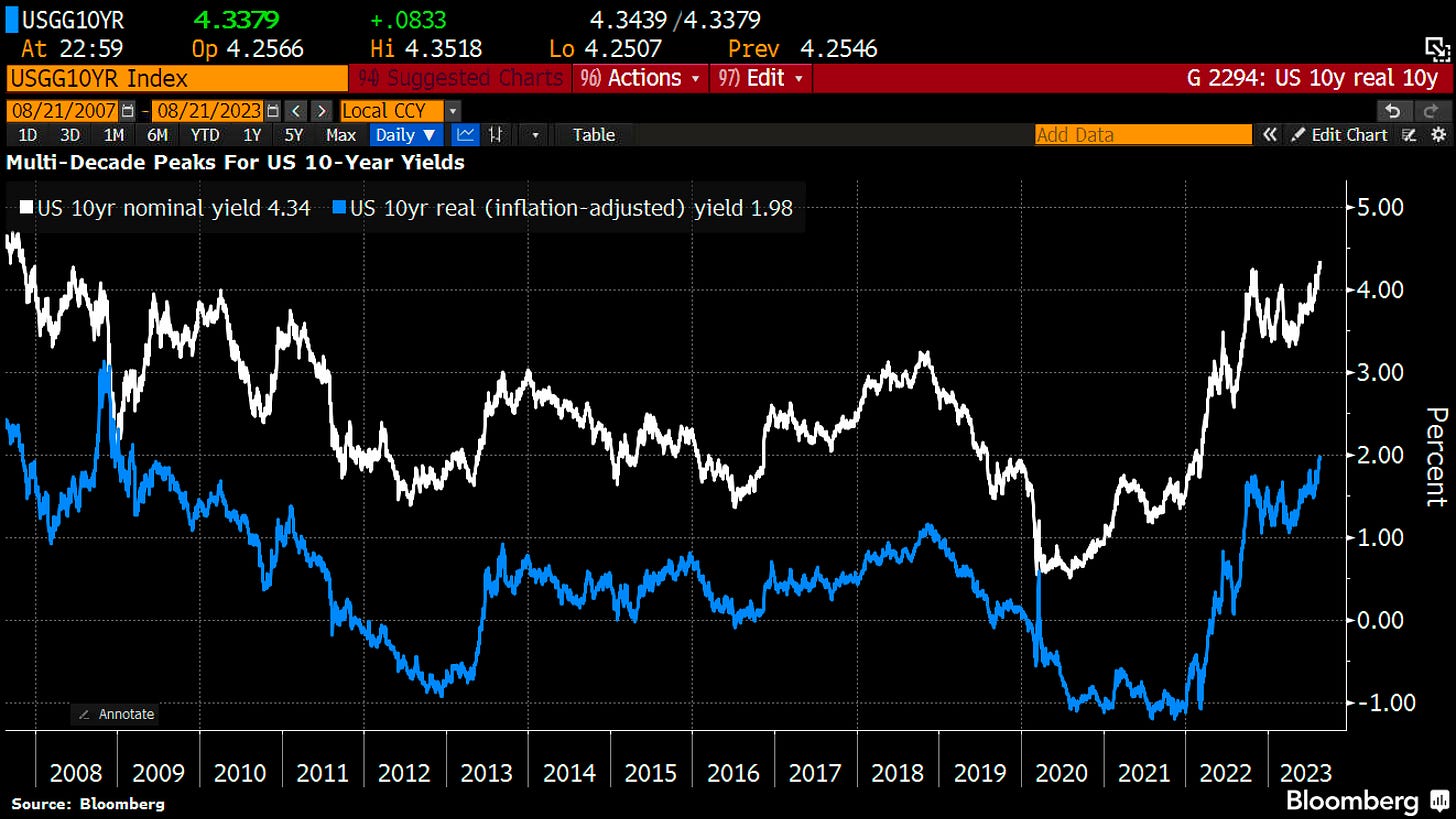
rising nominal yields, at a 16y high
+ falling inflation (actual & expectations) which means that we have
= higher real yields, the highest since 2009 looking at the 10-year yield
Rising real yields signal a firmer growing economy = lower probability of a recession
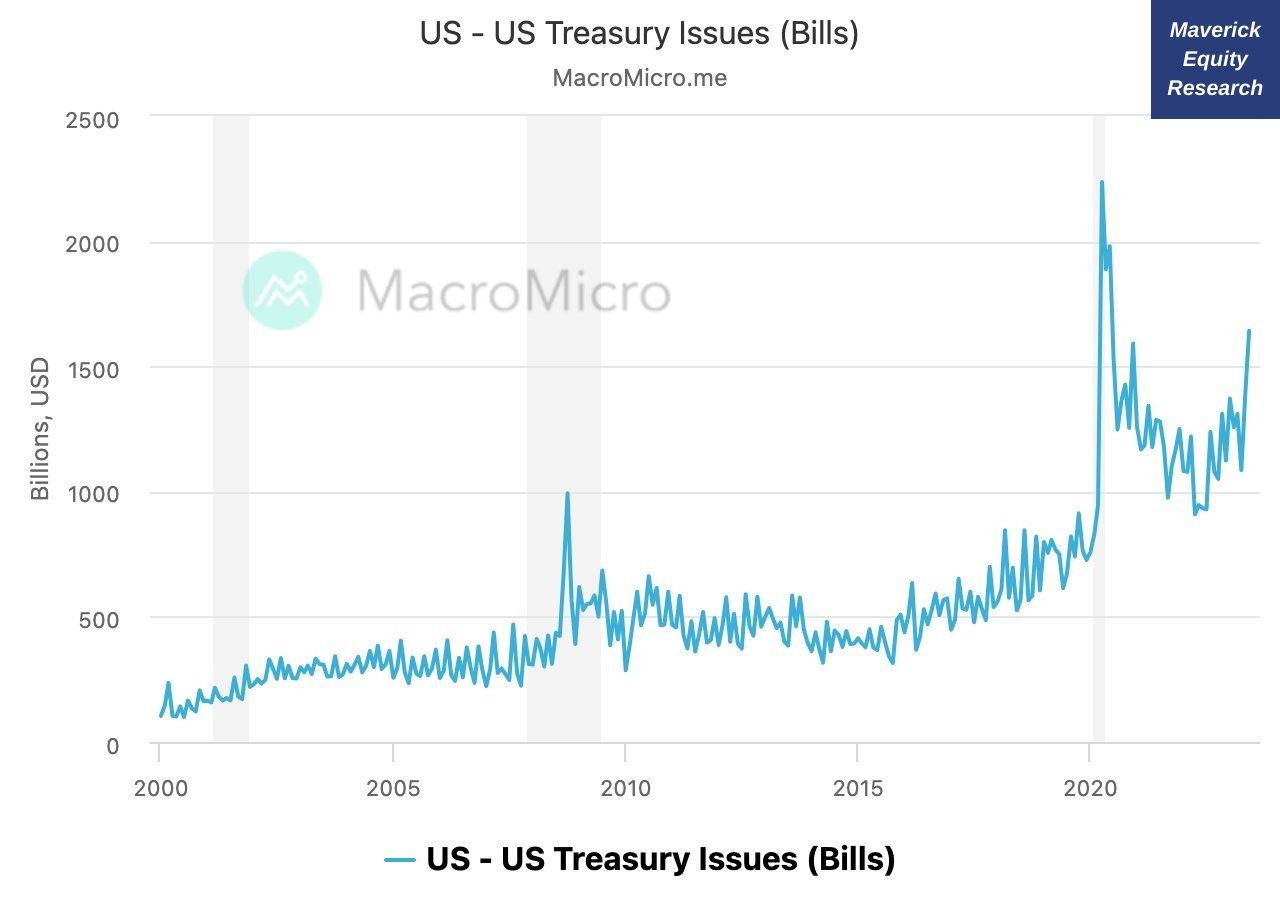
Along a stronger economy, higher yields are also due to higher deficits through the issuance of Treasury securities - T-bills wise they marked recently a 3-year high:
To sum it up: recent higher yields are a function mainly of GDP growth and new supply/issuance of treasuries, and not because of higher inflation imho.
👍 Bonus: Recession talk 👍
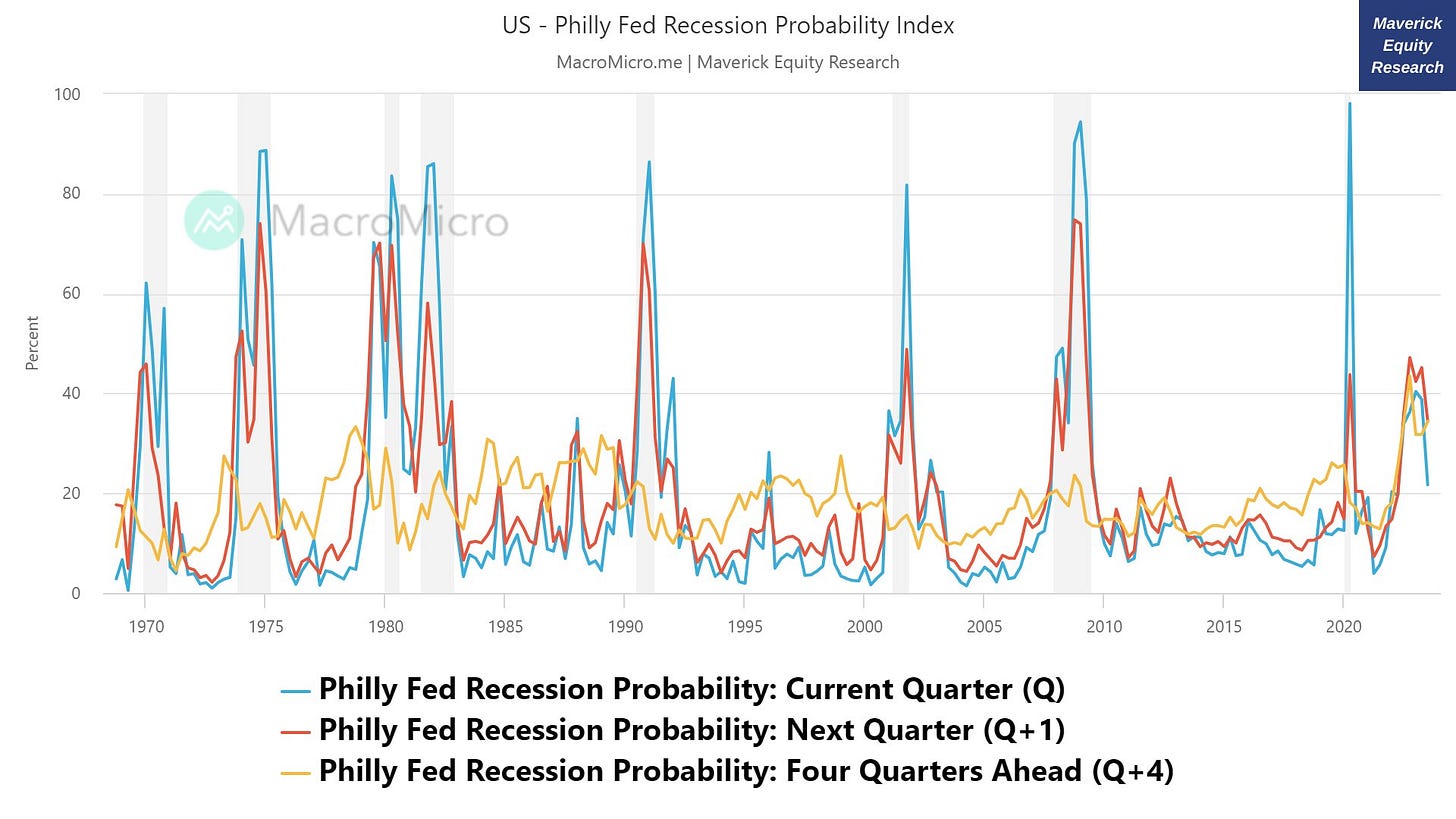
👉 Since the 2022 bear market in both stocks & bonds, we had ‘the most anticipated recession ever’ via the Philadelphia FED tracker which started in 1968:
in 2022, 43.5% of the professional forecasters believed a recession was coming (social & traditional media full with gloomy headlines also for clicks & ad money)
yet it didn’t and expectations keep shifting: from Q1/Q2 2023 to Q4 2023 / Q1 2024
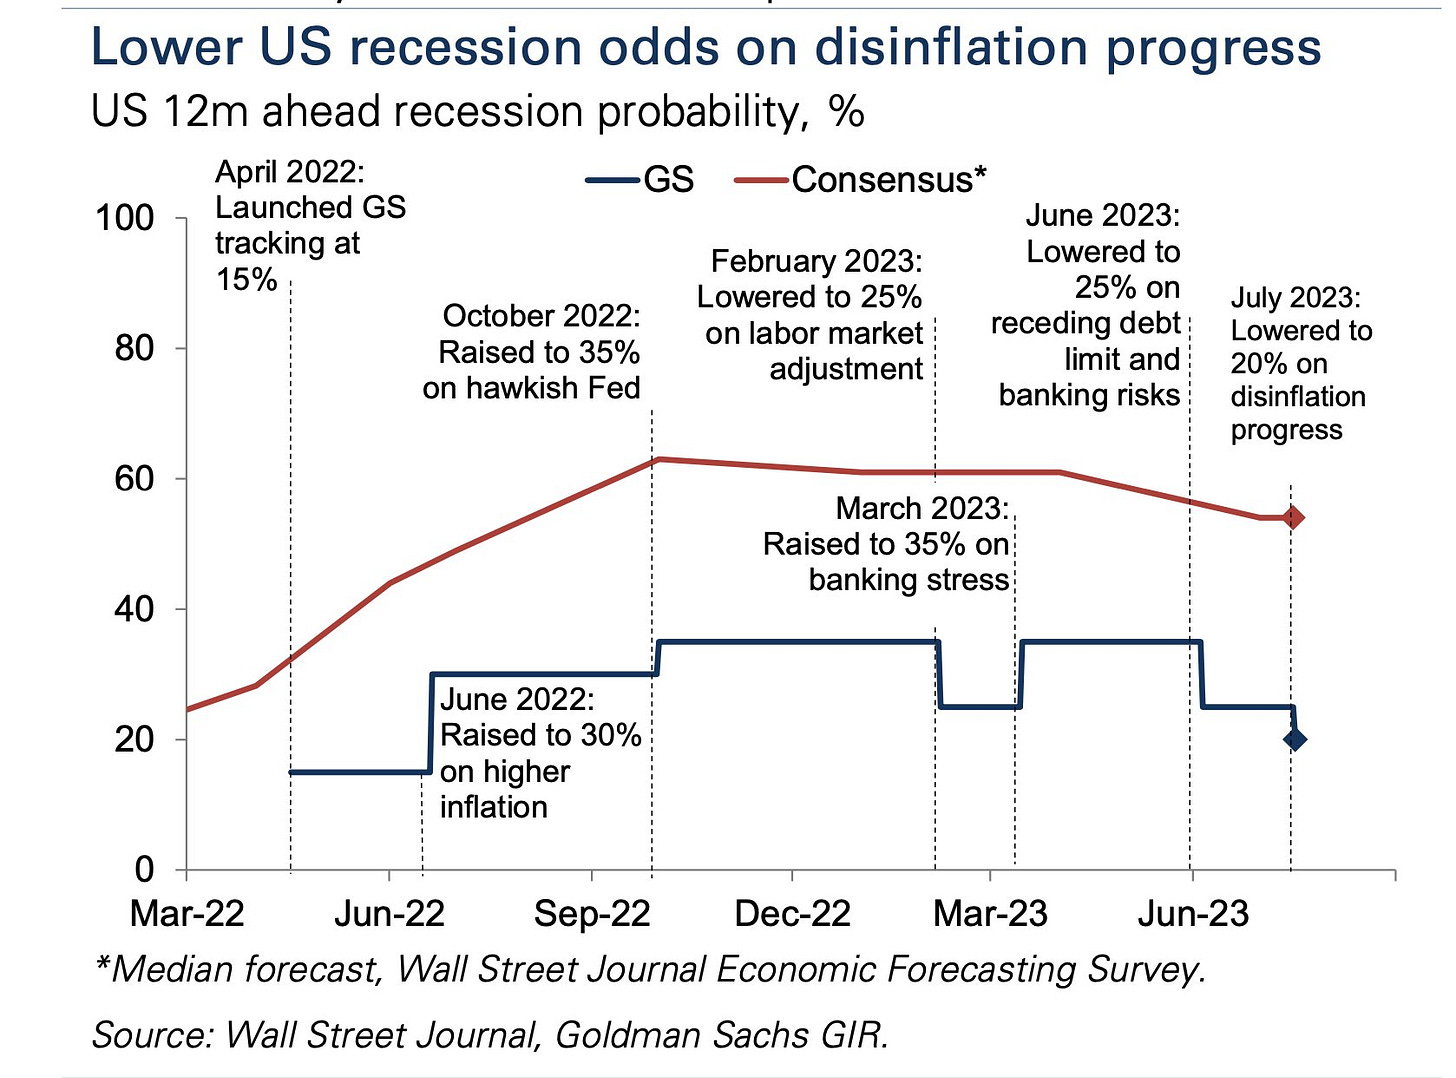
Below the most recent 2023 updated chart which shows the odds are way lower:
👉 FED view: during the press conference following the July FOMC meeting, Chairman Powell also indicated that staff economists no longer forecast a recession
👉 Goldman Sachs assigned lower recession odds via the disinflation major progress
👉 I am into the no recession/soft landing camp. A very common question I get is: ‘What metrics and/or models you look at to track the business cycle and the likelihood of a recession at any point in time?’ Well, there are many out there that I look at and use: one day I will compile all of them into a comprehensive article and overall framework.
Nowadays, among many other I look particularly at the following four:
Real-time Sahm Rule Recession Indicator: due to historical low levels of unemployment rate, the Indicator is not signaling a recession
Background: FED economist Claudia Sahm approach - if the 3-month moving average of unemployment rate exceeds 0.5% compared to the previous year's low, the economy is in a recession or will enter one soon (condition met in past recessionary periods).
NBER Recession Indicators Drawdown: no sign of recession here
FED Excess Bond Premium Recession Probability: 21.72% current probability has seen a slight increase this year, but dropped from the 27.59% last reading and hasn't reached close to levels observed during crisis periods
FED Financial Conditions Impulse on Growth (FCI-G): after heavy tightening of financial condition in order to cool-off inflation, financial conditions are way less tight and expected to have only a 0.1-0.4% drag on GDP growth over the next year
Main takeaways on the Recession talk, from nowadays but also for the future:
👉 The business cycle is the business cycle: I learned about it in the 10th grade at the Economics basics class and we have no reason for it not to be valid going forward:
every 6-8 years we do get a recession - since WW2, 6.5 years to be exact
since WW2, recessions last an average of just 11.1 months
the last economic expansion: started after the 2007-2009 GFC & lasted 10.6 years
👉 Implications of a recession vary with each individual situation, my key notes:
as an entrepreneur: hiring, CAPEX/investment and other major business decisions
as a trader: risk management, hedging, liquidity
as a medium-long term investor it really does not matter much as long as one has a solid portfolio i.e. owning stocks should be treated like they truly are, pieces of business, not moving tickers on a screen (never confuse investing and trading)
I was DOWN 52% during the 2007-2009 GFC & that bear market lasted almost 2 years, 2020 Covid indiscriminate selling & the 2022 bear market was not much in comparison, hence it shall be easy to go through the next one as well
Remember, the market is structurally net long that is often forgotten or not known!
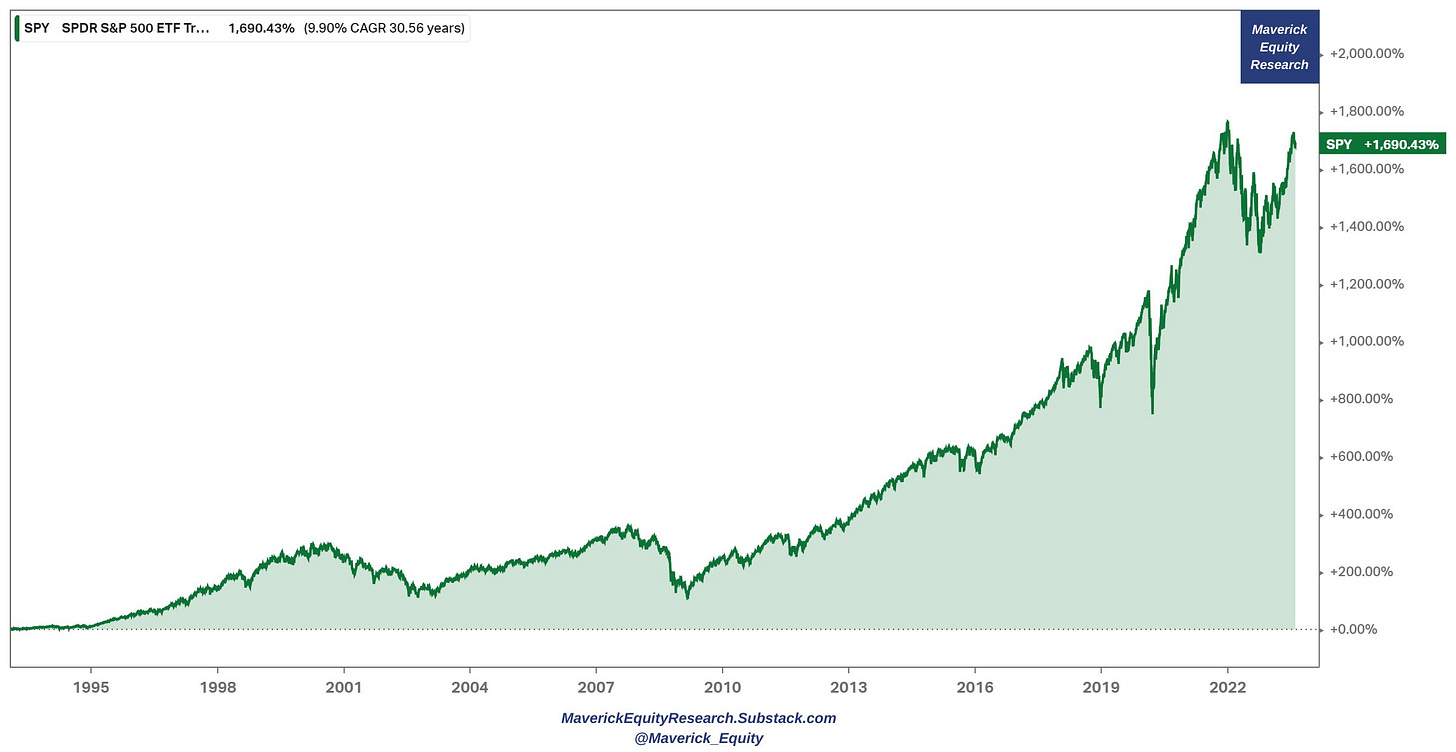
👇 S&P 500 last 30 years: 1,700% return with 10% CAGR 👇
This research is NOT behind a paywall & there are NO pesky ads floating around.
Did you enjoy this extensive research by finding it interesting, saving you time & getting valuable insights? Now some of you asked how can one support me which is really kind of you 🤗. Therefore, it would be great & highly appreciated if you would support an independent investment researcher for the ‘Maverick-esque’ ongoing & future research. A donation or a tip to support my work can be done via the following:
Thank you & have a great day!
Mav

















Great work! I really liked how you visually presented all this data👍
Well done Mav! Great data. Keep it up!