✍️ The State of the U.S. Economy in 75 Charts, Edition #3
GDP, Job Market, Consumers, Interest Rates and Yields, Inflation, Real Estate, Sentiment, Recession Talk: Leading Indicators, Probabilities and 2024 Outlook! Sleek charts that say 10,000 words ...
Dear all,
welcome to the 3rd edition covering the US economy via the macro lens, a further improved independent research report with some even more sleek Maverick charts!
Structured: 8 parts + Bonus and designed to be a very comprehensive and inclusive report. The bonus section is dedicated to Going Global Beyond the US economy. Hence, grab a cup of green tea, absorb and enjoy this thoughtful research piece.
Frequency: 4 editions / year and occasionally special reports on top when needed.
Connecting the dots: combining Bottoms-Up industry and company fundamental analysis with a Top-Down macro framework. Specifically, my Macro research as an overlay to my S&P 500 Research Reports, Maverick Charts, Full Equity Research (starting in 2024), and to the general topics for a comprehensive independent research.
Delivery: Macro made simple by breaking down complexities for key insights and takeaways delivered via sleek Maverick charts. This aims to be a key research report, and as well what most people need from the Macro side. How do I know that?
👉 I used to do from the Strategy side a similar Macro dashboard for the CEO and Board Members of a bank and trust me, they don’t waste time nor lack reading stuff
👉 delivered via plain English a’ la the "Margin Call movie scene: Explain It To Me!" because the movie scene resembles reality: as a professional in any field you are at a huge advantage if you can explain things clearly to the widest possible audience
The differences: no power point, less formal, banking dashboard connecting the dots from the Macro side to the bank’s strategy with all the big short & long-term projects, had the internal macro view and when details were needed, Macro team would do it.
Hence, use this Macro as a dashboard where you connect your own precious dots!
Overall at times maybe controversial, but as long time readers know it well by now, here it is all about ‘Maverick-esque’ independent research, not a place to please some view, headlines, BS, or sugar coat one side or the other 😉.
The structure with the table of contents and key highlights can be enjoyed already. Feel free to jump to your favorite section as each has at least one dedicated take-away, yet I recommend following this order / logic:
📊 GDP growth: +1.3% Q1, +3.1% Q2 as near-term GDP growth estimates look good
📊 The Job Market: not crazy hot anymore, but still strong
📊 The Consumer aka People: out & kicking strongly: holidays, consuming, investing
📊 Interest Rates & Yields: peak rates & yields rather sooner than later
📊 Inflation: cooling off continues, cooling off aka normalising
📊 Real Estate, Mortgage Rates: mortgage rates set to cool off as well
📊 Sentiment: CEO’s strong, Consumers between perspectives and perceptions
📊 The (R)ecession Talk - Leading Indicators, Probabilities and 2024 Outlook: low probability, 1.5% - 2% growth in the cards
👍 Bonus, Going Global Beyond the US Economy: 2% - 2.5% growth in the cards
👍 Main Maverick Takeaways, for both the Economy and for the Future in General: keep compounding, keep compounding … your people, capital and overall experiences!
This research report is free cost wise for you, and as well ad-free and clickbait free. What would be appreciated from your side? Just sharing it out there, thank you!
📊 GDP growth 📊
Q1 2024 real GDP: the economy grew at a more modest pace by 1.3% in Q1 2024 as per BEA’s second estimate from May 30th, and after a strong 3.4% in Q4 2023
👉 Q1 increase primarily reflected increases in consumer spending, residential fixed investment, nonresidential fixed investment, and state and local government spending that were partly offset by a decrease in private inventory investment. Imports, which are a subtraction in the calculation of GDP, increased
👉 note the 2007-2009 recession, and also the 2020 Covid stop & go big swing
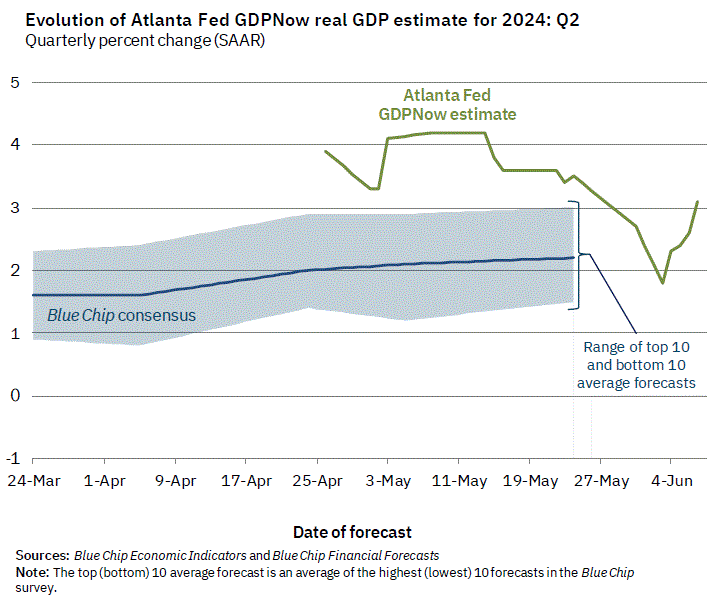
Q2 2024 real GDP: +3.1% (q/q) via the June 7th GDPNow Altanta FED estimate
👉 the 3.1% (green) is higher than the BlueChip consensus at 2.2% (blue) while the top/bottom 10 average forecasts are from +1.5% to +3% (light blue range/interval)
Maverick take-away:
👉 I aim for a 2% growth in Q2 (in the middle) … while simply, if it’ll be the 1.5% lower range, or the 3,1% estimate, that’s still good … heads we win, tails we win!
Zooming in to see the U.S. states GDP growth distribution via the Philadelphia FED State Coincident Indexes as of April 2024
👉 over the past 3 months: the indexes increased in 46 states, decreased in 3 states, and remained stable in 1
👉 in the past month: the indexes increased in 43 states, decreased in 4 states, and remained stable in 3
4. The general 3-months and 1-month diffusion indexes for the entire US economy
👉 general 3-month diffusion index of 86 from 82 previously
👉 general 1-month diffusion index of 78 from 80 previously
Maverick take-away:
👉 the US and vast majority of states are seeing positive values in their coincident economic indicators (i.e. no current recession) which is telling us the same message as complementary with the previous GDPNow Altanta FED estimate
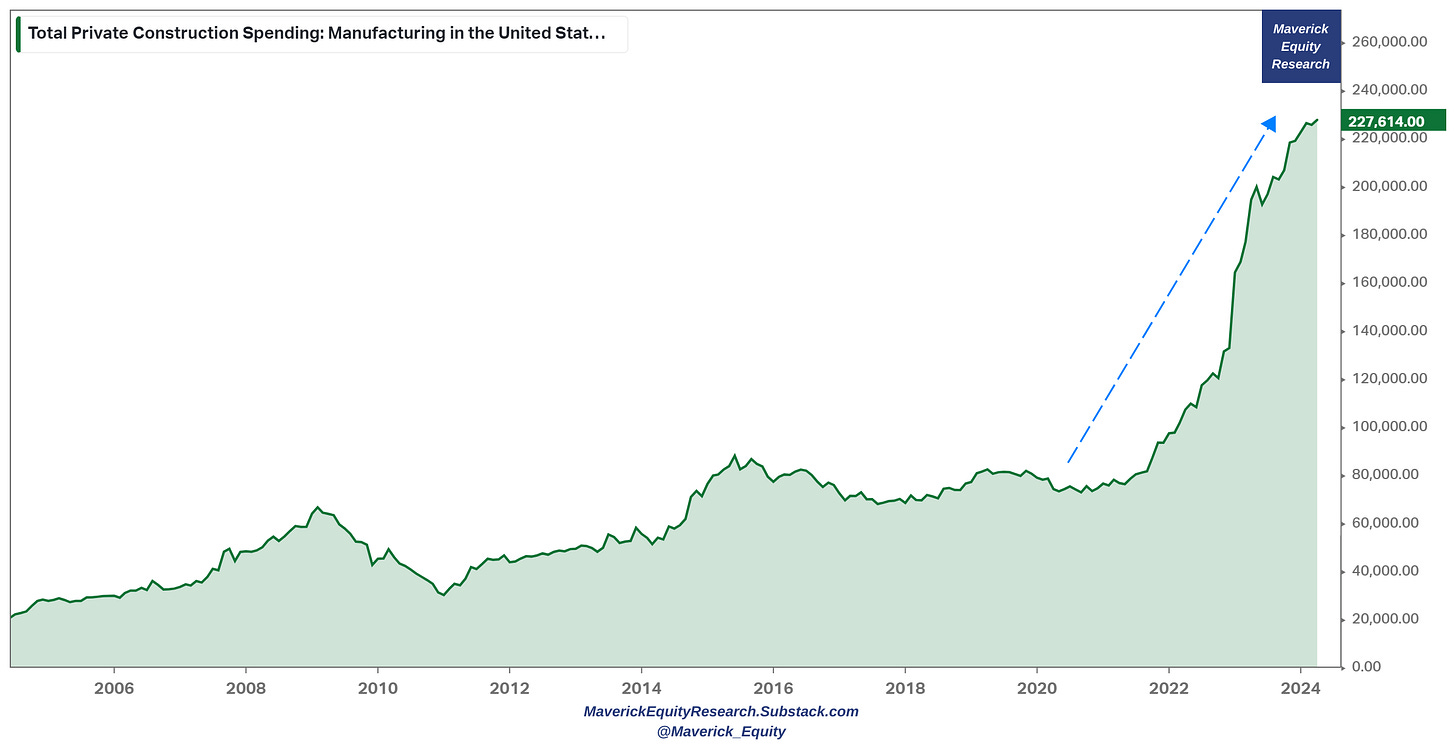
Manufacturing baby, manufacturing! Total Private Construction Spending
👉 soon 3x since 2020, let that sink in! Quite a why the economy is doing well imho
👉 note: JPM's Jamie Dimon on the US economy said recently “Basically, it's booming.”
Let that sink in ... and ... bring the sink if you wish!
What about business investment activity? It is UP as well:
👉 New orders for non-defense capital goods (excluding aircraft) with a very sharp rebound since the 2020 pandemic, and currently at a high level of $73.79 billion - while the growth rate slowed down, it still signals strong confidence looking ahead, hence a positive outlook and economic strength in the months to come
👉 new orders for non-defense capital goods is also known as ‘core CAPEX’ or simply put ‘business investment’ … so that you can connect the dots and/or do not get confused with other research or media reports
N.B. core CAPEX is regarded as a key factor driving the economy and one of the leading indictors of business activity / business CAPEX … hence to be monitored for any big swings be it up or down … see how it related to the business cycle with the grey bars showing the recession periods
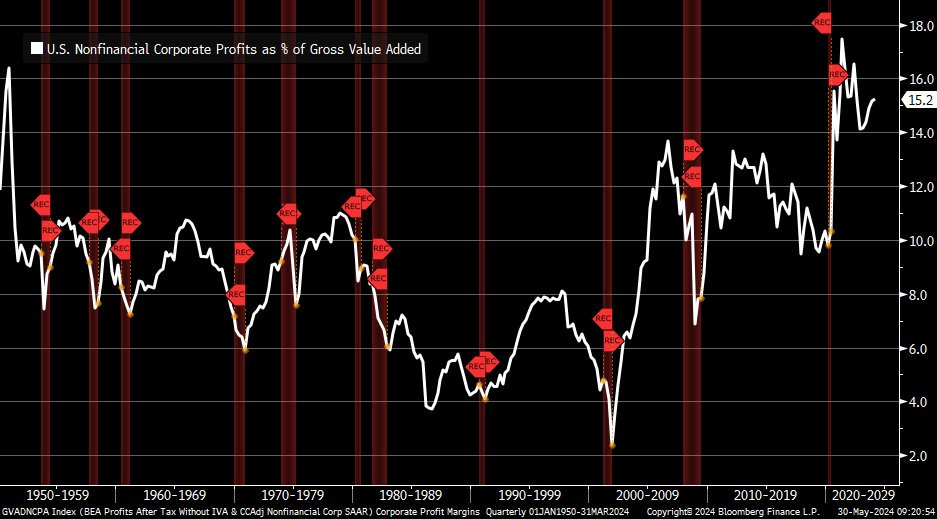
US economy-wide profits and S&P 500 operating profits
👉 very good, not just recovered after the 2020 pandemic, but way above now
Profit margins wise, they rose to 15.2% in Q1 2024
Complementary, how do corporations manage the high interest rates? Very well!
👉 Corporate net interest costs stable despite rising FED funds rate
👉 Corporations were smart by locking in low rates, and moreover now they get a good yields on their cash balances
Stagflation as the most recent ‘hot’ theme & headline: is it here or incoming? No, and very unlikely anytime soon …
As soon as the lower GDP headline & hotter inflation data came out, the ‘Stagflation’ narrative and headlines via news stories went simply parabolic to June 2022 levels! Back then, that was a highly expected via one of the most anticipated recessions ever (which did not come) coupled with the expected inflation post-Covid driven by huge monetary and fiscal stimulus (which did come)!
I believe the fears for stagflation are overblown, we do not have that now for sure while going forward, quite unlikely as well. What is my rationale you might wonder? Before that, Stagflation 101: that is an economy with a low/stagnant or negative growth (low demand), high inflation and high unemployment.
👉 1.3% real GDP growth isn’t stagnant, but very close to the 20y average; moreover, recall from above the +3.1% latest 2nd quarter GDPNow estimate via the Atlanta FED
👉 despite a recent small uptick in Inflation data, the overall actions and directions are solidly pointing out that the around 2% inflation target will be met - working now in parallel to a deep dive report on specifically Inflation … stay tuned
👉 unemployment is hovering at all-time lows and the labor market is still strong
As FED Chairman Jerome Powell said just recently when also asked about Stagflation:
“I don’t see the Stag or the ‘flation’ actually”
Additionally, parallels from today to the 1970s stagflation are quite off the mark:
oil at 78 is not an alarming level, it is actually below the 3-year average of 81
even if it would to up a lot, the economy today is way less dependent on Oil, energy costs overall less of an issue for consumers overall given the decent disposable income data … and same for businesses overall …
stagflation just does not happen without some big supply-side disruption
the labor market is very strong with even many unfilled jobs, and
the FED has a way better understanding and tools to manage the economy
Maverick take-away:
👉 things are looking decent: investment activity is up, corporate profits are good, high interest rates are manageable, no stagflation in sight
📊 The Job Market 📊
Unemployment Rate (UR) = very low 4.0% - a bit higher lately after the 3.4% in April 2023 when it was the lowest since 1969, yet continues to hover near the 50-year lows
👉 materially below the 35-year median at 5.72% (blue), and before this month when at 3.9% it was below 4% for 27 straight months which equates to the longest streak since the late 1960s
👉 the unemployment rate never got lower than 4% once in the 1970s, 80s or 90s
👉 who would have imagined that after the 2020 Covid panic (bigger even than the 2007-2009 GFC) that we will recover that fast? Amazing what the economy can do!
Unemployment Rate with Nonfarm Payrolls combined for further insight:
👉 Nonfarm Payrolls at 272k from 175k previously (NFP = jobs added or lost across a wide range of industries, excluding agricultural jobs, about 80% of total jobs)
2 key notes:
👉 the rule of thumb = a monthly increase of 150 to 200 thousand indicates that the job market/economy is strong (when the economy is weak, NFP turn negative before unemployment rate rises, hence NFP can be seen as a bit of a leading indicator)
👉 we mark the 40th straight month of job gains, hence a robust demand for labor!
Same chart, but shorter time series since 1990 for 2 reasons
👉 for a better zooming into the charts of the 2 time series (better readability)
👉 more representative business cycles: economy before 1990s aka before the internet was less flexible (no gig economy), different structure/composition (energy vs oil) etc
Initial and Continuing Jobless Claims
👉 Initial Jobless Claims (people filing for unemployment benefits) up to 229k, back to the 2019 pre-pandemic level and way below the 514k 5-year average
👉 Continuing Jobless Claims (1-week lag metric, people on unemployment benefits for a while) also back to 2019 levels with 1,792m and below the 3,770m 5-year average
Job Openings ‘JOLTS’ (Total Nonfarm) - key metric of labor demand/job creation
👉 8 millions of available jobs ready to be filled
👉 1 million extra jobs out there compared to pre-pandemic levels
👉 3.5 million jobs added relative to the pandemic bottom
Maverick take-away:
👉 the recent drop is material while still my view on it is positive & simple: it's a plus reserve to have that many jobs ready to be taken / a lower cushion but still a cushion. A lower job creation pool isn’t the same at all to a major downturn.
👉 N.B. the FED wants a bit looser of a job market in order to chill a bit with the fastest hiking cycle in recent decades … and continue the inflation cooling off process
For further key insights into the job market & the FED, a closely watched one by FED Chair Powell & other FED leaders as one of the key factors driving inflation: Job Openings ‘JOLTS’ (green) & Unemployed People (red) as a telling visual if the job market is at any point in time ‘loose’ or ‘tight’
👉 2007-2009 GFC created a ‘loose’ labor market with many unemployed and not that many jobs and it took a while to balance things out
👉 during the 2020 pandemic, the movements were off the charts …
👉 while these days, we have a ‘tight’ labor market after a great & fast recovery as the economy not just recovered the lost jobs from the pandemic but added way more
Maverick take-away:
👉 available jobs are decreasing materially yet still very solid, while combined in this chart with the very low unemployed people makes for a tight labor market - while not a ‘secularly tight’ job market anymore, yet still tight … hence the FED did not cut yet!
Job Openings to Unemployed People (ratio of the 2 above): at a nice 1.24x!
👉 job vacancies still exceed the number of unemployed by more than 20%
👉 after peaking at a crazy 2x in 2022, just back now to the pre-pandemic levels
👉 simply put, we have 1.24x job openings for every unemployed person = historically a great time to be looking for work and negotiating a decent salary ...
Maverick take-away:
👉 the ratio going down lately helps cool off inflation via the wage pressure channel
👉 1.24x is a plus / reserve & one of the most obvious signs of excess demand for labor
Fun / key fact: the FED and this ratio - in the February 2023 FOMC meeting, Powell noted there were as many as 1.9 job vacancies per unemployed person, showing that the job market was still very strong, while the unemployment rate still at a historical low, which was a key reason why most Fed members continued to support further interest rate hikes & stated that high interest rates should be sustained for some time
Next, does this from above translates into reality via wage growth?
Yes, a solid +4.7% wage growth for March 2024 (5% in February) which is a driver of inflation overall, but also for consumers a hedge against inflation
👉 income from labour = the primary funding source of all consumption
👉 when that does well, consumer spending will naturally follow, especially nowadays when we have higher wage growth than the inflation rate, hence real growth in wages (more on the consumer below when I cover the consumer in the next section)
And now the Job Market via 1 Maverick Chart on Steroids for 10,000 Words
From above: Nonfarm Payrolls (green): 272k and Unemployment Rate (red) = 4.0%
Adding 2 new key metrics:
👉 Nonfarm employment diffusion index (blue)
👉 Real-time Sahm Rule Recession Indicator (turquoise)
Maverick take-away:
👉 nonfarm employment diffusion index at 63% is quite above the 50% mark (grey dotted line) which signifies that over half of the industries within the employment population are expanding (conversely, if monthly nonfarm employment consistently falls below 150K to 200K jobs for several months and the diffusion index drops below 50, it serves as a warning sign) - another sign of the labor market strength
👉 Real-time Sahm Rule Recession Indicator (turquoise) = 0.37% from 0.3%
Insight: the unemployment rate (UR) typically decreases over an extended period and is considered a lagging indicator. A notable increase in the unemployment rate often signals that the economic correction has progressed to the middle or late stages. Therefore, it can be used alongside the Sam Rule recession indicator for leading observations: the Sahm indicator calculates the 3-month moving average of the monthly UR and subtracts the previous year's low UR. When this value exceeds 0.5%, it indicates that the economy is undergoing a recession ... not the case now!
Puzzle time - economists & market participants having a big one since a while:
‘How comes the labor market has been so strong post-2020 Covid and still is today?’
👉 Dhaval Joshi from BCA Research makes the argument for an imbalance between labor supply and labor demand: usually, demand is the main driver, yet in the post-pandemic world it’s been low supply … which might be running well below labor demand, and that possibly for the first time ever
👉 in such an environment, wages growth should not be a surprise, hence also contributing to inflation … and it’s well known that ‘wages are sticky’, meaning it’s hard to negotiate them down once people earned them
👉 the gig economy also made another leap higher with the pandemic given work from home, new types of jobs and overall more flexible business models where tech facilitates labor/jobs a lot
On the tech layoffs hot topic with many alarmingly for not much headlines, WSJ:
Complementary, CEOs are more upbeat on hiring after they saw the economy digesting very will the high interest rates we are having since a while already:
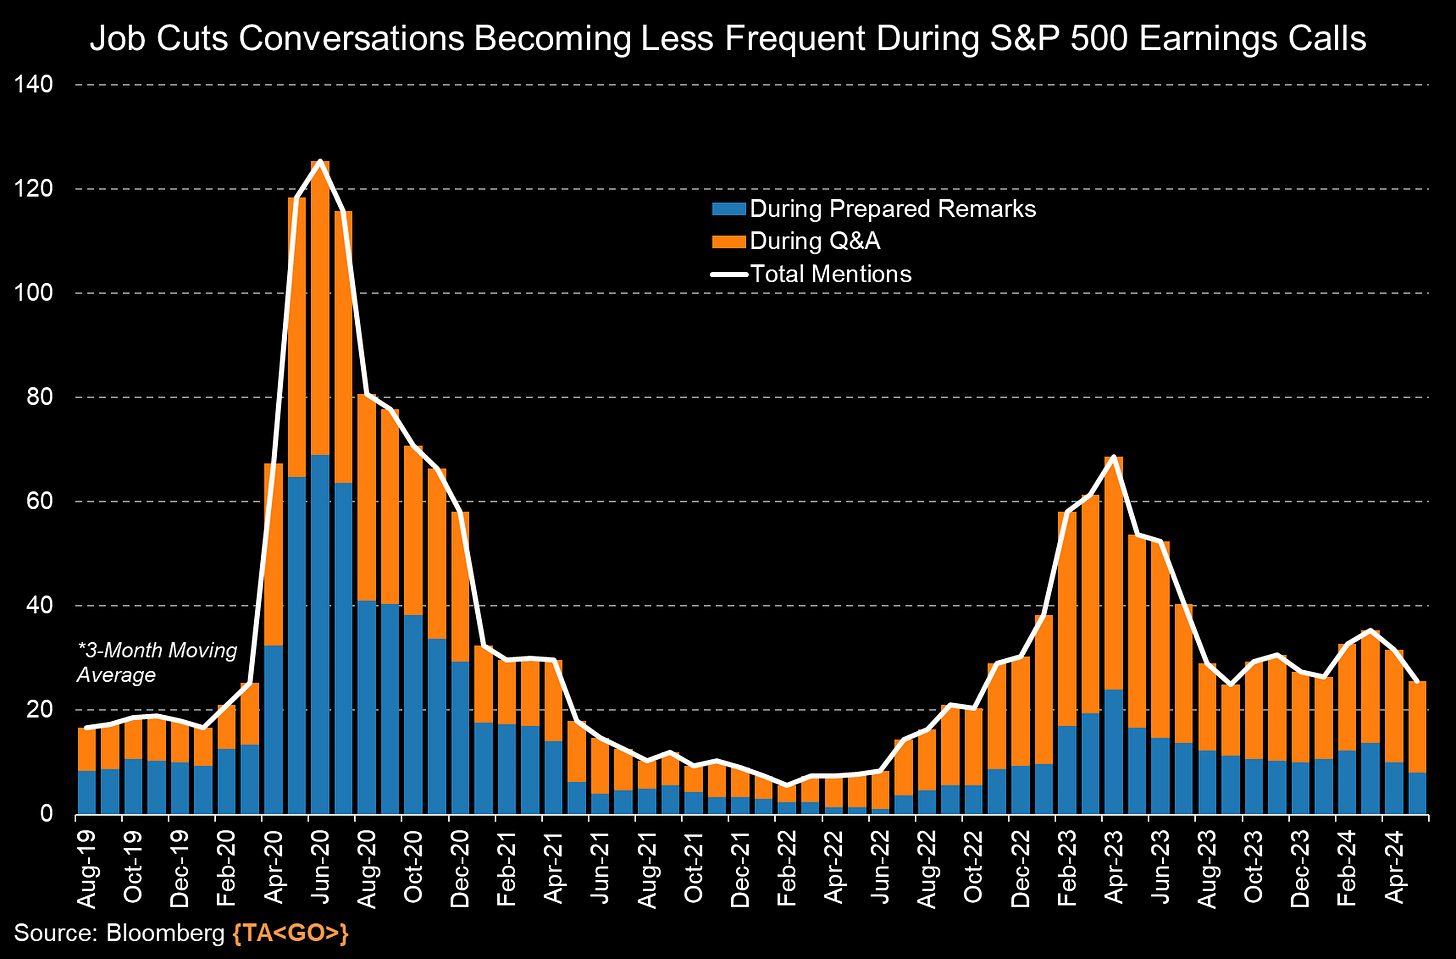
This is reflected also in the what I call the ‘job cuts chatter’
👉 job cuts conversations are becoming less and less frequent during the S&P 500 earnings calls via the the companies’ prepared remarks and Q&A with analysts
📊 The Consumer aka People 📊
Never Bet Against The American Consumer … ‘Bro!’
👉 the American consumer surprised economists again and again after the Covid outbreak as spending kept trending up & up … stimulus checks buoyed spending longer than anticipated … while the job market helps a lot for sure as detailed above …
👉 currently at $19.34 trillion with a +0.2% increase month over month in March
👉 we know & often hear that the Consumer (Consumer Spending) is 70% of the economy - I would extend that and say that the Consumer IS THE Economy with our collective decisions to spend, save & invest. It usually drives growth during economic recoveries (pandemic rebound) and is key for overall economic growth …
N.B. Personal Consumption Expenditures (PCE) accounts for about 2/3 of domestic spending and is a significant driver of GDP
Adjusted for inflation? There you go at $15.71 trillion
Digging further: Retail Sales, namely Advance Retail Sales since 2000
👉 the 2020 pandemic meant a dip given the overall stop, but check that rebound which not many at all did expect … while my fun and simplistic analogy would be:
'If humans engage in revenge s*x, why not engaging properly in revenge shopping 😇?' Mav
P.S. not sure about my behavioural economics analogy, but yeah, you got it …😉
Retail Sales growth (YoY) rebounding +3% after quite a cooling-off as expected when rates rise, especially how fast they did. Though, the same message applies:
Never Bet Against The American Consumer … Bro!
US Airport Traffic as cool alternative data via BofA
👉 Americans flying in record numbers over Memorial Day weekend … and note that the peak summer travel season hasn't even started yet
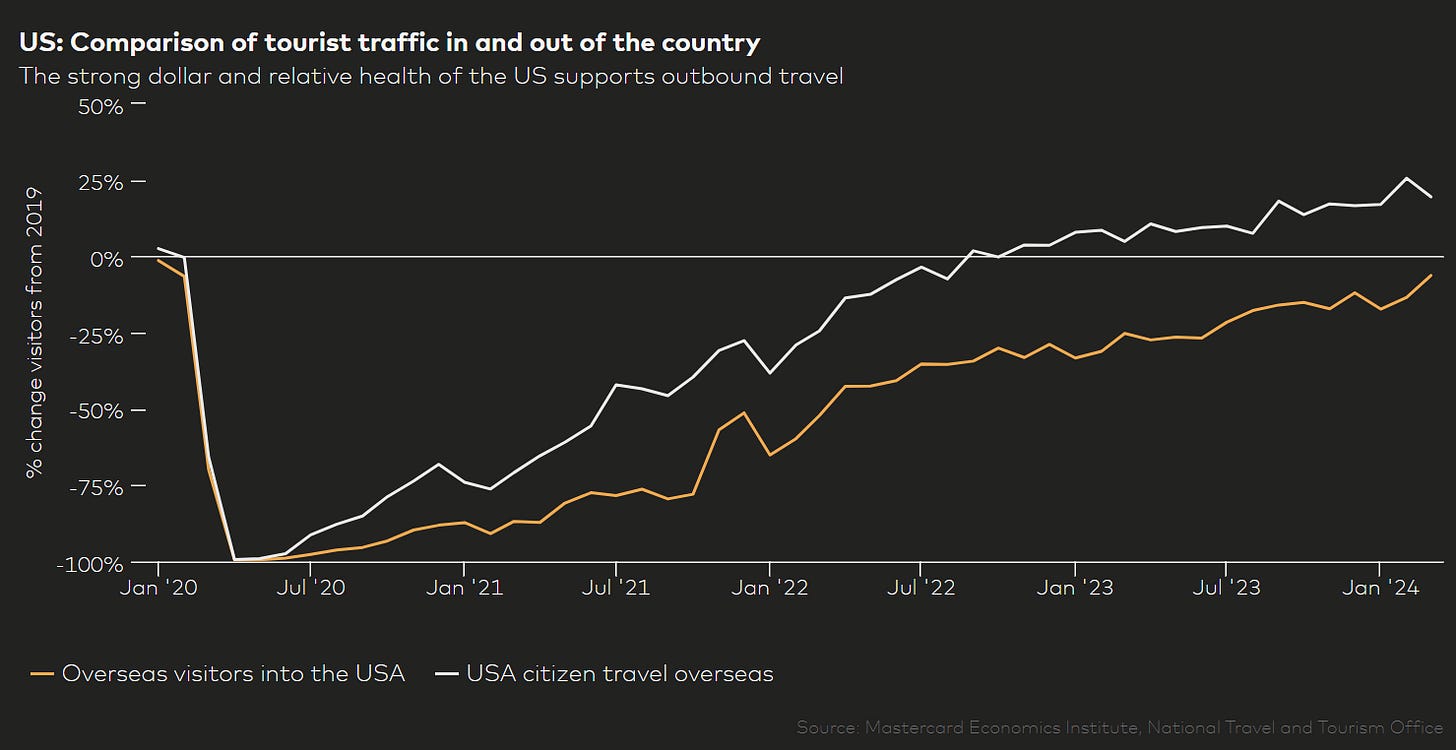
Consumers and travelling abroad
👉 A solid job market + a strong dollar = USA citizens travel abroad smoothly = 20% higher than the pre-COVID record
Moreover, in terms of consumer attitudes and buying plans
👉 1 in 5 of survey respondents plan to travel internationally over the next 6 months (a record high since the survey started in February 1967)
👉 during the same time in the 2020 pandemic, only 1 in every 20 Americans intended to travel … while for a better comparison with pre-pandemic times 2019? About 1 in 10
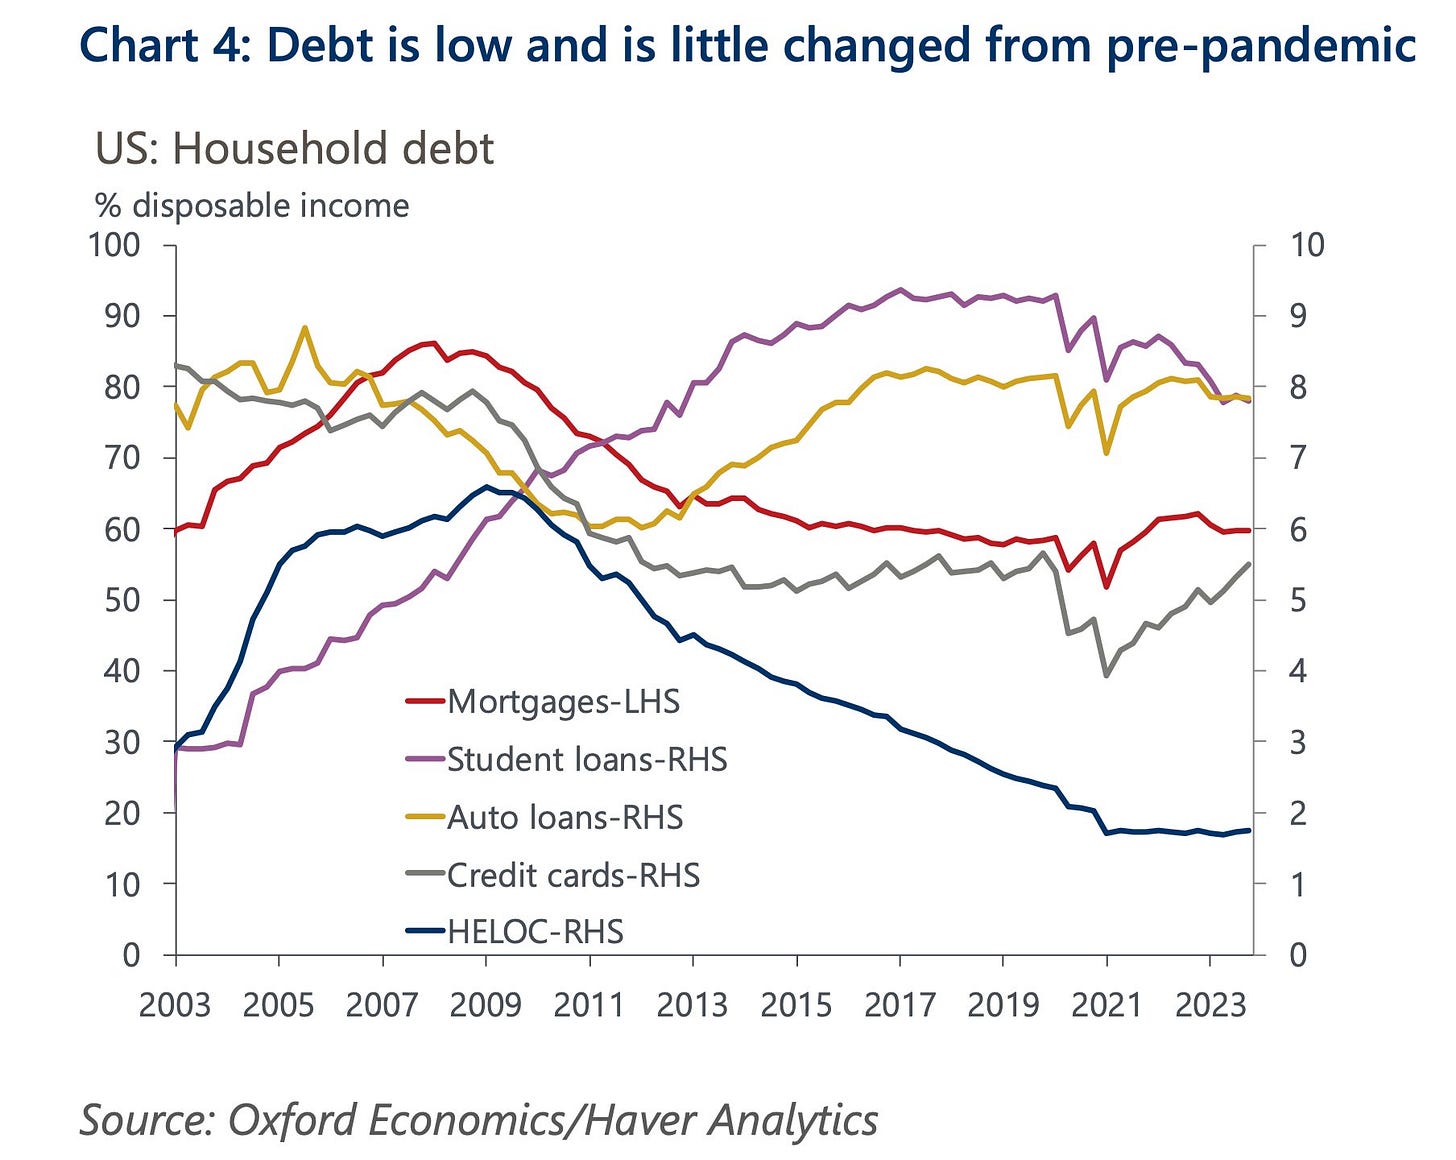
What about US Household Debt? It is LOW … and little changed from pre-pandemic times when measured not as an absolute level but as % of disposable income aka what is inside people's pockets ... . Via Oxford Economics:
👉 “Every category of consumer loan is now smaller relative to disposable incomes than before the pandemic”
👉 “That is true even for credit card debt that, despite rising at a solid pace in recent years, remains below its Q4 2019 level as a share of incomes.”
Helps a lot = a big part of consumer debt, such as mortgages is fixed rate debt! Hence, households interest costs are stable, did not follow the spike in policy rates
Personal Savings Rate (% of disposable personal income after taxes & spendings) = 3.6% now, and it has been making the doom & gloom headlines and social media
Nonetheless, there you got with the Maverick’s take on it:
👉 at the surface, indeed, it is low below both the 5.8% average for the past 20 years and the pre-pandemic 7.2% … but why is it low? (note also the 2020-2021 stimulus checks spikes aka 'did you get your stimmy?')
👉 people not earning enough to save? No, we saw above wage growth and household low debt as % of disposable income. Are people spending irresponsibly on the newest gizmo that they get bored after 2 weeks (I am kind, rather 2 days)? Maybe some of it.
👉 how about recalling that this saving rate is positive since many years, and that it is a behavioural monthly growth snapshot which does not tell us the cumulative savings
Hence, Mav, where is the money? ‘Show me the Moneyyyyy!’ (Tom Cruise, Jerry Maguire)
👉 Households own a whooping $4.5 trillion in Checkable Deposits & Currency which is a cash reserve that more than quadrupled relative to the pre-pandemic levels: $1 trillion in 2019 to $4.5 trillion now. This amount equates to about $17k per each US citizen for more than 4x available cash today than the pre-pandemic … let that sink in! Basically, just like with the job market, there is a big cushion here as well.
👉 recall also, that is after a pandemic, a recession, inflation, fastest FED hiking cycle in decades, some banking issues in 2023 in US , a war in Europe, Israel–Hamas war etc
👉 add on top a stock and real estate market at all-time highs which created a record household net worth in 2023 that rose 8% in 2023 to $156 trillion - via behavioral economics we know ‘the wealth effect’ which tell us in this case, why would people save a lot more money (than the 3.6% current rate) when sitting on a ton of wealth?
👉 hence, at 3.6% currently, it’s not low but rather matches the very strong job market, asset values and overall confidence of the good times we are experiencing
Maverick take-away:
👉 people are now out & kicking: travelling, holidays, consuming & investing …
📊 Interest Rates & Yields 📊
US yields - 3m, 6m, 1y, 2y, 3y, 5y, 10y and 30y with a 20-year lookback period
👉 3 hiking cycles in 20 years: not the 1st one nor the last one I tell you that
👉 currently above the 2015-2019 period, and a bit below the 2004-2009 cycle
👉 that front end, namely the 3m 6m and 1-year paying above 5% is not too shabby at all ... paying above even the 2007-2009 period
Getting Paid to Chill 'T-Bill and Chill!' 'T-Bond & Long' is an option nowadays!
Where are we headed? FED interest rates projection via the Fed Funds Futures
👉 probability of a rate cut 1.3% for the June 11-12 FED FOMC meeting
2 cuts of 25 basis points priced in / expected by January 2025
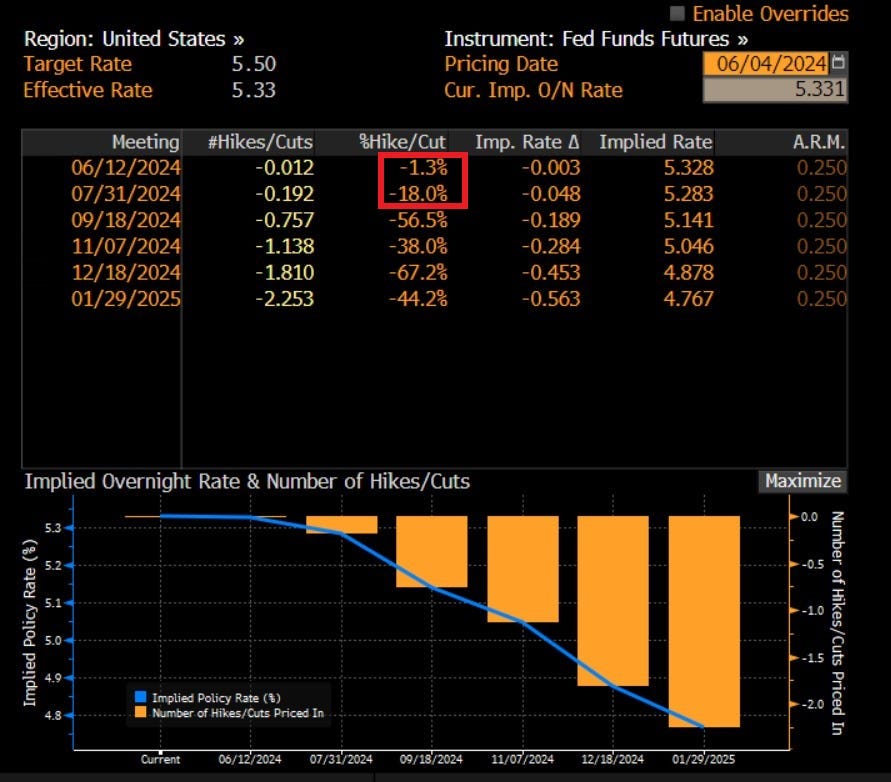
Interest rate cut probabilities for a complementary view via Bloomberg
👉 June FOMC = close to 0% chance of a cut, July FOMC = highly unlikely at 18%
👉 2 interest rate cuts priced in by January 2025
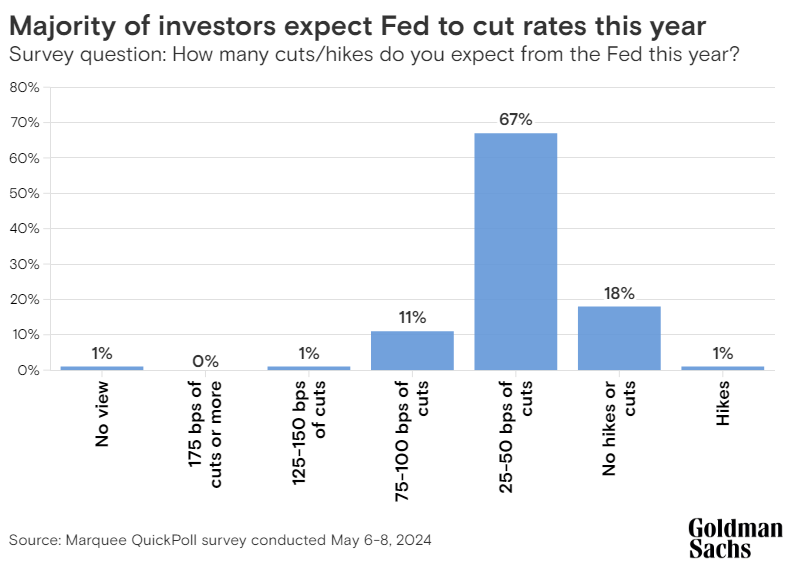
Goldman Sachs survey: ‘How many cuts/hikes do you expect from the FED this year?
👉 more than 2/3 of GS survey respondents expect the Fed to cut between 25 and 50 basis points this year: “Federal Reserve Chair Jerome Powell's remarks at the latest FOMC meeting — specifically around the high bar for any hikes — likely help build investors' confidence on the path ahead,” via GS Oscar Ostlund
For a very complementary angle, the 2-year Treasury Yield and FED Funds Rate
👉 FED funds target rate naturally highly correlated with the 2-year yield
👉 as the 2-year yield playing with going down … expect FED funds rate to follow
Maverick take-away:
👉 peak interest rates aka ‘peak FED’ is likely to be here rather sooner than later! First, before any cut, the FED needs to be confident inflation is coming down properly and it can be sustainably around the target, namely “average of 2% over the long run.”.
👉 on investing: after a long long time, bonds pay now decently and are an alternative
👉 on the high interest rates environment and impact on the economy: keeping rates at 0 until 2022 gave the chance companies and families to lock in low interest rates - while the impact of the measures to limit the pandemic’s financial damage was under-estimated: inflation was/is the price … on that topic, more below
📊 Inflation 📊
US CPI Y/Y (blue) & M2 growth Y/Y (red)
👉 after peaking in June 2022 at 8.9%, inflation reversed and fell to 3.4% as the key driver M2 money supply growth rate turned negative in Q4 2022 for the 1st time since 1933! Yes, almost a century! Let that sink in!
👉 note: since March 2024 it’s back positive and despite not by a lot, just +0.84%, it is surprising one could say given that the battle with inflation is not won yet
Core Inflation Rate (Core CPI, red) a bit higher at 3.6% relative to the 3.4% CPI (blue), though both trending down as inflation gets more and more normalised
Now that we saw the actuals, what about the key question on inflation expectations?
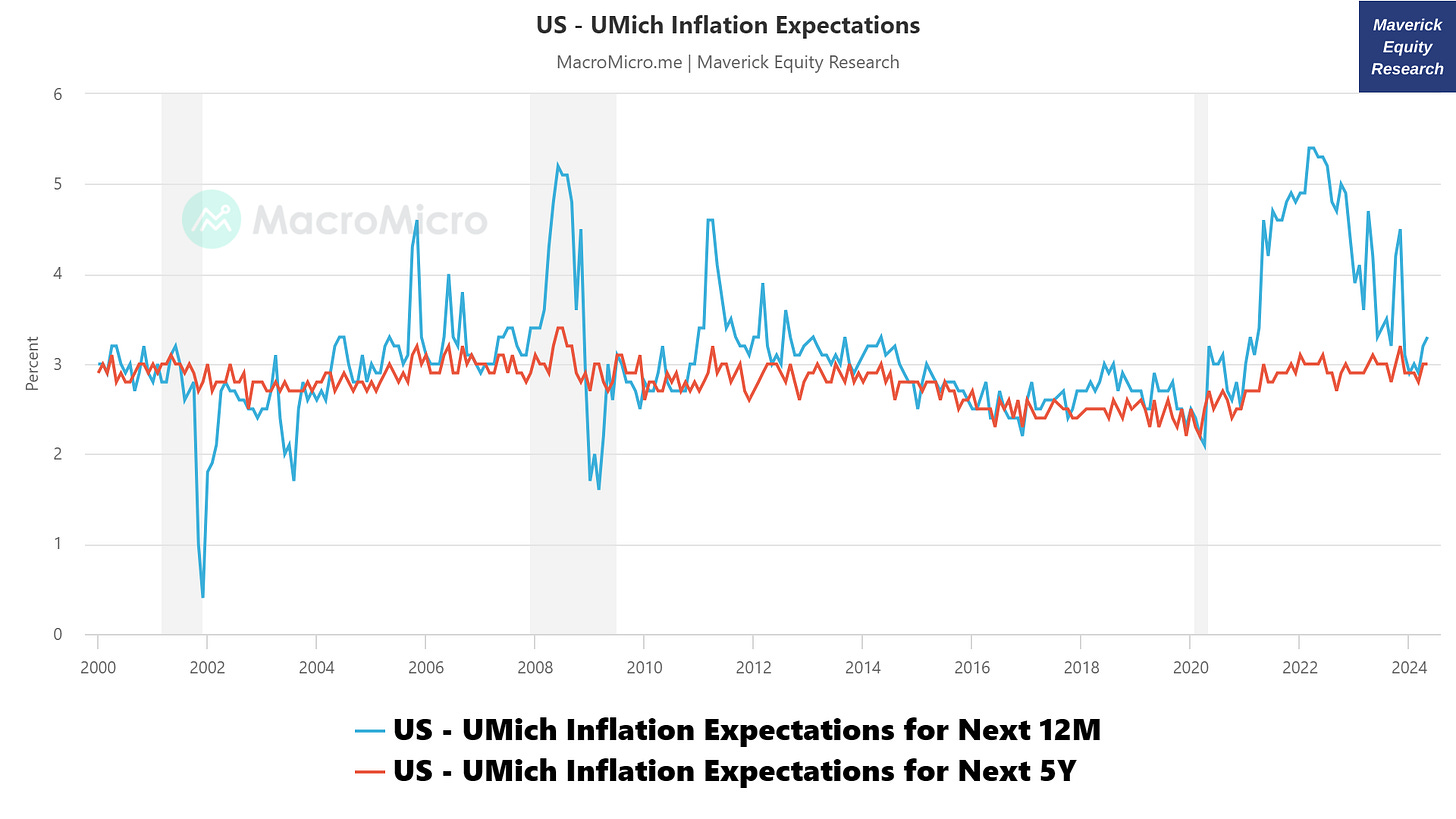
US University of Michigan Inflation Expectations:
👉 1-Year Inflation Expectations metric (blue) points to a 3.3% figure after the 2022 parabolic spike … cooling-off big time since then …
👉 5-year ahead expectations (red) stable at 3% - never took off materially given that the expectations are that central banks and governments will always manage to control inflation/deflation every time it pops up big time
How I and you should use this in the real world?
👉 check when the 1-year disconnects materially from the 5-year as seen since 2021 right before we got the big inflation - in reverse now, we’ll likely see inflation stabilise
The 5-year forward inflation expectation rate (market's expectation of inflation over the next 5 years)
👉 = 2.31% with the same message: inflation cooling-off and heading back to target
👉 2020 a time when rather deflation was expected while later, inflation expectations grew but were never ‘de-anchored’ as it it did not even reach 3% … which is good
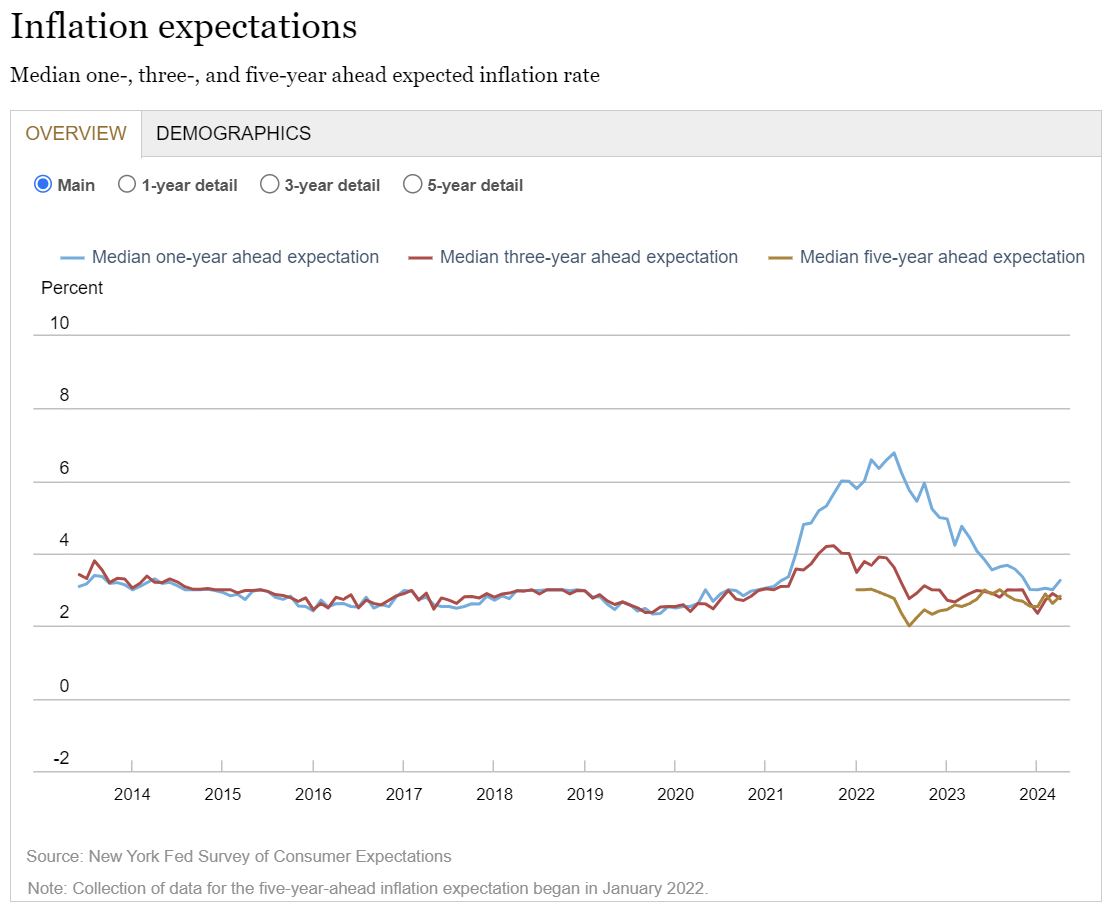
New York Fed’s April 2024 Survey of Consumer Expectations - median inflation expectations hovering between 2.6% to 3.3% rising lately at short and longer-term horizons while coming in lower at the medium term. Specifically:
👉 the 1-year ahead horizon increased a bit to 3.3% from 3.0%
👉 at the 3-year ahead horizon, it fell slightly to 2.8% from 2.9%
👉 while at the 5-year ahead horizon, up a bit from 2.6% to 2.8%
Neutral/Natural Rate of Interest vs Real Fed Funds Rate (I really like this one)
blue = Neutral/natural rate estimated by the Holston-Laubach-Williams (HLW) model, red = Real Fed Funds Rate, yellow = Real Federal Funds Rate - Natural Rate of Interest
How to read/interpret this chart? When the real interest rate is greater than the neutral interest rate, the monetary policy has a tightening effect and can suppress inflation. On the contrary, when the real interest rate is lower than the neutral interest rate, the monetary policy stance tends to be loose, which may fuel inflation.
👉 Real Federal Funds Rate (red) = 2.68% from 2.63% previously
👉 Neutral/Natural Rate of Interest (blue) = 0.73% from 0.84% previously
Hence, monetary policy tightening is taking action which is driving inflation lower!
👉 note how negative Real Fed Funds Rate (red) were during 2020-2022 reaching even -6.56% in March 2022 (record since 1960s), hence no wonder Inflation came to town …
👉 I kept saying on and on that inflation is coming, we cannot get out of this 2020-2022 episode without any side effects from all the stimulus (fiscal & monetary) … some said no way, we did not see inflation in ages, some said yes, you might be right …
Maverick takeaway:
👉 overall, coming from the 2021-2022 scare where many mocked the FED that inflation will be NOT ‘transitory’, nowadays some short term higher inflation, but the expectations are for the disinflation process to continue
👉 Recall FED’s Powell just said recently “I don’t see the Stag or the ‘flation” actually!’
N.B. Maverick Inflation Special Report coming out soon where I will deep dive into inflation fundamentals, key drivers, target & measures, clearing up confusions, and moreover to inflation expectations & pricing … stay tuned!
📊 Real Estate, Mortgage Rates 📊
Mortgage rates
👉 with the FED fighting inflation which is cooling off (disinflation process) rather sooner than later, the FED will also naturally lower rates
👉 and from there naturally the 30-year mortgage rates (blue) will likely be cooling off as well from a 20-year record of 7.79% … for now it is 6.99%
👉 note how it broke in 2023 even the +2 standard deviation (SD) which for me was and is a major sign of a top … from here the next stop at the +1 SD of around 6%
👉 note also the 20-year average/mean (green) of 4.76% is way below the current rate
Hovering now above the 2006-2008 peak levels, 2 key notes for further real insight:
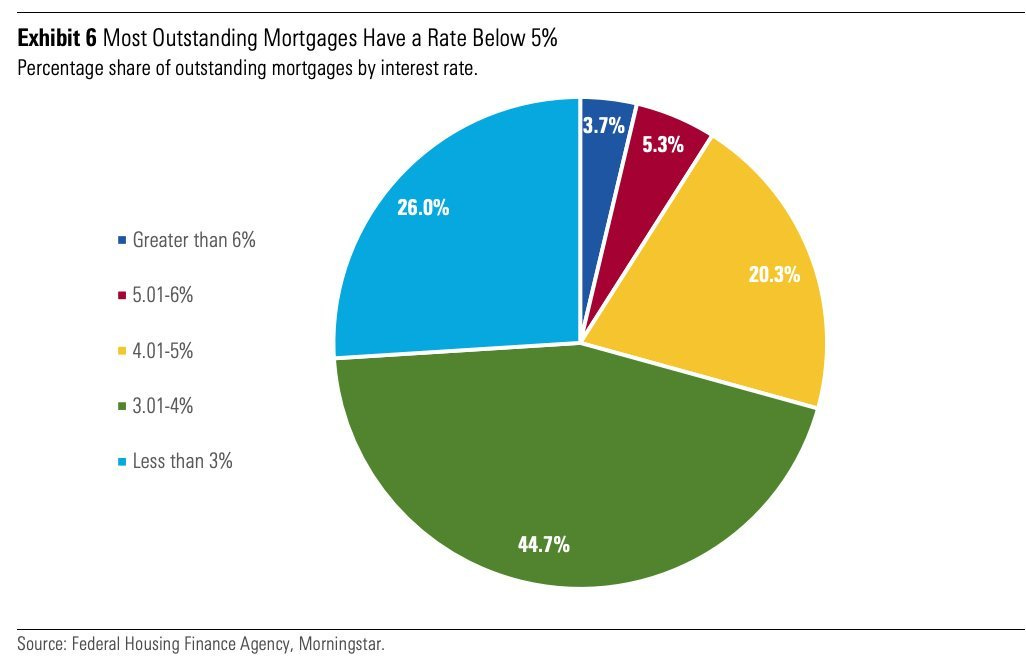
👉 distribution of mortgages by interest rates paid: 91% of people have a rate BELOW 5% which is close to the 20-year median of 4.76%. Detailed breakdown:
26% have a rate under 3.00%
70.7% have a rate under 4.00%
91% have a rate under 5.00%
96.3% have a rate under 6.00%
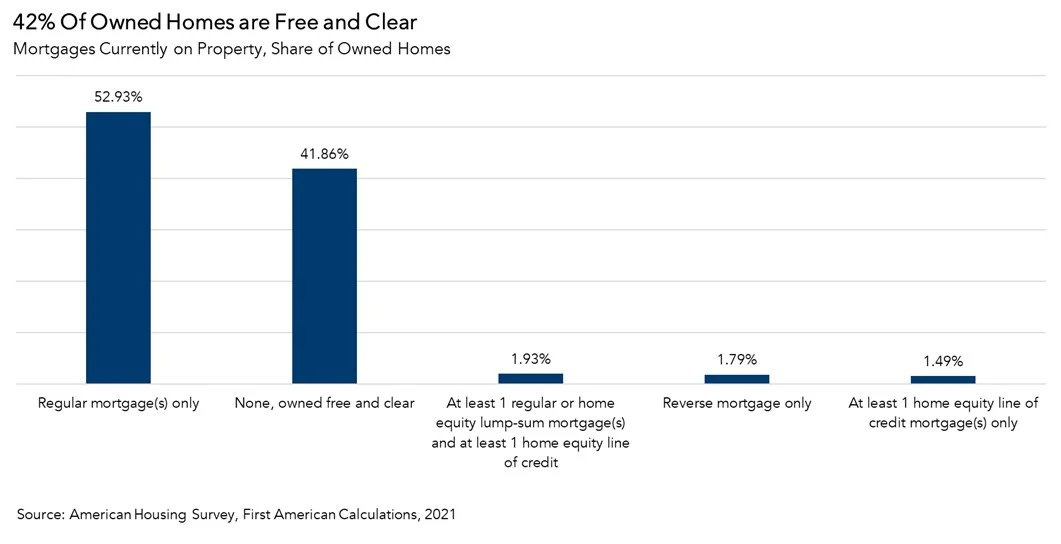
‘How many owned US homes are free and clear from a mortgage?’ as that is also a key question on housing and interest rates
👉 42% in 2021 of all owner-occupied homes in the U.S. were owned free and clear, up from 34% percent in 2011. Of those who owned their home free and clear, nearly 78% were owned by homeowners aged >55
👉 Q2 2024 nowadays very likely higher: maybe even 45-50% given that homeowners aged >55 should be close to the end of the mortgage payment schedule
Basically, most homeowners are not much sensitive to movements in home prices or mortgage rates! Note also that home equity lines & reverse mortgages are small = good!
Combining the 2 above we have actually the key take-away and insight:
👉 if 42% of homes (likely even more now in 2024) are owned outright + 71% of mortgages below 4%, we can deduct that in excess of 80% of homeowners do not feel much the effect of high current mortgage rates … let that sink in!
Moreover, are residential constructions halted or dropping ? Not at all!
👉 1,36 mil privately‐owned housing starts which is above the 1,22 mil 20-year average
👉 notice the (too) big uptrend leading to the 2007-2009 subprime mortgage crisis: it took quite a while for the construction sector to get full confidence and get back up to speed (note also the 2020 Covid interruption)
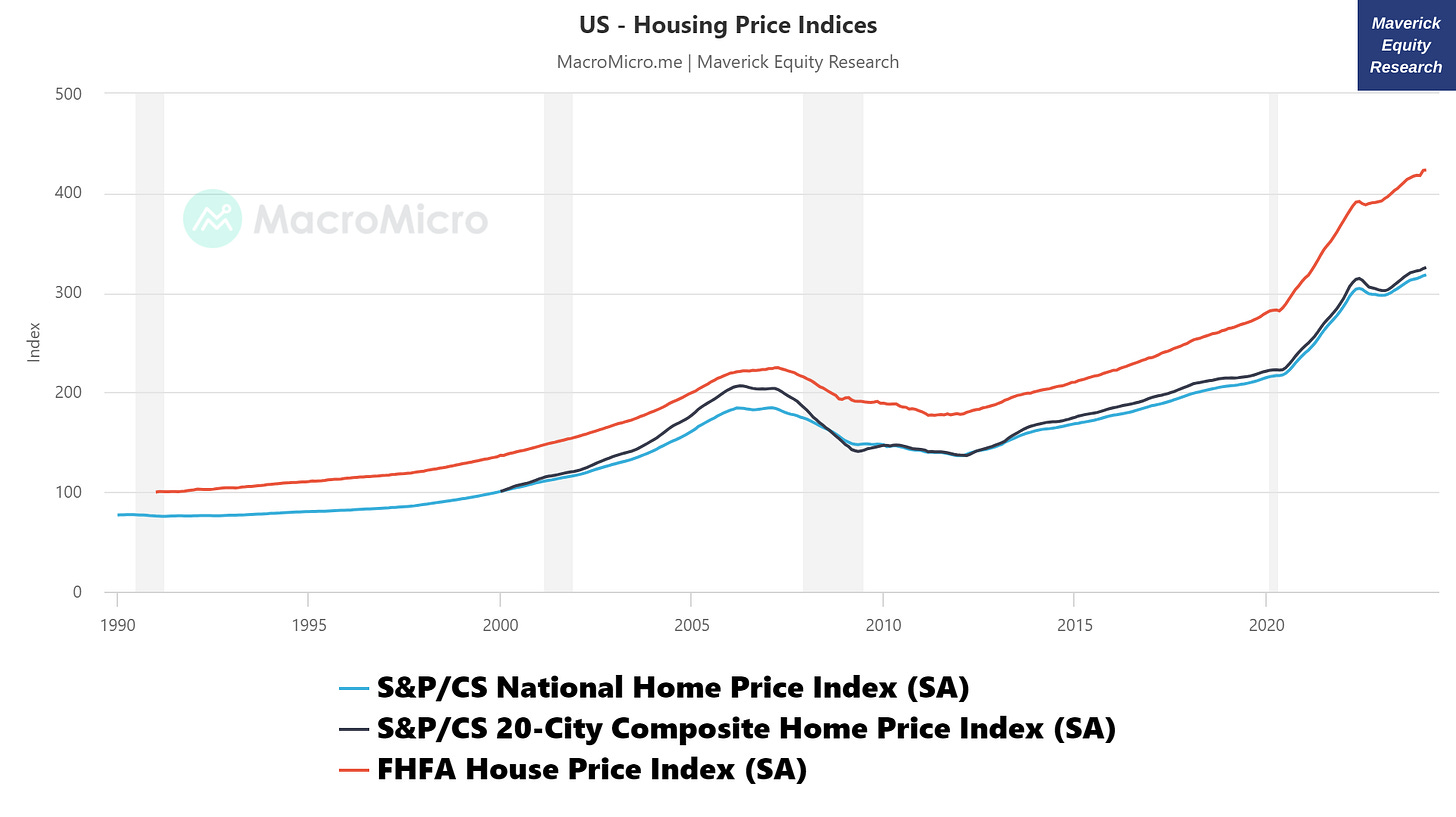
Home Prices via the big 3 housing indices: S&P/Case-Shiller National (blue), S&P/Case-Shiller 20-City Composite (black), FHFA House Price Index (orange)
👉 all 3 increased in the last month, and take note as well of the quite parabolic move since the 2020 pandemic
👉 when that many people own their own homes and their price increases, the ‘wealth effect’ is on and people are more willing to spend and invest further
Isolating the S&P/Case-Shiller National Home Price Index (blue) and adding it’s growth year-over-year (yellow)
👉 a solid 6.47%% growth marking another all-time high in March (despite high rates)
👉 just a great recovery overall after being shortly negative in May 2023
What about Mortgage Applications (MBA)? New home-owners anyone?
👉 after mortgage loan applications volume increased for a 3 week growth streak, the last 2 weeks with negative values
👉 after the 30-year fixed mortgage rate declined for 3 straight week to 7.01% (lowest level in seven weeks), back with a slight increase at 7.07%
Overall, affordability is very low, yet despite the FED’s hiking interest rates cycle, hence the current 7.07% 30-year mortgage rate, we see also some green bars (growth) which shows the strong consumer and how wage growth & disposable income is there.
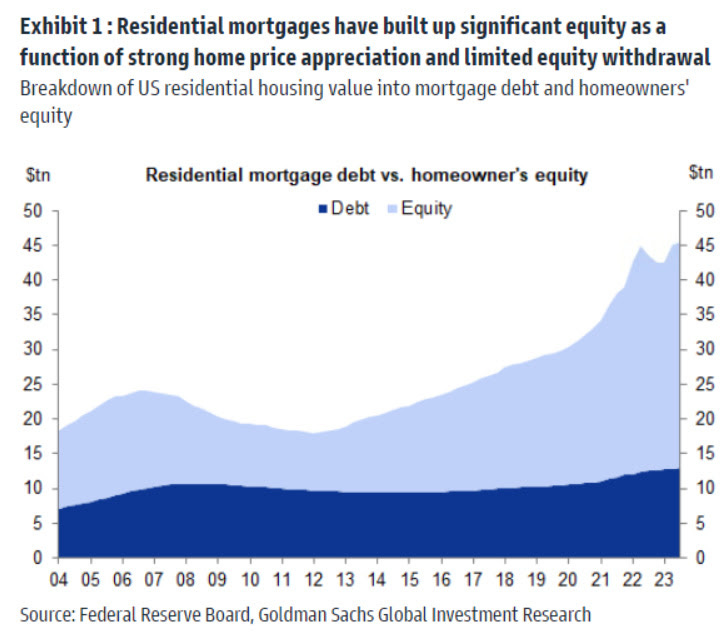
Last but not least, Residential Mortgage Debt VS Homeowner’s Equity
👉 on top of fixed interest rate debt as noted previously, U.S. homeowners are sitting on roughly $32 trillion in total equity ... let this one sink in!
Maverick’s take-away on the housing market overall:
👉 affordability for new potential home buyers is not favorable now, yet lower mortgage rates likely soon, all while current mortgages not being paid is not the case
👉 residential construction rolling, home prices up, homeowners equity high
👉 overall headlines are more doom & gloom than they should when it comes to the real estate market overall … but for clicks and views for advertising money they will keep rolling … and once interest rates, yields & mortgage rates will go down, headlines will find something else to beat the doom & gloom drum …
👉 The Rise of Negative Media is now a confirmed phenomenon via solid research besides my own personal observation … a quick take and summary you can read here.
📊 Sentiment 📊
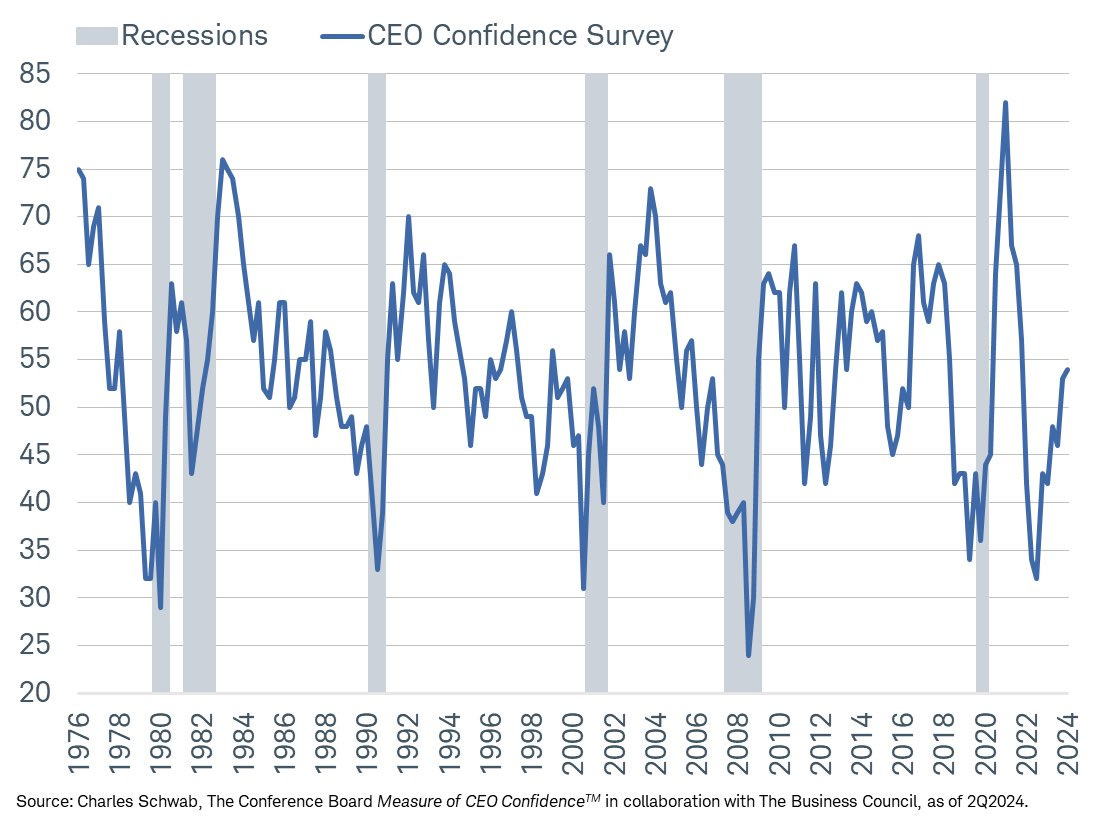
CEO confidence increasing across the board
👉 current economic conditions vs 6 months ago, business conditions in own industry 6 months ahead, and expectations for the economy 6 months ahead
👉 as FED started hiking, confidence got a hit … but back now above pre-covid levels
Complementary longer time series and take via Schwab:
👉 we have the 2nd consecutive quarter in which the index has a reading above 50, “indicating that CEOs are cautiously optimistic following 2 years of gloom”
CEOs, ok, ok privileged & all, what about the Consumer sentiment/confidence?
👉 Conference Board (CB) Consumer Confidence Index (blue): at 102 from 97, not yet above pre-pandemic times, but very well recovering since 2020
👉 University of Michigan (UMich) Consumer Sentiment (red): at 69.10 from 77.20 which is BELOW the 2020 pandemic levels … hence, does not make much sense to me … on the other side, after a multi-year low reached in mid 2022 as inflation was hitting hard & the stock bear market was in full force, it has been recovering well since then
N.B. the main distinction between the UMich Consumer Sentiment Survey and the CB Consumer Confidence Questionnaire is that the former focuses on how consumers feel about the consumption of durable goods, while the latter is closely related to general consumption and employment conditions.
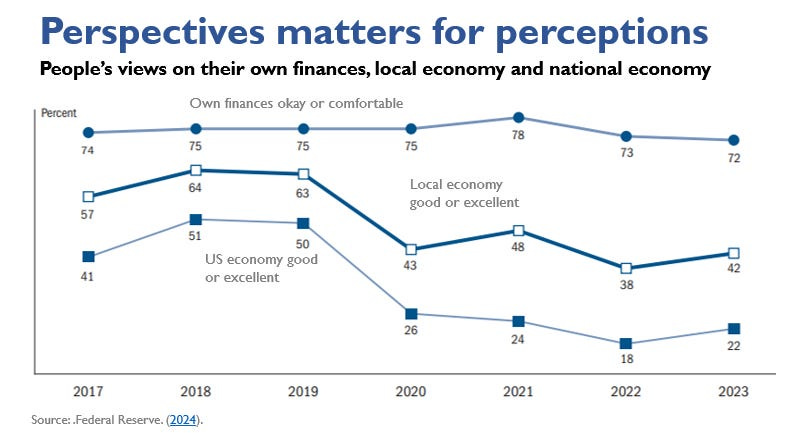
Diving deeper for perspectives which matter quite a lot for perceptions via the FED’s Survey of Household Economics and Decisionmaking, namely since 2017:
👉 72% of adults, a big chunk describe their own finances ‘okay’ or ‘comfortable’ and note how despite the pandemic it did NOT change much, very stable since 2017
👉 however, when it comes to the local or US economy (zooming out) being ‘good’ or ‘excellent’, there has been a big drop since the pandemic, 42% and 22% respectively. The latter as a huge 50% gap in 2023 between own finances & the national economy … which does not make much sense, does it? Covid was hard, inflation was and is hard for everybody, yet how can one say his situation is okay/comfortable, yet have such a bad perception about the economy?
Mavericks’ take:
👉 one major reason is the rise of negative media, polarisation, headlines for ads etc
👉 the other, the political battles, extremism, rage and overall not constructive discussions on the topic, from politicians per se, to all adult voters in general … when there is a big perception of disorder, conflict and lack of leadership, this is the result … but a result which does not resemble reality! Narrative is one thing, reality another!
📊 The (R)ecession Talk - Leading Indicators, Probabilities and 2024 Outlook 📊
I am into the no recession/soft landing camp. Now a very common question I get is: ‘What metrics and/or models you look at to track the business cycle and the likelihood of a recession at any point in time?’
Well, there are many out there that I look at and check: one day I will compile all of them into a comprehensive article & overall framework. Nowadays, among many other I look particularly at the following 10 metrics/indicators:
Philadelphia FED Recession Probability Index - cooling off materially after in 2022 many market participant expected a recession - yet this metric never breached not even the 50% chance, the maximum in 2022 was 47.17%
👉 current quarter: 14.41% (blue) from previously 17.3%
👉 next quarter: 18.74% (red) from previously 23.94%
👉 four quarters ahead: 25.64% (orange) from previously 25.18%
2 key complementary notes:
👉 this metric has an overall signal/sensitivity/focus more to the current and next quarter (bigger and faster spikes when economic stress happens)
👉 the probability of recession for the next quarter is also referred to as the "Anxious Index", which accurately predicted every economic recession identified by the National Bureau of Economic Research (NBER) since 1970
Overall, this is to be used in practice in tandem with all it’s 3 parts and also other complementary business cycle / recession indicators for a stronger decision!
Real-time Sahm Rule Recession Indicator
👉 at 0.37%, previously 0.3% is not signalling a recession due to the historical low levels of the unemployment rate
Background: FED economist Claudia Sahm approach - if the 3-month moving average of unemployment rate exceeds 0.5% compared to the previous year's low, the economy is in a recession or will enter one soon (condition met in past recessionary periods).
Conference Board Leading Economic Index (LEI) vs GDP
👉 the Conference Board Leading Economic Index (LEI) is historically a good gauge of where we are in the business cycle ... also picking up lately (less negative) after being negative since July 2022!
👉 seen as a leading indicator as the US economy is likely to recess in the next 2-3 quarters when the YoY rate of LEI falls below 0, currently at -5.21% (previously -5.45%)
👉 Yet, 'is this time different' (tricky finance saying ... )? I would lean rather yes, no recession anytime soon ... the economy is doing quite fine + big fiscal spending + election year ... will be very hard to have a recession in 2024!
Also, business cycle indicators via all CB’s indices - leading, lagging, coincident
👉 the Leading index has been going down since a while given the negative growth from above, yet note the following: unlike in the past, this direction is not confirmed by the lagging or coincident indices
NBER Recession Indicators Drawdown
👉 at 0% (previously 0%), no sign of recession here either
👉 when more indicators experience sustained declines or drop significantly, there's a greater chance that the U.S. economy is entering a recession.
FED Excess Bond Premium Recession Probability
👉 at 14.92%, dropping from 18.22% - also, showing a low recession probability
Background: In 2016, the Federal Reserve proposed a recession model that based on the excess bond premium (EBP), which is a financial indicator originally introduced by Gilchrist and Zakrajšek (2012). The EBP is a component of corporate bond credit spreads that is not solely driven by expected default risk. EBP is an effective indicator for evaluating investor sentiment or risk preference in the corporate bond market. The higher the EBP, the higher the risk in the bond market.
FED Financial Conditions Impulse on Growth (FCI-G)
👉 1-year lookback (red): -0.38 from -0.57 previously
👉 3-year lookback (blue): 0.24 from 0.08 previously
After heavy financial conditions tightening in order to cool-off inflation, financial conditions are not tight anymore, hence no longer a drag on overall GDP growth.
N.B. positive values represent headwinds to GDP growth and negative values represent tailwinds. For example, 1% means that financial conditions will have a 1% drag on GDP growth over the next year.
Chicago Fed National Financial Conditions Index (NFCI)
👉 NFCI (blue) at -0.56 after previously at -0.54, financial conditions are good!
👉 the higher the index, the higher the risks are (note, inverted in this chart)
👉 it leads real economic growth by roughly 1 to 2 quarters as real GDP growth (red) is highly correlated to financial market conditions, and it is composed of up to 105 market indicators, which are divided into three categories: risk, credit, and leverage.
Alternative cool data from the S&P 500 leaders, namely their indirect thoughts via the frequency of mentioning ‘recession’ via the latest earnings transcripts
👉 in the 2020 pandemic, almost all 500 saw the recession coming, then in 2022 we had the most anticipated recession that never came even if 400 thought so, via WSJ:
👉 “Among companies in the S&P 500, the term ‘recession’ showed up in just 100 transcripts of earnings calls, investor events and conferences recorded in the first quarter, according to FactSet. That was down from 302 in the first quarter of 2023, and the fewest in two years.“
Outlook for US Real GDP Growth Expectations for the Next 12 Months through 1 Maverick Chart for 10,000 words showing 3 Leading Forecasts
1) MM Economic Expectations Index: 2.13% from 2.2%! The calculation method is the weighted average of GDP forecast data for this year and next year from major statistical institutions (including the IMF, World Bank, OECD & major think tanks).
2) Philadelphia Fed SPF - Real GDP growth average for the next year: 1.90% from 1.74%! The Survey of Professional Forecasters (SPF) is released by the Philadelphia Fed Statistics. It surveys the expected values of macroeconomics indicators such as economy, consumption, employment, and prices. Here we calculate the GDP as the average of this quarter to the next four quarters.
3) New York Fed’s GDP forecast for the next four quarters: 1.53% from 1.45%! The New York Fed uses quantile regression to analyze the average GDP growth rate of the US in the next four quarters. The main reference variables in the model are Blue Chip Economic Indicators Survey (BCEI), Composite Indicator of Systemic Stress (CISS), and here we take the median GDP growth from this model.
Therefore, 3 Leading Forecasts for Tracking the Future US Economic Growth!
Further insight into the outlook and methodology:
👉 The long-term average economic growth rate for the US is approximately 2%. If the forecast for the next year significantly exceeds or falls below this 2% threshold, actual GDP tends to follow suit with strong or weak performance. These 3 indicators reveal a close correlation with actual GDP, sometimes even acting as leading signals.
👉 For instance, during the 2008 financial crisis, these 3 indicators bottomed out at the end of the year, while actual GDP only started to rebound in Q2 2009. Since actual GDP is typically released about a month after the end of each quarter, the monthly MM Economic Expectation Index and New York Fed projections can serve as leading indicators for GDP.
Maverick takeaway:
👉 the probability of a US recession in 2024 is low, big fiscal spending is ongoing and on top we have an election year
👉 1.5% - 2% growth in the cards, should growth take a hit and about to go negative, intervention is possible and quite likely
👍 Bonus, Going Global Beyond the US Economy 👍
Economic Expectation Index for US, EuroZone, China and the World overall by aggregating GDP forecasts for the current & next year from major institutions, including the IMF, World Bank, OECD & prominent think tanks. When the index rises, it signals optimism in the market's economic outlook for the next 12 months
👉 US (green): 2.13% from 2.20% previously
👉 EuroZone (brown): 0.99% from 0.80% previously
👉 China (red): 4.73% from 4.70% previously
👉 World (blue dotted): 2.62% from 2.58% previously
Maverick take-away: the outlook for the next 12 months is looking good.
Bonus as empowering you: in general, how to read/interpret this chart? 2 ways:
1. Global economic growth typically hovers around 3%, which is considered a relatively normal level. A significant drop in global economic growth, falling well below 2%, serves as a potential warning sign of a global economic recession
2. Adjustments in economic expectations often coincide with short-term economic fluctuations, providing a means to grasp turning points in the economic cycle. When economic expectations cease to decline, it typically signifies that the worst phase of economic distress has passed (the bottom should be about there)
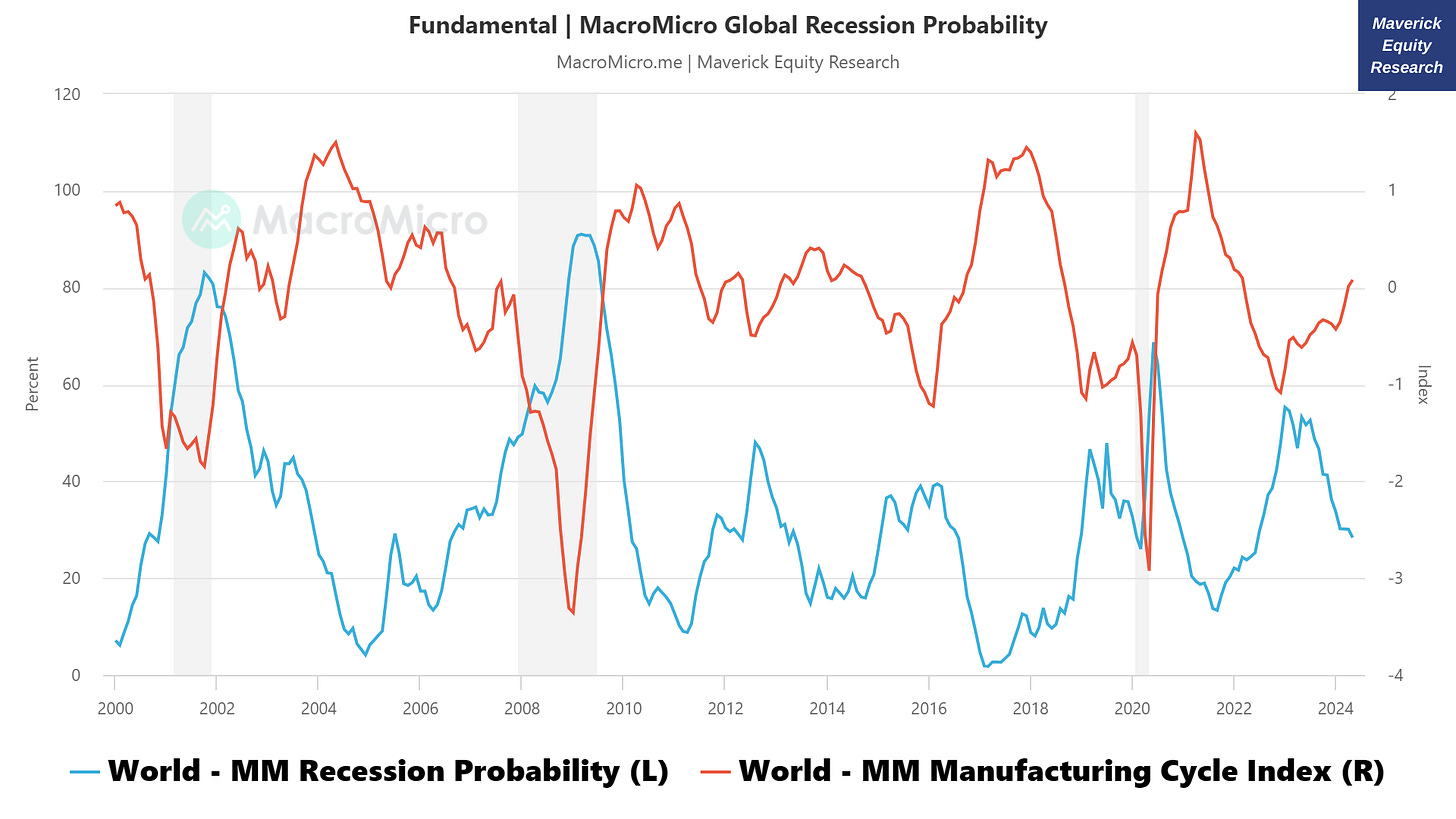
Global Recession Probability
👉 28.36% now and decreased from last month’s 30.09%
👉 an overall decrease since 2023 when it was slightly above 50% in Q1 2023
Background: 50% reading as the baseline: a reading significantly above 50% for an extended period indicates a high probability of a global recession (including the US economy), where the global stock market may also see a significant downturn, as was the case in 2000 and 2008)
Combining the Global Recession Probability with Manufacturing Cycle Index
👉 dropping recession probability with a Manufacturing Cycle index back into positive territory at 0.08 from 0.01 previously = good news
The Global Travel/Consumer Economy: Breaking Boundaries, Smashing Records
👉 globally, 9 out of the last 10 all-time record spending days in both cruise & airlines have happened in 2024 (aggregated & anonymized Mastercard transaction data)
👉 below the global index of spend per card for both Airline and Cruise: multiple record setting days in 2024: the appetite for travel continues to grow …
Global Geopolitical Risk Index (GPR)
👉 Geopolitical Risk Index: 124.09 from 109.26 previously
👉 Geopolitical Risk Index - Threats: 131.81 from 116.72 previously
👉 Geopolitical Risk Index - Acts: 136.29 from 118.79 previously
Maverick takeaway: the 9/11 terrorist attack from 2001 saw a big spike which was followed lately by the Russia-Ukraine war. We are now below the elevated levels when the war started, yet with an increase via the most recent data. Index background:
compiled by Fed economists Dario Caldara and Matteo Iacoviello it measures the occurrence of impactful geopolitical events/threats/conflicts by counting the keywords used in the press
it has shown that a quick increase in the GPR index could have strong impact on private investment, labor market, economic growth, and the stock market
the keywords include the following: war threats, peace threats, military buildups, nuclear threats, terror threats (Threats) and beginning of war, escalation of war, and terror acts (Acts)
The same chart but a very long time series for a great overview since 1900:
Growth: US and The World via the Bloomberg Consensus
👉US growth prospects at 2.4% are breaking away from the pack ….
👉 "when the American economy sneezes, the rest of the world gets a cold?" is an old saying, hence let’s just let the US do its thing as the rest will not mind & likely follow!
‘What is the most likely outcome for the global economy in the next 12 months?’. A key survey question for global fund managers via BofA, odds for:
👉 'soft landing' most likely = 56%
👉 'no landing' = 31% (economy expands, then harder to lower inflation or cut rates)
👉 'hard landing' = only 11%
Maverick take-aways aka 'how to use this stuff':
👉the more extreme any scenario goes, the more one should rather think to go the opposite aka 'contrarian'
👉 when kind of scattered/balanced, rather take the chill pill and wait ...
👉 the money is made in the ass sitting in general, not in the 'action' after each data point... have to swing for the right pitch at the right time, not be active like a Duracell rabbit 😉 ... a portfolio is like soap, the more you touch it, the more it shrinks ...
78% also responded that a recession is unlikely in the next 12 months
👉 which is the highest share since 2022 and also note that
👉 in November 2022 they were expecting a recession at similar levels to the 2007-2009 GFC and the 2020 Covid pandemic … yet we had the most anticipated recession that never materialized …
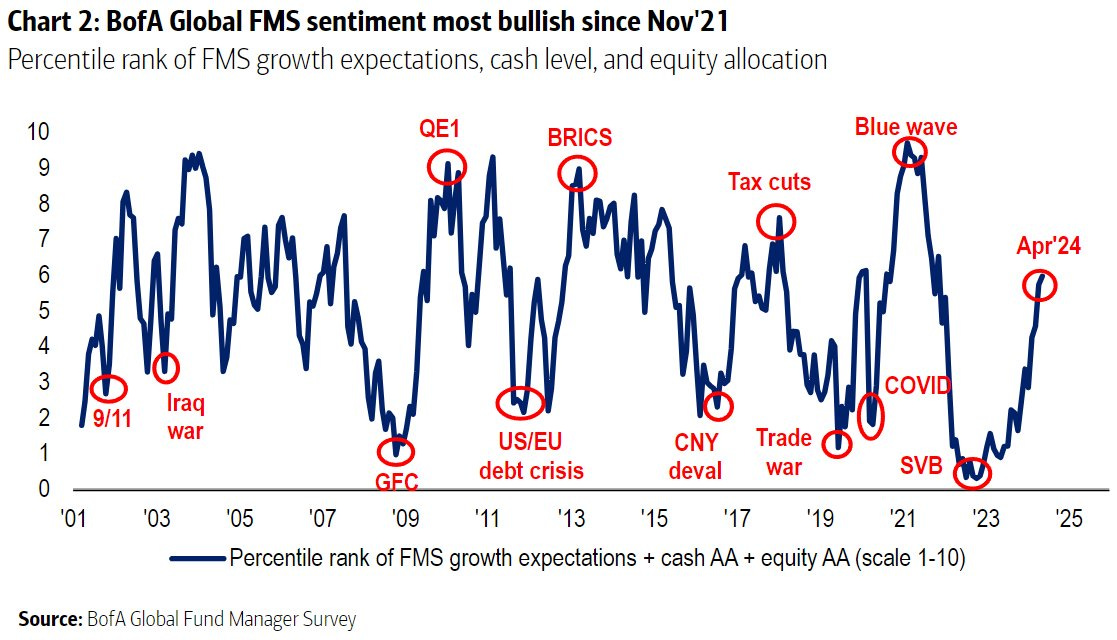
Above in the Sentiment section we saw a US dedicated one, what about global?
👉 Global Fund Managers sentiment is the most bullish since November 2021
Last but not least, a key one: are governments overcooking fiscal policy? Yes!
👉 the proportion of global fund managers believing that global fiscal policy is “too stimulative” is at its highest since the survey began (in the wake of the 2008 GFC)
Maverick takeaway:
👉 probability of a world recession in 2024 is low (US leading the world growth wise)
👉 fiscal policy too stimulative, geopolitics remain an issue
👉 manufacturing cycle back positive, sentiment is good, the global consumer travels
👍Main Maverick takeaways 👍
Overall take for the 2024 US and the World Economy
👉 US GDP to grow in 2024 at 2-3%, the same for the world economy
👉 the probability of a recession in 2024 is low: fiscal spending is on & election year. Should growth slow down materially / about to go negative, intervention is possible and very likely, especially given the election year in the US
Main takeaways for the future in general
The business cycle is the business cycle - we learned about it in the 10th grade at the Economics basics class and we have no reason for it not to be valid going forward:
every 6-8 years we do get a recession - things do recover, having a plan for when (not if) it happens makes it easy to weather the storm
since WW2, recessions last an average of just 11.1 months
the last economic expansion: started after the 2007-2009 GFC & lasted 10.6 years
👉 Implications of any recession vary with each individual situation, my key notes:
as an entrepreneur: hiring, CAPEX/investment and other major business decisions
as a trader: risk management, hedging, liquidity
as a medium-long term investor it really does not matter much as long as one has a solid portfolio i.e. owning stocks should be treated like they truly are, pieces of business, not moving tickers on a screen (never confuse investing and trading)
I was DOWN 52% during the 2007-2009 GFC & that bear market lasted almost 2 years, 2020 Covid indiscriminate selling & the 2022 bear market was peanuts in comparison, hence it shall be easy to go through the next one as well …
Remember:
👉 the market is structurally net long which is way too often forgotten given the constant news and headlines, or simply not known!
👉 if you believe our dear species will evolve, societies & economies will also … and that will simply be reflected in higher investment portfolios values!
Keep compounding … keep compounding: your people, capital and overall experiences!
This research report was free cost wise for you, and as well ad-free & clickbait free!
Did you enjoy this extensive research by finding it interesting, saving you time & getting valuable insights? What would be appreciated? Sharing it around with like-minded people and hitting the ❤️ button. This will help me bringing in more & more independent investment research: from a single individual, not a bank, fund or so!
Thank you and have a great summer!
Mav 👋 🤝





























Oh man. 75 sections into one deep report! Congratulations Maverick!
Great Charts! Excellent Work,comprehensive detail. By the way, I really want to make a comment on No.55 argument. People usually have different perceptions on themselves and others,for example, ordinary people usually hide bad things such as financial hardship and tell others they are comfortable with and confident about their own life.But when they talk about the economy, they feel sucks and sounds like everything againsts them. What I could say, different framework bias but still same people,lol