✍️ Year End Special: 2022 Review & Top 50 charts
From the world of Stocks, Bonds, Macro, Special Country Report & Bonus Charts
Dear all,
as 2023 is around the corner, there you go with my 2022 Review & Top 50 charts. It is always interesting and beneficial to have a yearly review so that we can reflect and improve our thinking and investing process going forward. This special edition will be a mix of my own research charts & 3rd party cherry picked ones and will cover:
📊 Stocks & Bonds 📊
🏦 Macro: FED, Interest Rates & S&P 500 Valuation🏦
📊 Special Country Report 📊
👍 Bonus Charts 👍
2022 was an atypical year from many points of view: many charts had the y-axis stretched like in 2008 GFC & 2020 Covid crash with plenty of outliers & interesting developments. In January 2023, a 2023 Outlook with a focus on the S&P 500 will follow.
Report is not behind a paywall & there are no pesky ads here. It would be highly appreciated if you just spread the word around to people that might also be interested.
📊 Stocks & Bonds 📊
Stocks & bonds in negative territory in 2022:
👉 S&P 500 (SPY) went into bear market mode & about to end the year around -20%
Bonds down, though note how not all bonds got crushed as headlines say:
👉 TLT (20-year+ maturities) took the biggest pain with a -31.24% drawdown
👉 AGG (US investment grade: treasuries, corporate, MBS, ABS, munis) with a way lower -12.93% drawdown, though a key note: it is the worst year ever & there has never been 2-years in a row for the index … bounce back in 2023+?
👉 SHV (1-year or less maturities, cash proxy) even with ramping inflation & interest rates, ended the year with a remarkable positive +0.89%
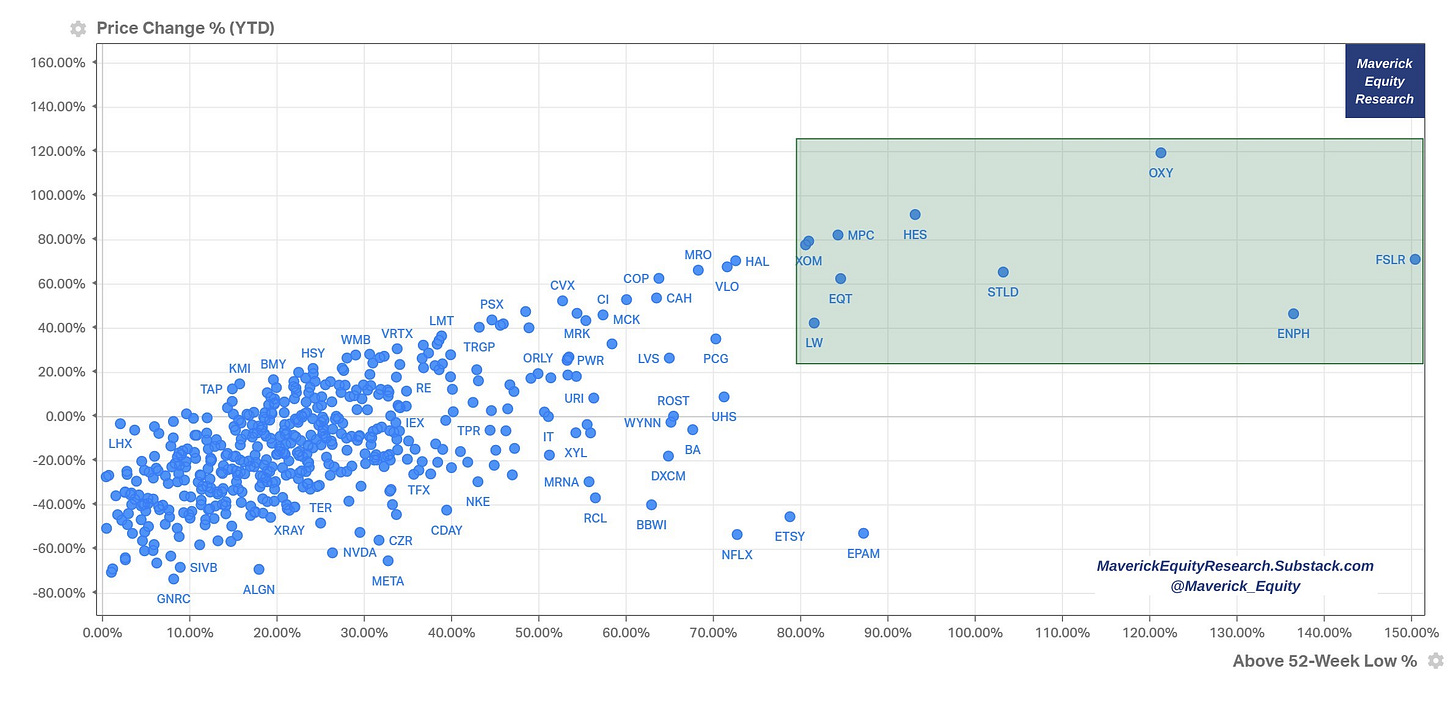
Similar like with not all bonds being down, not all stocks are down. Let’s check for who are the 2022 S&P 500 winners via a price scatterplot view with the Return % YTD '&' Above 52-week Low %:
👉 OXY & ENPH: Buffett rocking it again with OXY ... or, as Charlie Munger says: “We found some things we preferred owning to treasury bills”
👉 FSLR solar with a great run also in 2022
Overall, 135 stocks ended the year positive, 365 negative with 198 of those having a return of -20% or more. 121 stocks had a return worse than -30% (~24% of the index). 26 stocks had a return worse than -50% (~5% of the index).
Any stocks in the S&P 500 that both pay dividends & do share buybacks? Answer via the dedicated scatterplot with the shareholder yield made out of the dividend yield & share buyback yield:
What about the Dow Jones price scatterplot?
👉 CVX Chevron is up 57% also: in Q1 2022 Buffett went bonkers and added 120.9m shares (70% of the position), Q2 & Q3 some more for a total 8.8% stake = 3rd largest position in Berkshire BRK-B
At the S&P 500 11 sectors level, XLE Energy leading by far in 2022 & with XLU Utilities, the only 2 positive sectors with XLC Communication Services the biggest laggard. Energy continues to lead agnostically: when oil is up, when oil is down, when yields are up, or when they are down, when the market expects a more hawkish or dovish FED:
2022 = Stock Picking Market? Yes also via BofA:
👉 2022 the best market for stock pickers in more than 20 years, let that sink in!
👉 More than 60% of stocks outperformed the S&P500 this year, surprised?
👉 And that is the most since 2001
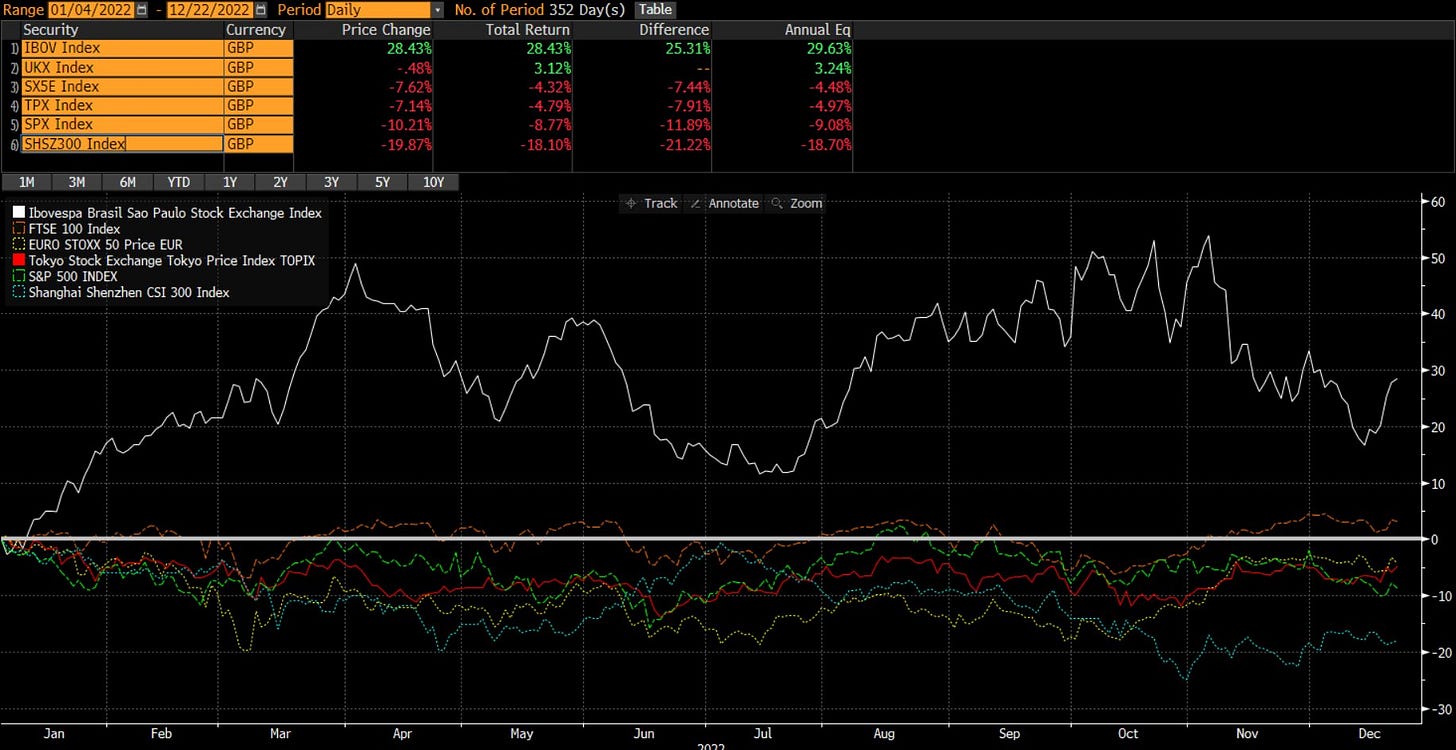
Are there winners in the global equity markets in 2022? Yes, Brazil!
How often/rare does it happen that both stocks & bonds fall in the same single year? ‘‘Not often bro’ ‘‘, 2022 as an outlier:
👉 only 3 times since 1926 when Stocks & Bonds had combined negative returns: 1931, 1969 & 2022! Let that sink in & brink the sink in like Musk did at Twitter
👉 note also how well did US Bonds perform in 2008 during the GFC/Lehman times
👉 will one catch the bottom these days? No, luck or hard! Though, what shall happen after this? Zoom out: looking back in 2028-2030, today is an interesting investment opportunity for both Stocks & Bonds … Market = Discounted …
Specifically, the classic balanced 60/40 stocks & bonds portfolio had its worst performance in a … century! Let that sink in! Rule of thumb in markets: bad times create good opportunities. Check what happened after: mostly very good returns.
Going global beyond US: stocks & bonds correction is heavier than during the 2007-2009 Global Financial Crisis … with hindsight, GFC was an obvious opportunity to invest … a story that repeats in every downturn, very likely it will be not different now. In short, what you would have done at the end of 2008 with the benefit of hindsight?
Complementary view, international/world stocks (ACWI) and bonds (BNDW) also corrected in 2022. Stocks with -17.7% while bonds -12.5%:
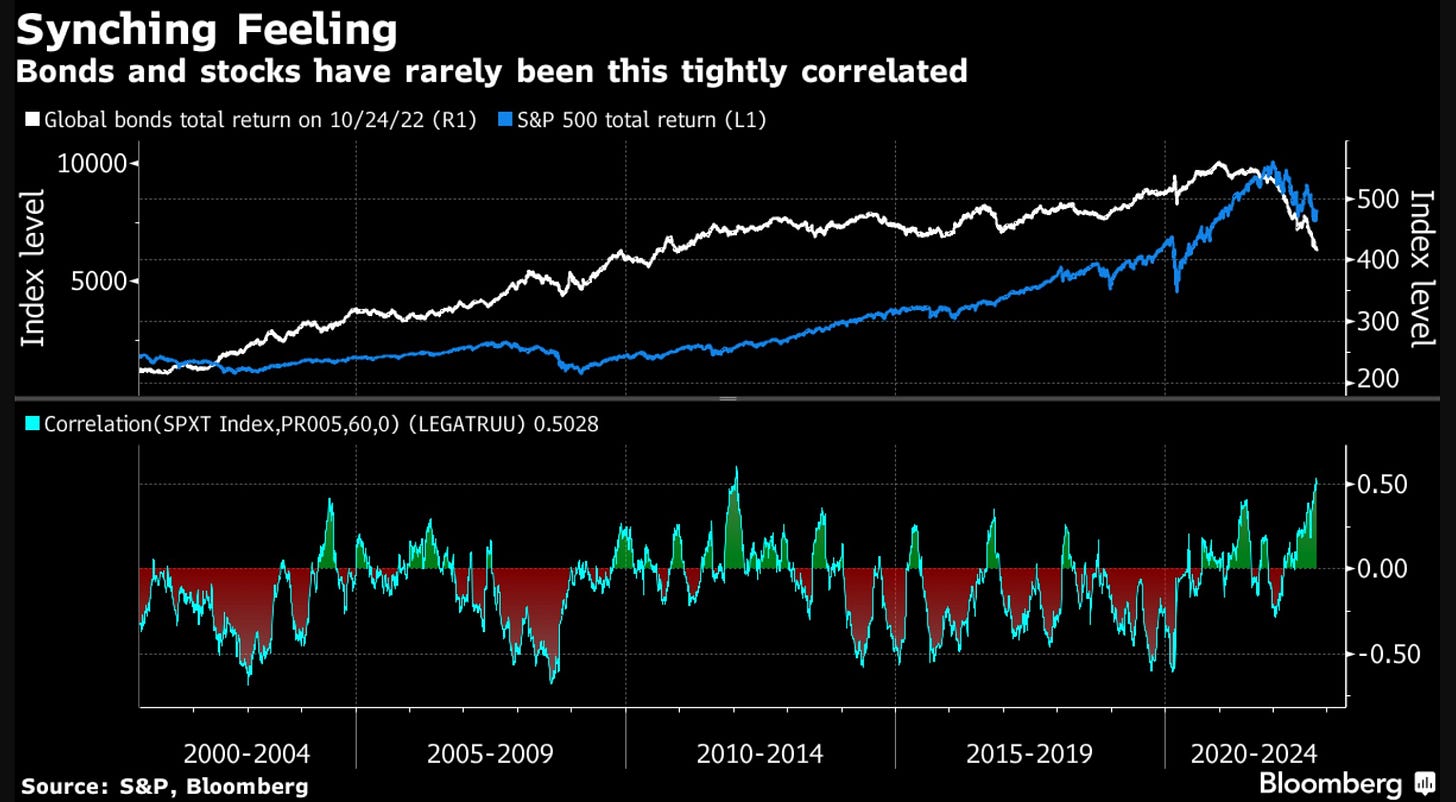
Stocks & global bonds with one of the tightest correlations in the last 22 years. Not good when one relied on bonds providing a safety net when equities go down:
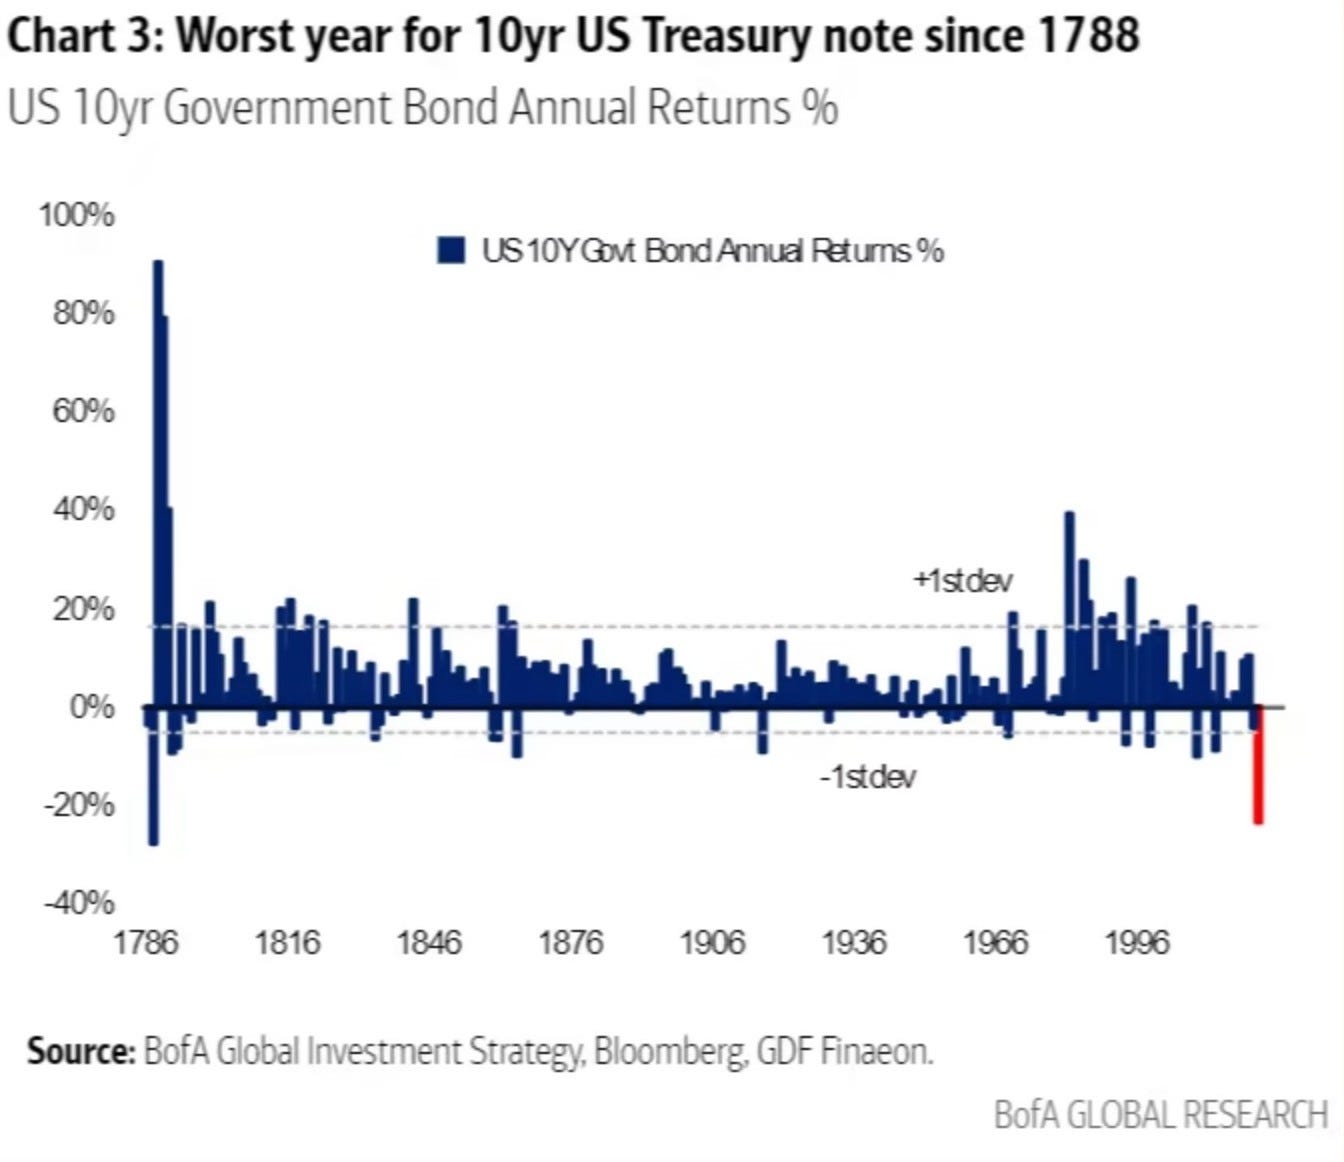
10-year treasuries isolated:
👉 2022 as the worst year since 1788
👉 note that in the 1780s there was an ever worse performance, but check what happened after: mostly very good returns. Rule of thumb in markets: bad times create good opportunities … and here we are talking about the mighty US Treasuries (the risk-free rate / benchmark), not some small cap, EM, crypto or so
Near final tally of the "no where to hide" year. 85% of equity ETFs, 80% of bond ETFs down on the year via Athanasios Psarofagis:
🏦 Macro: FED, Interest Rates & S&P 500 Valuation🏦
Main ‘culprit’? Interest rates given inflation! FED had to step in strongly to cool-off inflation & still battling. FED, 2Y & 10Y rates & the Yield Curve in 1 chart:
👉 at 4.5% now, FED’s interest rates hiking cycle continues and note that we are currently above the 2019 local 2.5% peak while still below the 2007 5.25% peak
👉 note also how the current cycle is way less gradual relative to the previous two; in fact the FED engaged in its most aggressive rate-hiking cycle since the 1980s
👉 starting point note: ramping up nice & easy ‘data dependent’ when rates are already at 5% is different than ramping up quickly when they have been ‘nada’ 0%
👉 Note also the 2-year at 4.3% & 10-year rate at 3.8% are now back ‘below’ the 4.5% FDTR (Federal Funds Target Rate): inflation peaking & ‘peak’ FED priced in?
👉 The Yield Curve defined here via the 10Y vs 2Y, is currently inverted like Maverick in the Top Gun scene when he went into a 4G inverted dive to show ‘the birdie’ to the Russian MiG-28 enemy aircraft. ‘Is this your idea of fun, Mav?’😉, talking about birdies together with the Yield Curve!? Yeah! ‘What are you doing here? Communicating! Keeping up foreign relations (with the markets in our case😉)’ … ‘Jeez, I cracked myself up!’😉
Let’s plot now also the US interest rates across the yield curve: 1y 2y 3y 5y 10y 30y with a 20-year lookback period:
👉 3 hiking cycles in 20 years: not the 1st one nor the last one
👉 currently above the 2015-2019 period, though below the 2004-2009 cycle
Even Long Term Trends can end: looking at the 10-year interest rate alone, we see how the very long term trend of lower & lower rates ended in 2020 when we started to see rates going higher & higher with higher & higher inflation coming in strongly and biting like there is no tomorrow:
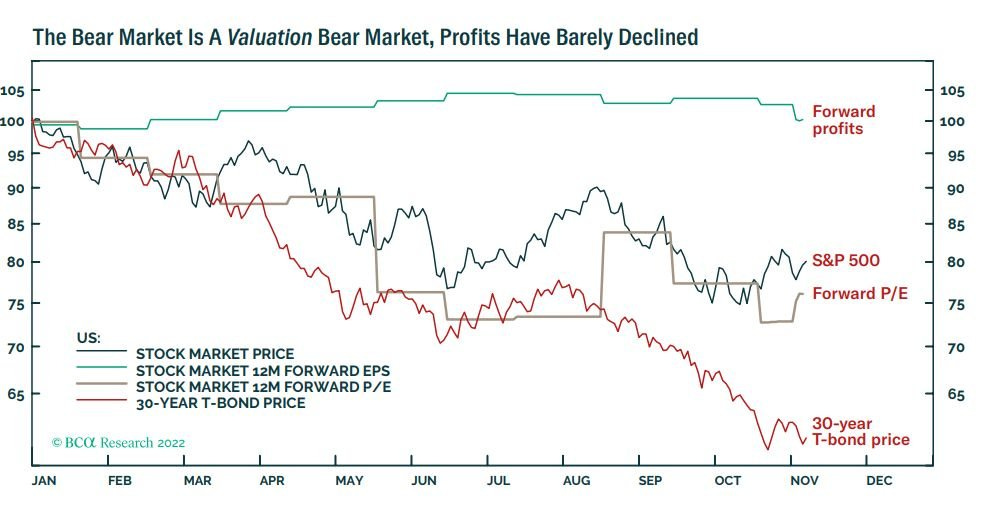
Higher rates put a lot of pressure naturally on bonds, but also on stocks via the cost of capital/discount rate in valuations. I say this because note this very interesting chart from BCA Research: S&P 500 profits barely declined in 2022 and in the first part of the year they were even increasing. Yet, price went into a bear market with the P/E multiple compressing materially. The 30-year treasury bonds took the biggest beating:
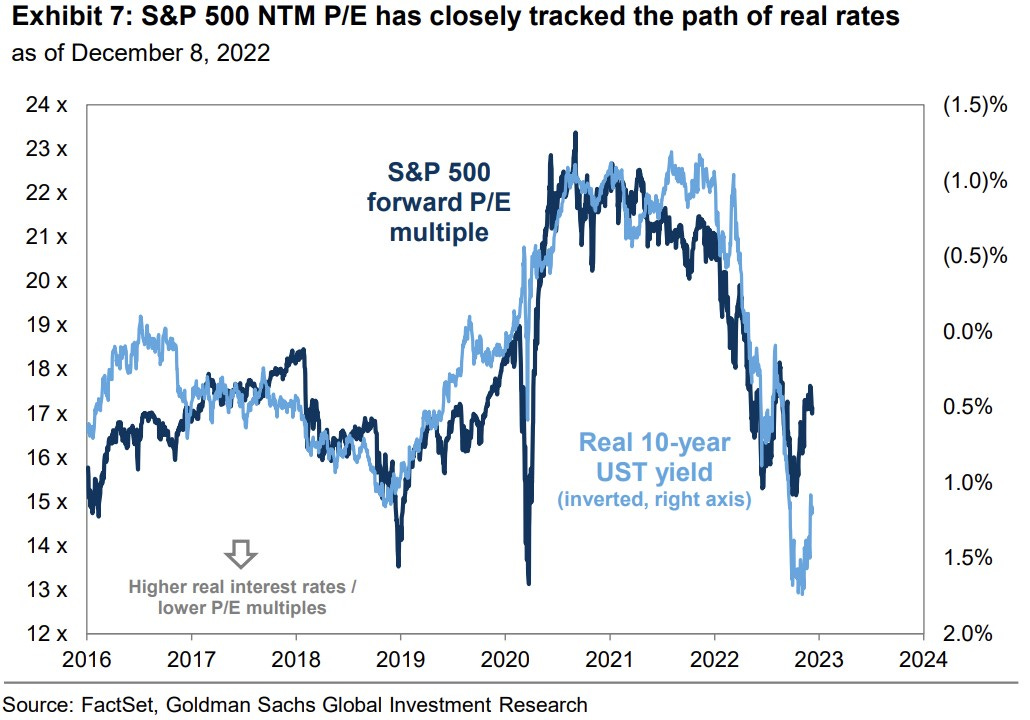
Complementary S&P 500 valuation via the real rates:
👉 P/E (forward) closely tracks the path of real rates 10-year US treasuries
👉 Higher real rates lead to lower P/E multiples & conversely lower real rates lead to higher P/E multiples
👉 2023: keeping track of real interest rates ...
Complementary S&P 500 valuation note via the WACC (Weighted Average Cost of Capital): just a year ago it was 4.1% which was close to the lowest level in history. In 2022, that turned around and surged by the markets amount in 40 years: 2% higher to 6% (from 4.1% almost a 50% increase) which is the highest level in a decade (via GS):
What about the mighty US tech stocks with higher rates & inflation? This kind of ‘long duration’ assets, did take a serious beating in 2022. Nasdaq 100 -34.56%
Tech sensitivity visualised: it moves lower with inverted real yields … bonds/fixed income shows that currently there is an alternative out there chasing yield
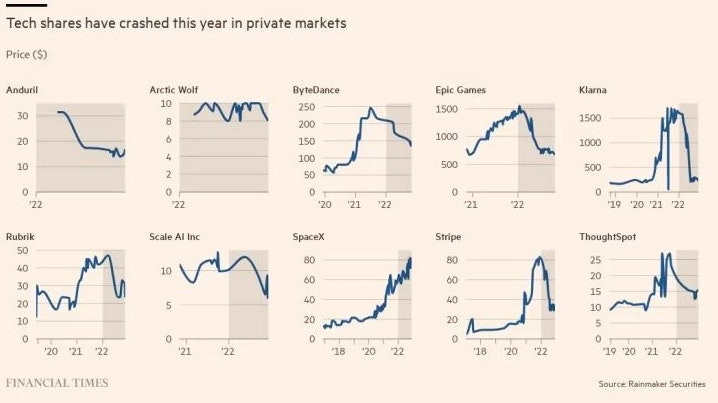
Tech valuations dropping is a public markets development only? No, tech private markets felt also the lower liquidity with higher inflation & interest rates biting:
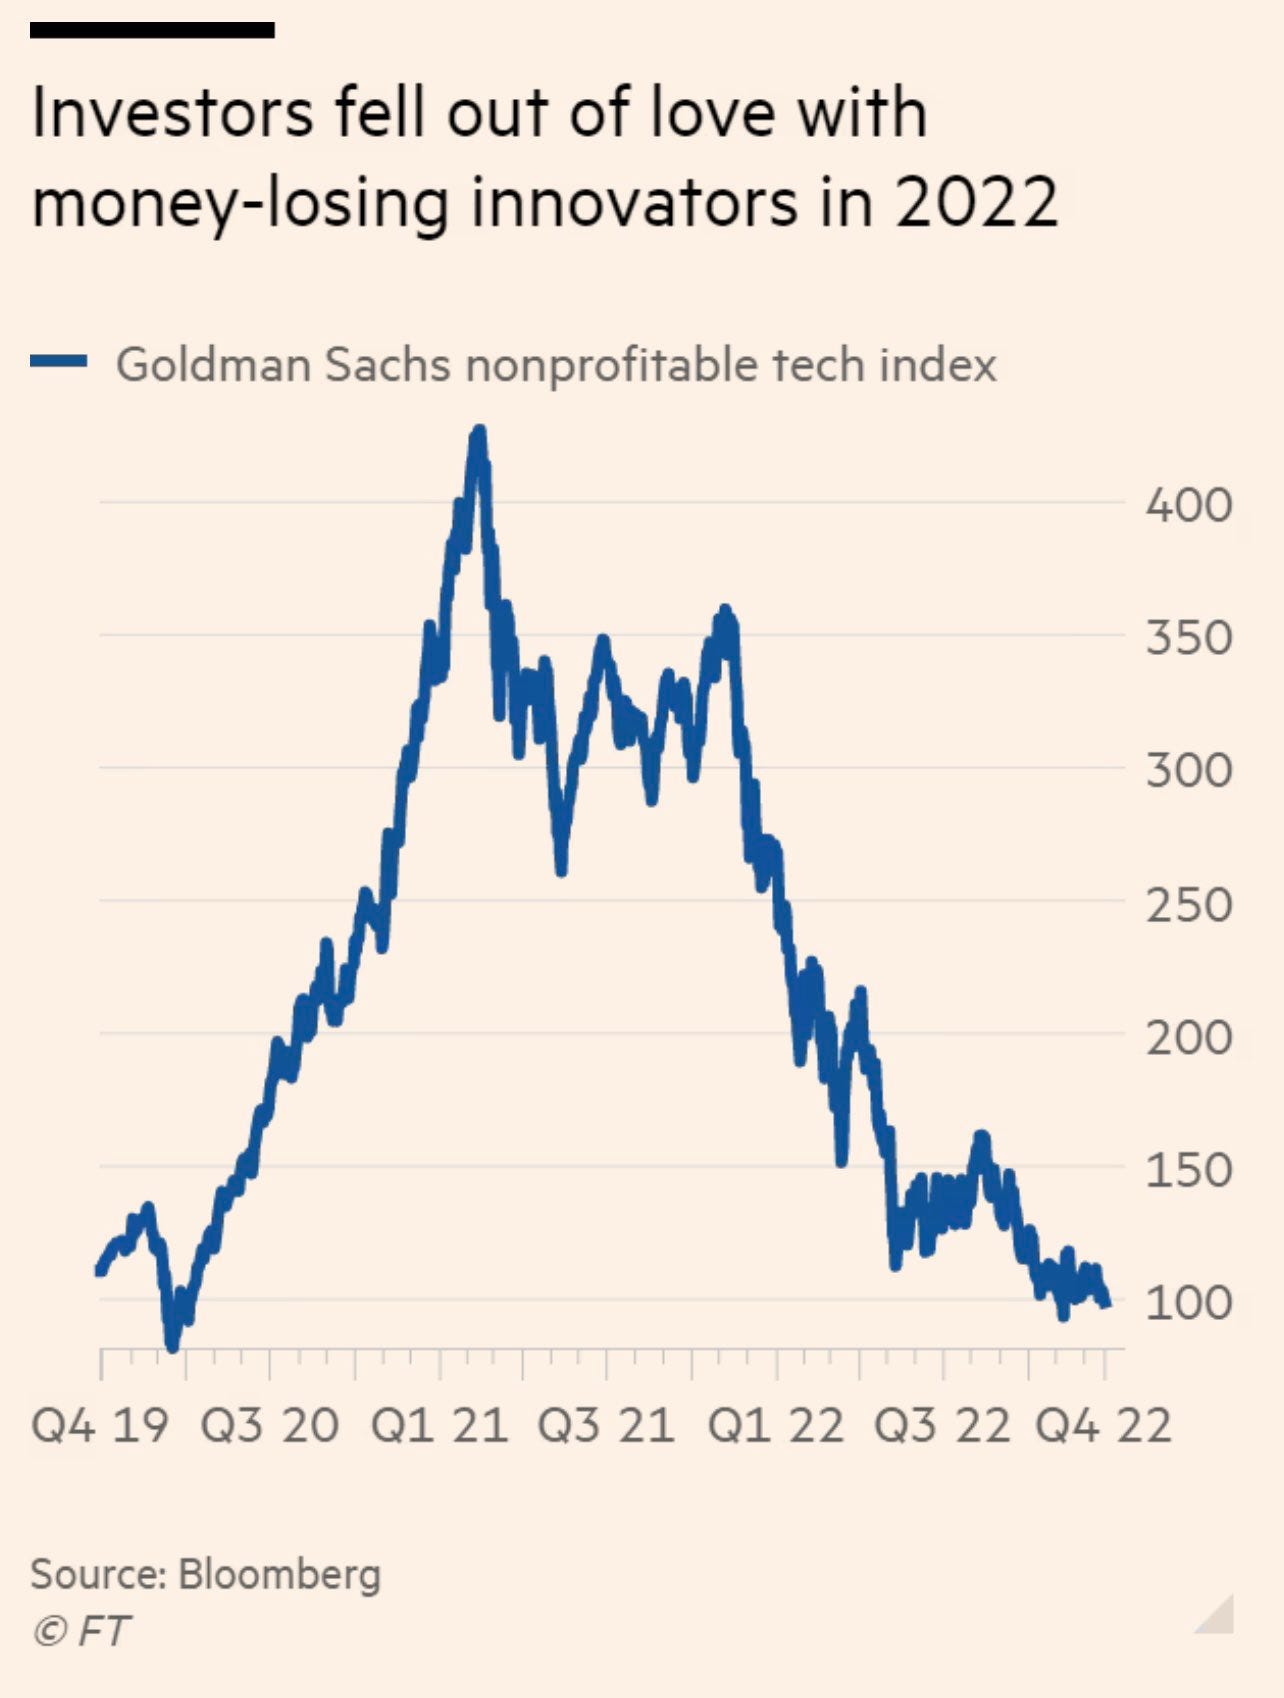
Cash flow & profitability is king & back in fashion, back to basics now:
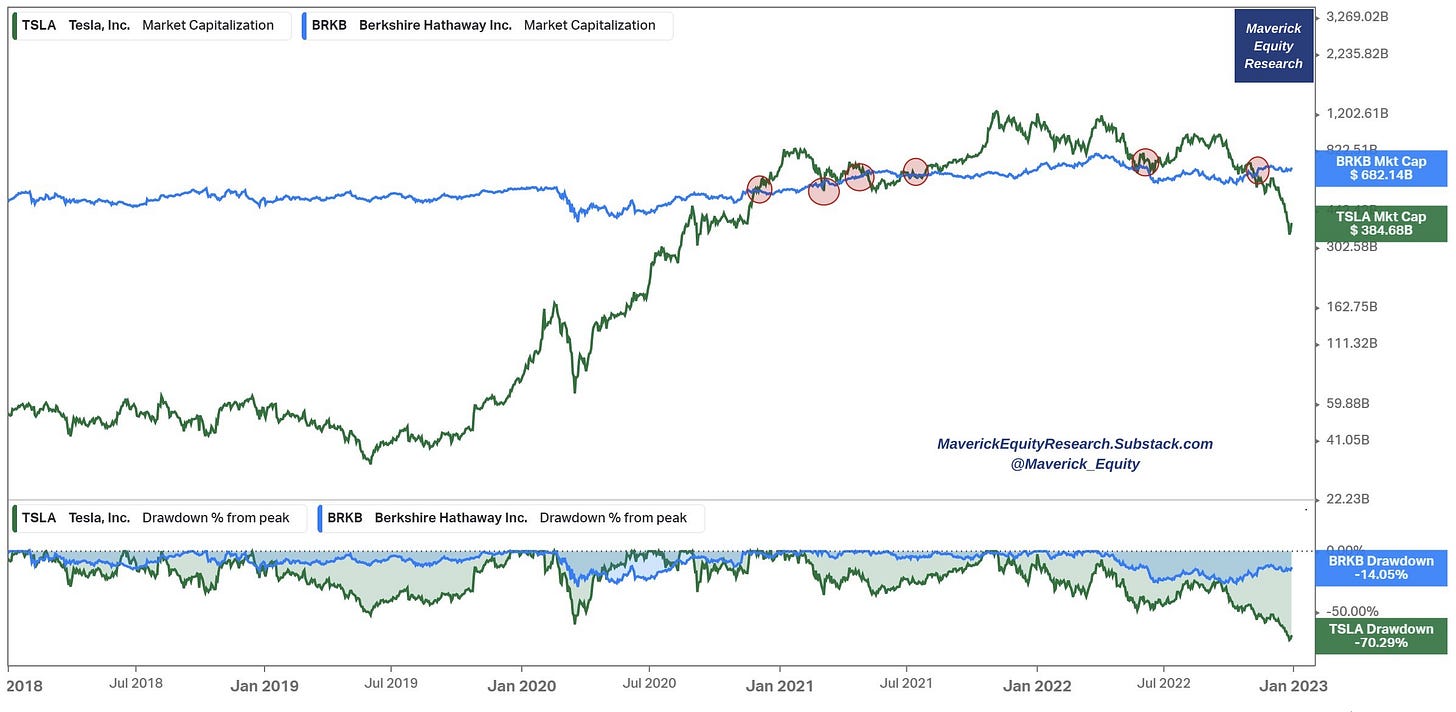
Have you wondered, what was the best signal that Tesla stock should be taken profit from or to be hedged? At some point it was 2x the value of Berkshire BRK with Buffett & Munger compounding it for many many decades … let that sink in! No matter how good Tesla is as a business and will be, stock price / valuation can be a very different ball game. Interesting how they danced 6 times so far in terms of valuation. Note also the drawdown patterns:
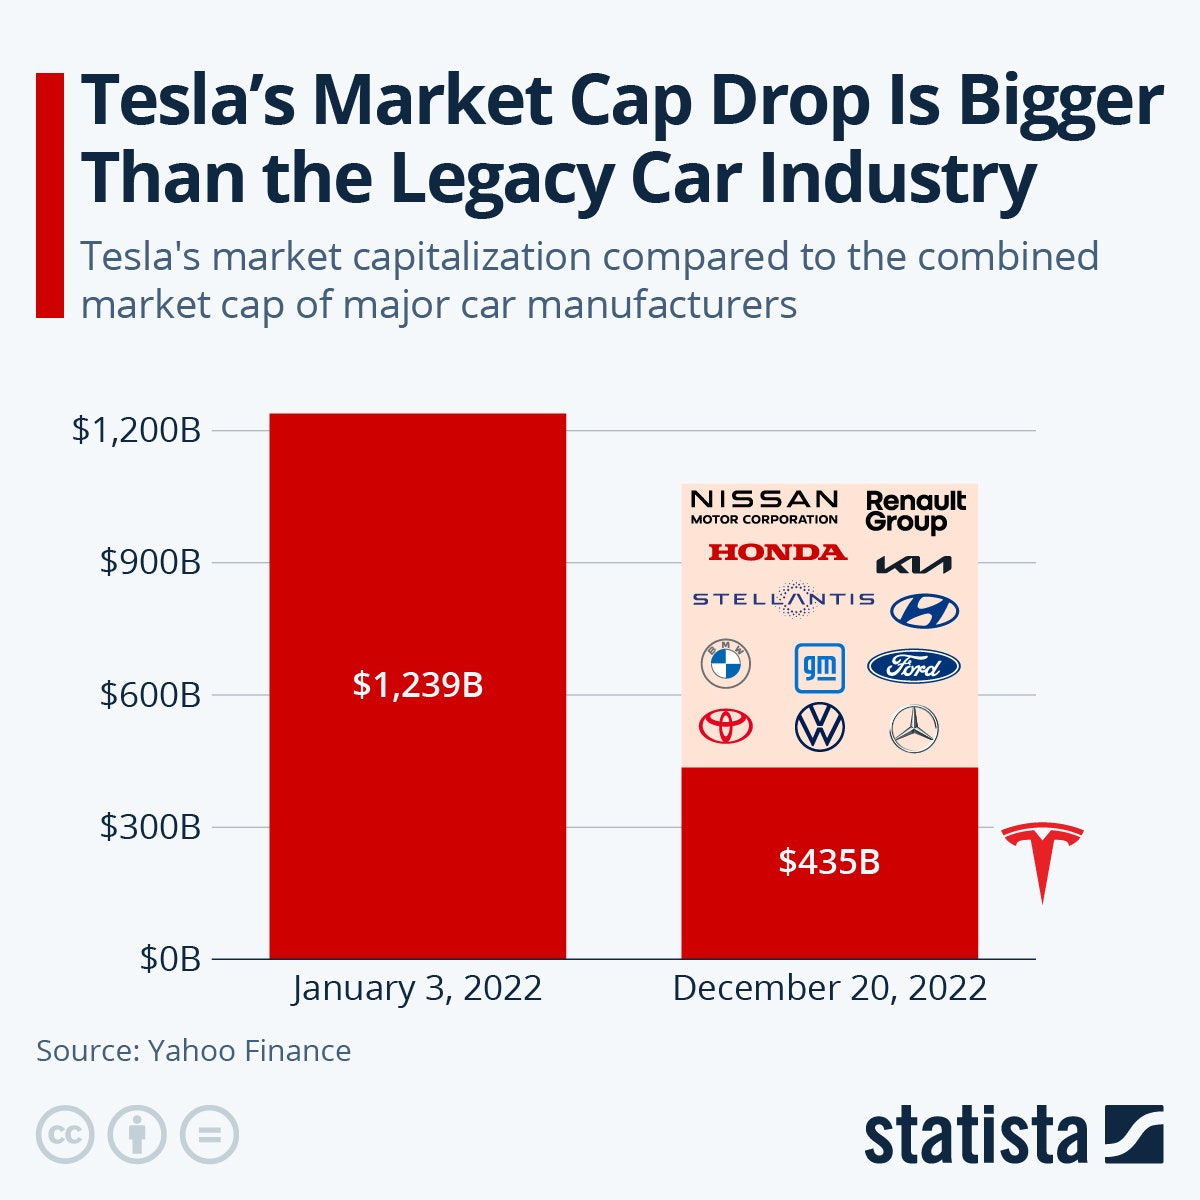
Tesla market cap drop is bigger than the combined legacy car industry…
Alternatively, via Arny Trezzi let’s look at the interesting Palantir Technologies (PLTR) situation: trading at all-time lows, -40% since going public in 2020, but with record $1.3bn Deals Closed in 2022 … 2023+ should be interesting to see …
Growth stocks have reached historic levels of underperformance. Even just a mean reversion play should yield solid returns. If interest rates fall that just adds fuel to the fire (via Game of Trades):
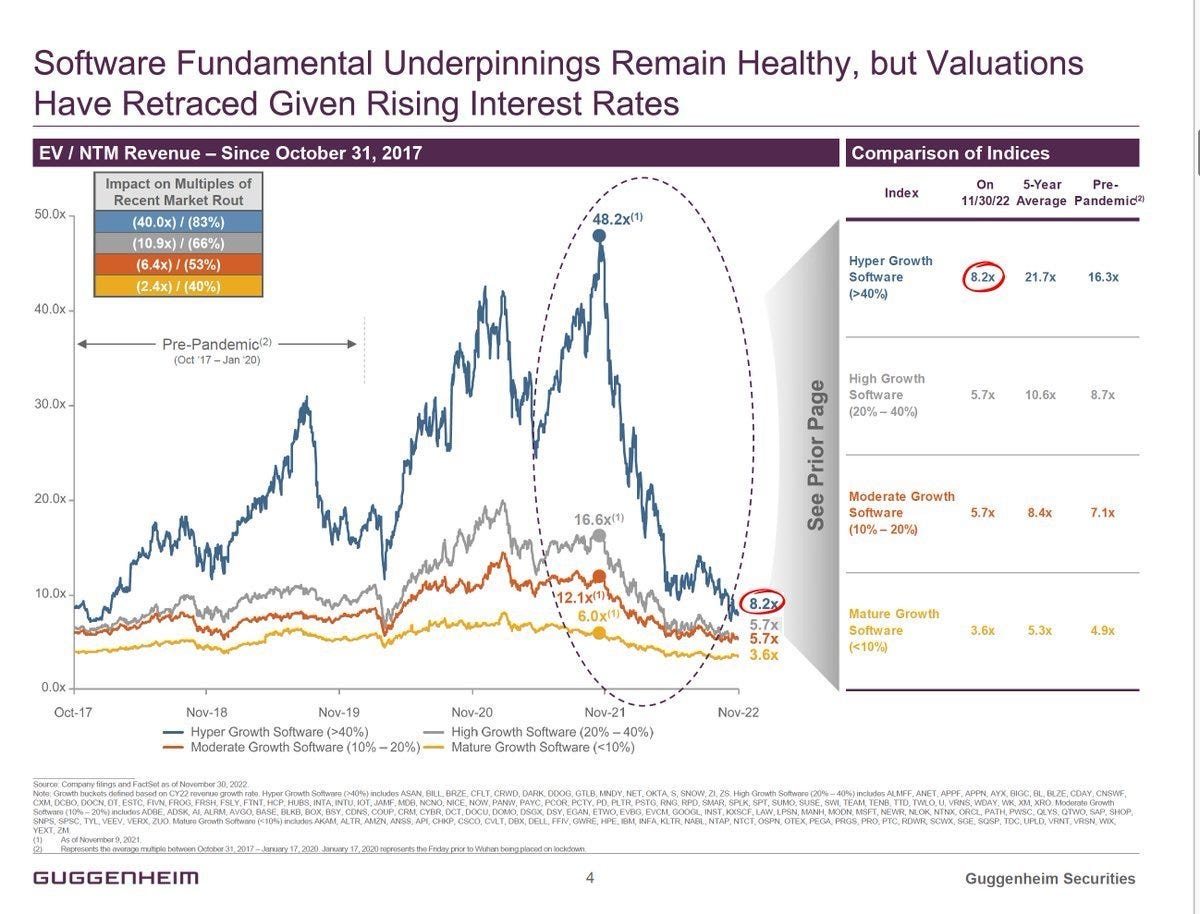
Complementary, software EV/NTM multiple since 2017 with hyper-growth, high growth, moderate & mature growth split:
👉hyper-growth (blue) a big multiple expansion even BEFORE covid & parabolic once FED/CB ample liquidity
🧐now at 2017 levels!!! Overcooked up & now on the way down? Opportunity?
Going forward, inflation cooling off & rates to follow aka FED pivot? For that let’s have a look at the M2 money supply 12m % change since 1959: FED bazooka deployed once Covid crash, bazooka removed once inflation came: inflation should take it easy from here
Container shipping costs back to pre-pandemic levels, should cool-off inflation:
Supplier delivery time, from supply scarcity and bottlenecks to supply abundance:
📊 Special Country Report 📊
My 2022 Country Special Report pick is: GREECE 2.0: CONTEMPLATING FUTURE GROWTH via Nicolas Roth from REYL Intesa Sanpaolo. Report access.
Greece is fully emerging from all recent crisis and is now ripe for radical transformation and growth
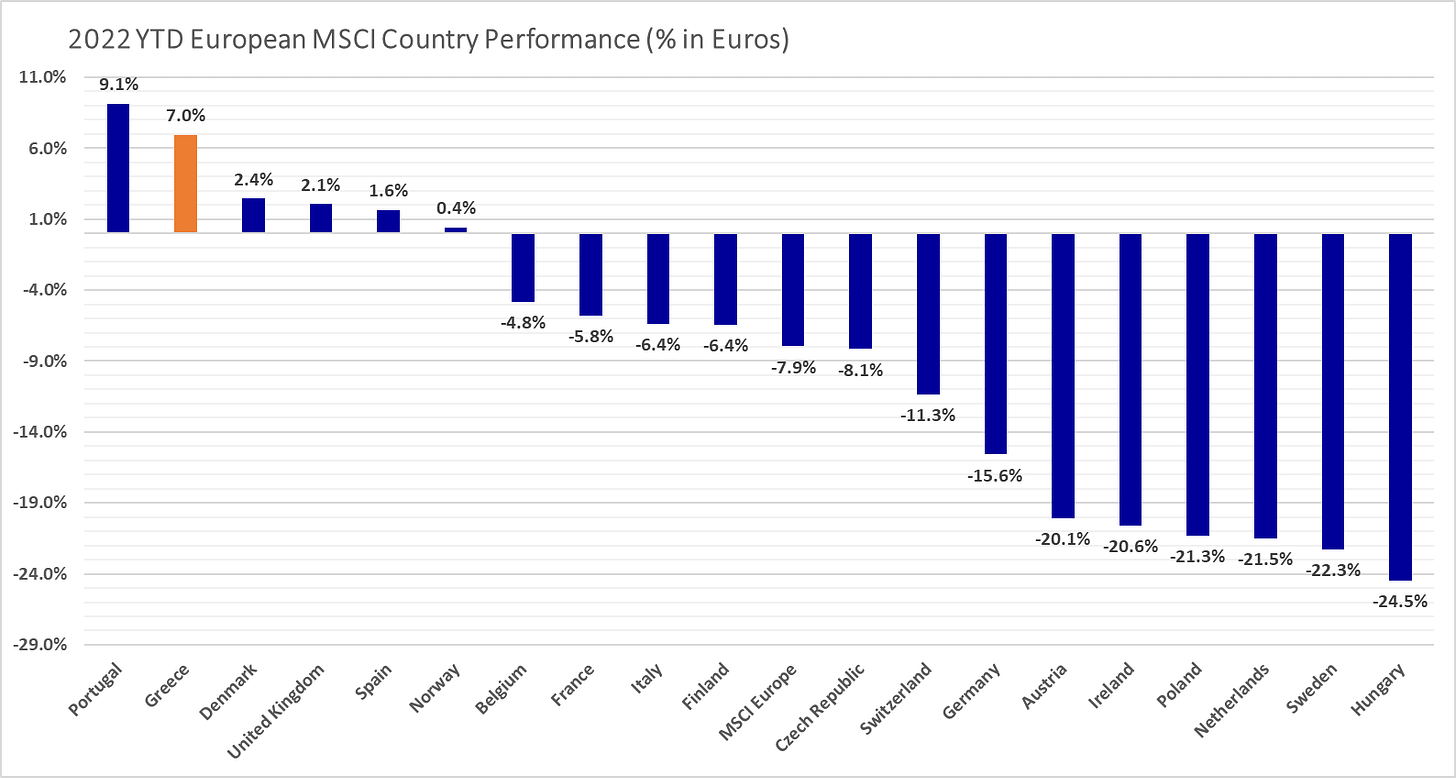
Greece is quite under-covered lately & stock market wise, via Sofokleous Street: unbelievable resilience by the Greek stock market this year. 2nd best in Europe and one of the only few global markets with a positive return in 2022 …
👍 Bonus Charts 👍
From the crypto space: following last month's FTX debacle Bitcoin & Ether have been consolidating at lower levels:
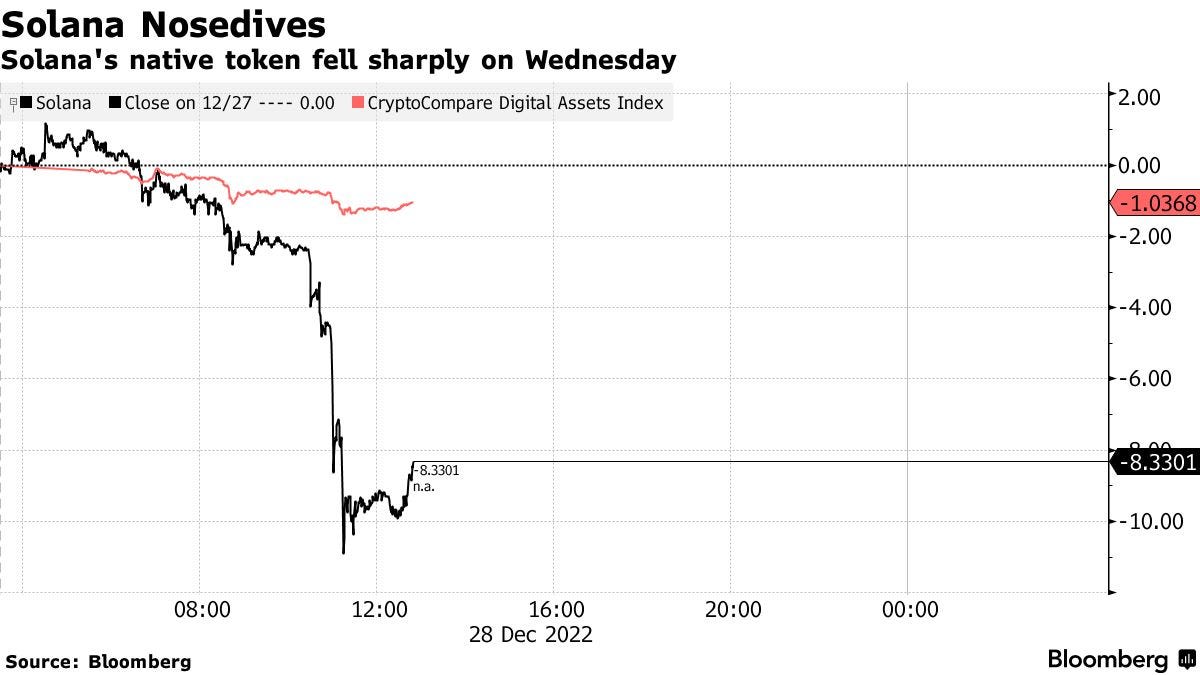
Solana keeps tumbling bringing crypto token’s 2022 plunge to 94% given its close connection with the SBF debacle:
Coinbase (COIN) market cap dropped from $75bn to $7.98bn = 90% drawdown. Fun fact: Dogecoin is now worth more than Coinbase (largest U.S crypto exchange) & Silvergate (largest U.S crypto bank) COMBINED!
Let that sink in!
Next shoe to drop in the crypto 'land'? Crypto miners MARA (Marathon Digital) >36% short interest now ... could be hedge funds, also 'classic' investors (both retail & pros) that were waiting for the right time to deflate empty boxes ...
Have you wondered: what is the number of months in 2022 that the S&P 500 has been UP or DOWN at least 7.5%?
👉 5 times! Not much, a lot, an outlier ?
👉 Well, that is the most (at par) since 1937! That is since pretty much everybody started investing & trading. One more occurrence in November/December and we have one for the history books in 2022 ... let that sink in!
👉Choppy market, trying to time it ? Source: GIR
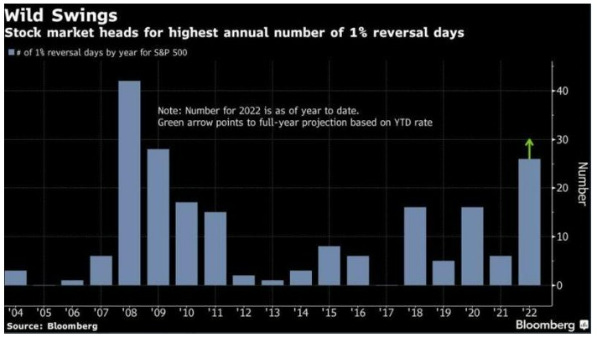
Curious about 1% intra-day reversal days? 2022 setting up to be the year with the most swings of this type since 2008
S&P 500 (SPY) spent 200 days (81% of the year) below its 200DMA moving average, source Athanasios Psarofagis:
What happened with the usual sweet Christmas Rally? Santa is no where to be found. Big outlier this year: we have the 3rd WORST DECEMBER for the stock market IN HISTORY going back to 1926.
Contrarian indicator - CEO Business Confidence:
👉 currently at the lowest level since 1985
👉 good time to DCA cheaper into equities and/or lump sums?
Retail investors sentiment & the S&P 500: as low as during the Covid crash with indiscriminate selling ... Surprised or not ? I am ... not that it is low, but that low. Just like with the CEO confidence metric, this is imo a contrarian indicator.
Recession expectations ?
👉 peaking / turning among investors ...
👉 these expectations coincided with the: '09 (GFC/Lehman implosion) and '20 (Covid Crash) bottoms ... Long 2023+?
Should we expect for a good 2023+ rebound in equities given 2021 & 2022 correction 'outliers'? In 100 years, drops in the 2nd year have been deeper than in the 1st with a 24% average decline. That exceeds this year's decline by 20% ... this time will be different or not
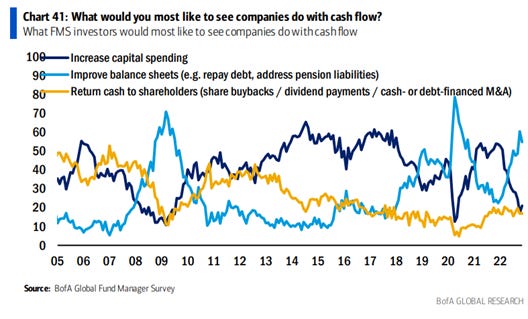
Portfolio Managers seek safety in corporate balance sheets searching for the right stocks to buy: BofA Survey shows respondents overwhelmingly desire firms to improve balance sheets rather than prefer executives invest in capital projects or return cash to shareholders
Where does the money go in January ? It goes into the laggards typically:
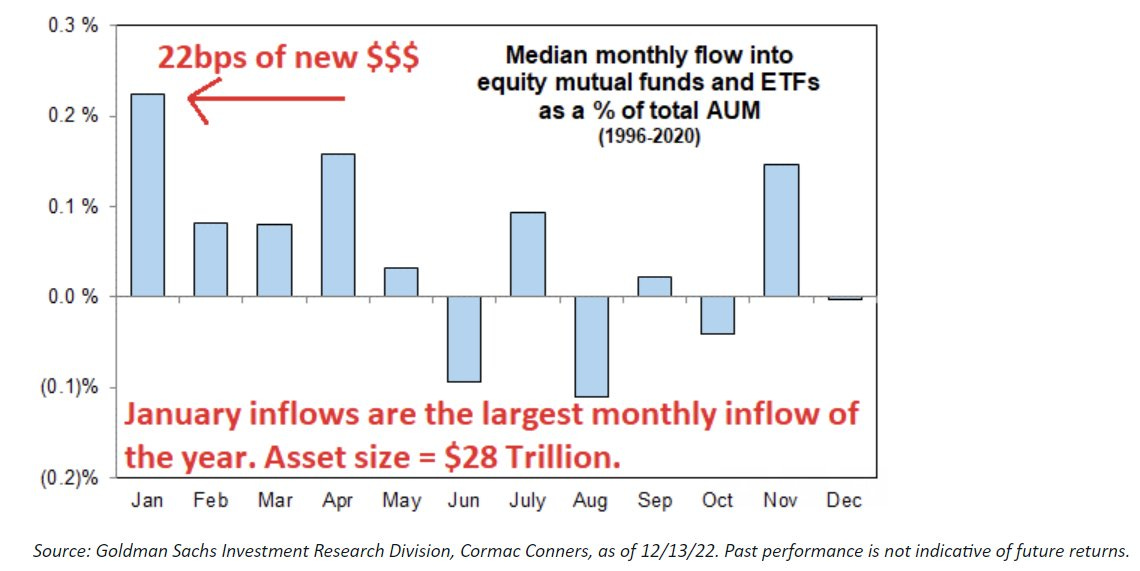
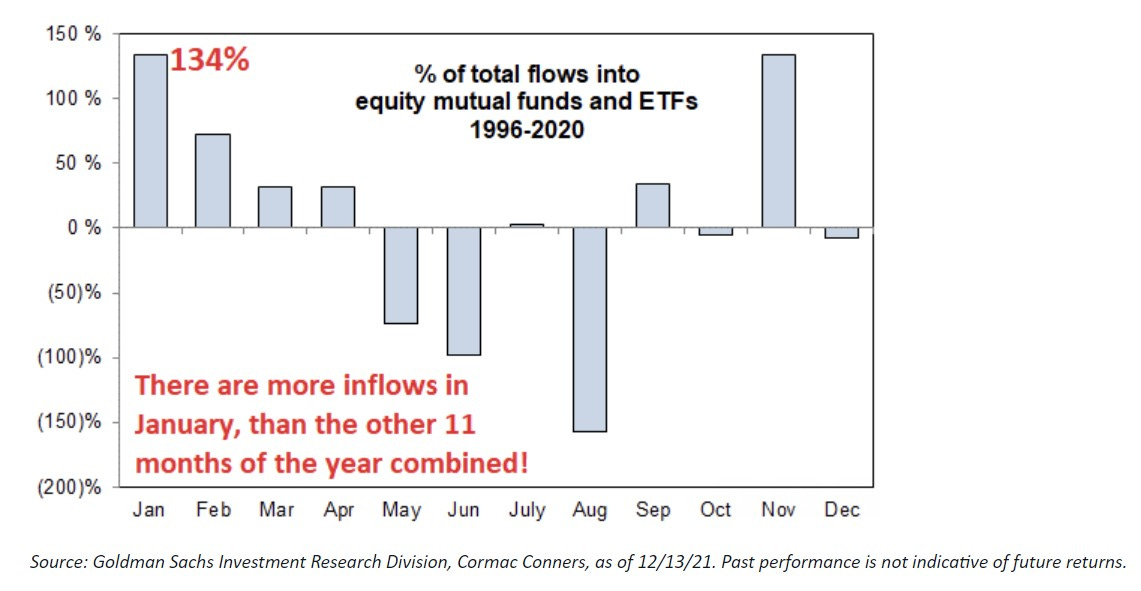
How much action? January Flows as the biggest market dynamic:
👉 22bps of new money (not including money leaving bonds/cash) comes into the market every January... = $62bn of new money
👉 more inflows in January than the other 11 months of the year combined
I hope you enjoyed this Special Edition. What would help a lot from your side? Easy, just spread the word around & share this with people that might also be interested.
In January, my 2023 Outlook with a focus on the S&P 500 will follow. Furthermore, Full Equity Research on single stocks will start, more stocks screeners, trading ideas/special situations & sleek valuation scatterplots across sectors and peers!
Have a great New Year’s Eve and a great 2023!
Maverick Equity Research























Great review! That Tesla & Berkshire valuation chart is crazy! Thanks a lot! For a great 2023!
great insights ... thank you and a great 2023 to you as well!