✍️ Maverick Special Situation #3: Getting Tactical with Nasdaq-100 ($QQQ): Valuation Disconnected via its Cost of Capital
Gap opened up possibilities: Hedge, Sell, Trim, Short Sell, Collar
Dear all,
here we go with another Special Situation, and this time covering the mighty and popular Nasdaq-100 Index (NDX). As for an investable ETF, I chose the liquid QQQ. Hence, naturally this coverage is targeted to growth/tech/large cap investors & traders. Even if all set, passive or so, I think it’s an interesting educational case to introspect.
Before the thesis, this report is NOT behind a paywall & there are no pesky ads here. It would only be highly appreciated you just spreading the word around to interested people. Questions, feedback are welcome. Enjoy it!
Nasdaq-100 report structure:
📊 Nasdaq-100 (QQQ) Dynamics
📊 Thesis: Valuation Disconnected via its Cost of Capital = Discount Rate
📊 Action: Hedge, Sell, Trim, Short Sell, Collar
📊 Nasdaq-100 (QQQ) Dynamics
I’ll approach this progressively so that everybody is on board on this one. First of all, let’s see how the Nasdaq-100 (QQQ) did in 2023 along with the S&P 500 (SPY) and the Dow Jones (DIA): QQQ with a big 21.64% return in 2023 & outperforming by a big margin the other 2 main indices.
For an even broader perspective, US indices 2023 performance shown in this order: Nasdaq 100 (NDX) > S&P 500 (SPX) > S&P Midcap 400 MID > Russel 2000 (RTY) > Russell Microcap (RMICRO). In short, from Megacaps > to Microcaps: Nasdaq 100 (NDX) leading by a big margin … quite an outlier one can say …
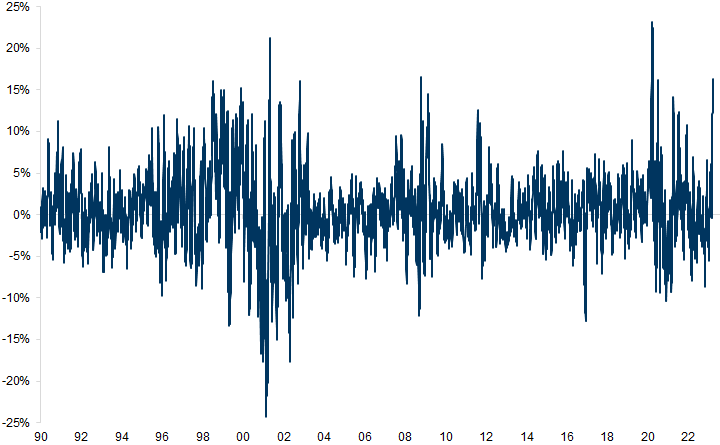
Nasdaq vs. Russell 2000 relative return (monthly): sharp outperformance of long duration Tech vs. US domestic cyclicals
3 complementary key notes for curiosity & introspection:
looking inside QQQ at the individual names performance in 2023 via 2 angles: Price return % and holdings weight (Nasdaq-100 is a modified capitalization-weighted index): the big & popular names driving a lot of the 21.64% performance in 2023: AAPL, MSFT, AMZN, NVDA, META, GOOG, TSLA:
Key question now: is the 21.64% return in 2023 concentrated? Yes, namely 16.17% is driven by just 7 names: AAPL, MSFT, NVDA, META, AMZN, GOOG = that is 77% (16.17/21.64) of the entire performance!
let’s see also how it looks unweighted via the 2023 return % & above 52-week low %: weighting does matter quite some
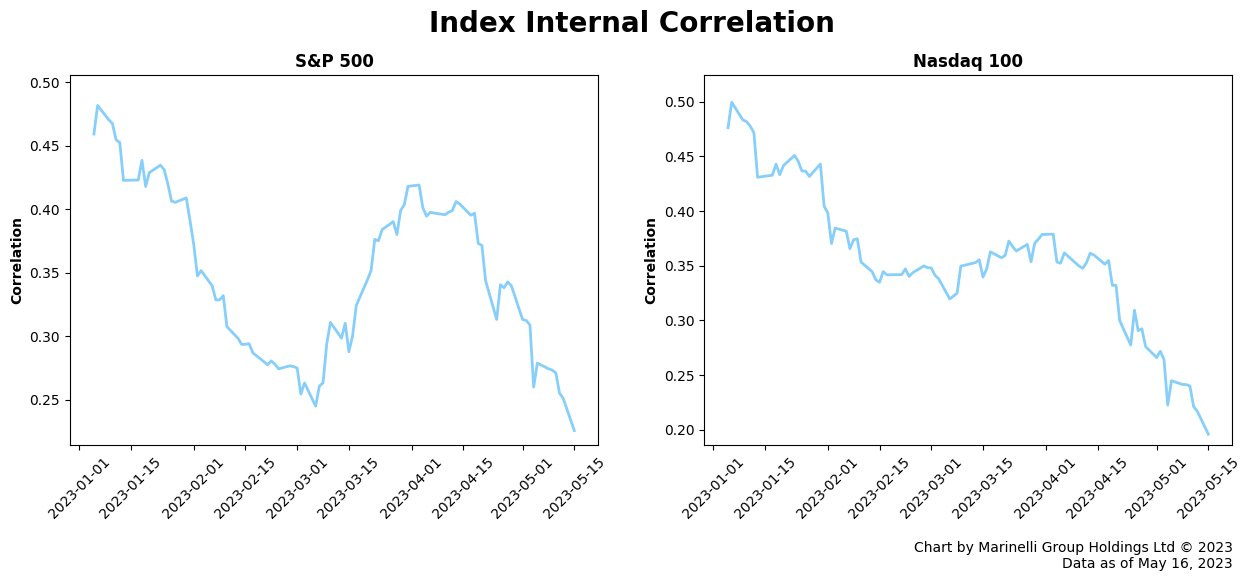
return correlation between the components of the Nasdaq-100 and S&P 500: steadily declining for a while now, further highlighting how the performance of $QQQ & $SPY truly comes down to just a few names rallying hard …
📊 Thesis: Valuation Disconnected via its Cost of Capital = Discount Rate
You might ask yourself now already: how can one easily know or calculate the cost of capital of the entire Nasdaq-100 index to make any inference? Well, bottom-up taking all 101 holdings and doing one by one calculations to come up with a single figure is possible but very consuming and subject to a wide margin of error. Alternatively, Goldman Sachs has a nice approach for a proxy which I like and have been using.
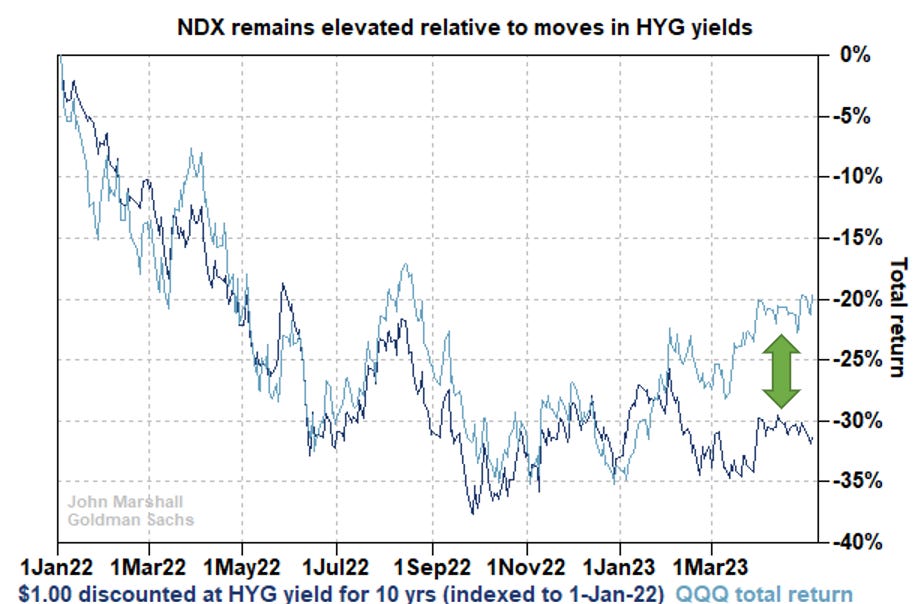
Namely, below we can see QQQ total return & the change in valued for a theoretical company with $1 of cash flow 10-years from now discounted by the HYG yield (high yield corporate bonds) as a good proxy for how changes in the cost of capital have affected the value of growth stocks (QQQ):
Interpretation:
Nasdaq-100 has materially outperformed its normal relationship with HY bonds (high yield corporate bonds) bonds by a major 12%
why or how, possible rationale? Nasdaq-100 seems have pre-priced FED cutting interest rates that is not yet priced into high yield bonds - most of the times, the bond market is smarter than the equity market the saying goes
note how the relationship was remarkably stable from January 2022 to Jan 2023, but the Nasdaq-100 has recently dislocated
we have a gap now & if by chance you are a Formula 1 fan as well, you will like this analogy: Ayrton Senna is famous for saying: ‘If you no longer go for a gap that exists, you no longer a racing driver‘
Secondly, we can see also the disconnect between the Nasdaq & the US 10-year real yield (inverted in the chart): gap is big if anybody asks me …
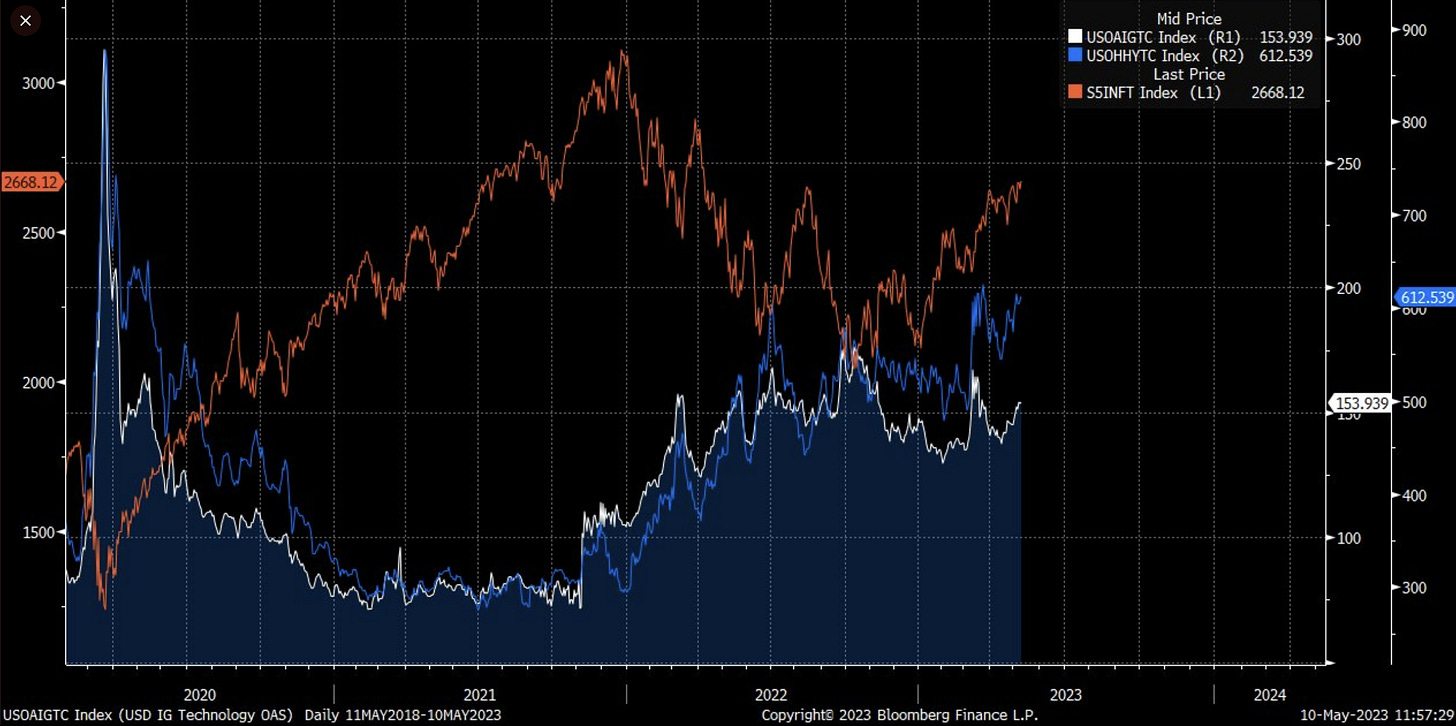
Complementary & lastly to sink this one in: since 2020 below we have the inverse relationship between the tech sector & spreads with Tech (orange), High Yield spreads (blue), Investment Grade spreads (white):
during the Covid crash: spreads spiked massively, tech fell of strongly
after as spreads contracted, tech gained materially along with the overall recovery
see the most recent 2023 move which is the thesis: both investment grade and high yields spread increased, yet tech did not fall but increase materially 21.64%
📊 Action: Hedge, Sell, Trim, Short Sell, Collar
Given the above, what possibilities are on the table? Many for many use cases & views:
Sell QQQ if already invested - nobody got hurt ever booking a profit - one can always get back in, the markets will always open …
Trim QQQ: book some profits, remain long with the rest … hard to say QQQ will do bad 3-5-10-20 years down the road given the shown companies inside
Short Sell QQQ via SQQQ: not my style, but if capacity & risk management
Collaring QQQ via options: selling Calls & buying Puts (short calls, long puts)
My favourite 1: hedge QQQ buying Puts (long puts) to protect the gains, or if no position, long puts should gain in value if QQQ drops from here
My favourite 2: staying invested with a twist via JEPQ (JPMorgan Nasdaq Equity Premium Income ETF): actively managed & seeks to deliver a big portion of the returns associated with the Nasdaq 100 Index with less volatility. That is like QQQ, but with downside protection & seeking to deliver a monthly income stream from associated option premiums and stock dividends.
JEPQ 2023 performance & dividend yield:
Lastly for high conviction via high return & risk, below 2023 performance of 3 leveraged ETFs that play QQQ, 1 short & 2 long: -3x short (QQ3S), 3x long (QQL3) and 5x long QQQ (QQQ5):
Did you find this Special Situation interesting? What would help a lot from your side? Very easy, just spread the word around & share this with people that might also be interested into this coverage. Twitter post can be found here. Thank you!
Feel free to reach out to me personally here or via Twitter @Maverick_Equity.
Have a great day!
Maverick Equity Research
Disclaimer: information on this site should not in any case or form be considered financial, business, tax or legal advice, but independent research done by an independent investment researcher and investor for informational & educational public discussions only


Great write up, Maverick
At the outset Kudos for great research and different approach. I just subscribed and plan to read the previous posts.
On this special edition thesis - disconnect in Cost of Capital - and the attribution ie NDX pricing in Fed rate cuts seems spot on.
I think 🤔 we might get additional insights by:
1) back test if this phenom was experienced in previous rate cycles since 1980s ?
2. Depending on insights from 1 above - role of the recent acquisition of SVB book by GS. At what point would GS be ready to flip for profits
3. if this truly is a gap of historical proportions - is there a fundamental shift in Tech valuations especially with AI mania, upheaval in semiconductor supply due to geo political shocks
I personally think NDX is overdone but additional confirmation always helps.
Thank you 🙏 again
3.