✍️ In The New Bull Market, Which Are The Most Shorted Stocks? An Interesting Research Question Answered!
More interesting to answer in a Bull market than in a Bear one ...
Dear all,
we have a new bull market and it is time to counterintuitively answer the research question: what are the most shorted stocks? To me, it is always more interesting to find that out during a bull market than in a bear one. That’s because in a bear market often even good companies get punished via sentiment and ‘flight to safety’ which is actually an opportunity, but more on the ins & outs of that in a future special edition.
Coverage for the most shorted stocks will be also on the Big 3 indices: Dow Jones, Nasdaq 100 & the S&P 500. That is similar and highly complementary to the recent Maverick Valuations where naturally the focus was on valuations. As well, you can read The S&P 500 Report in case you missed it. Everything connects as you very well know.
Just 1-click to subscribe if you aren’t yet receiving my research & sharing it around.
Report structure:
📊 Bear & Bull Markets
📊 The Most Shorted Stocks
👍 Bonus Charts 👍
📊 Bear & Bull Markets
2022 was a bear market for stocks and it marked the worst one since the 2007-2009 Global Financial Crisis (GFC). The latter saw the S&P 500 down by 37% in 2008, while 2022 finished down by 19%. However, a key note that is very often overlooked: when you factor in inflation-adjusted returns, the performance of the S&P 500 in 2008 was only about 10% worse than in 2022 (2008 CPI -0.02% while 2022 CPI +8.3%)!
This created a perfect environment for short sellers to shine, in both stocks & bonds! There were not many places to hide, though another key note: while indeed bonds got crushed heavily (as we heard many times) due to ramping inflation and naturally higher interest rates, another key note:
👉 SHV (1-year or less maturities, cash proxy): even with ramping inflation & interest rates, ended the year with a remarkable positive +0.89% - let that sink in! Also many hedging instruments & strategies worked very well, some even with double digit returns, but that’s for a future key research piece on risk management & hedging.
👉 TLT (20-year+ maturities): took the biggest pain being down -31.24%
👉 AGG (US investment grade: treasuries, corporate, MBS, ABS, munis): -12.93%
2022 total returns: SPY, TLT, AGG, SHV:
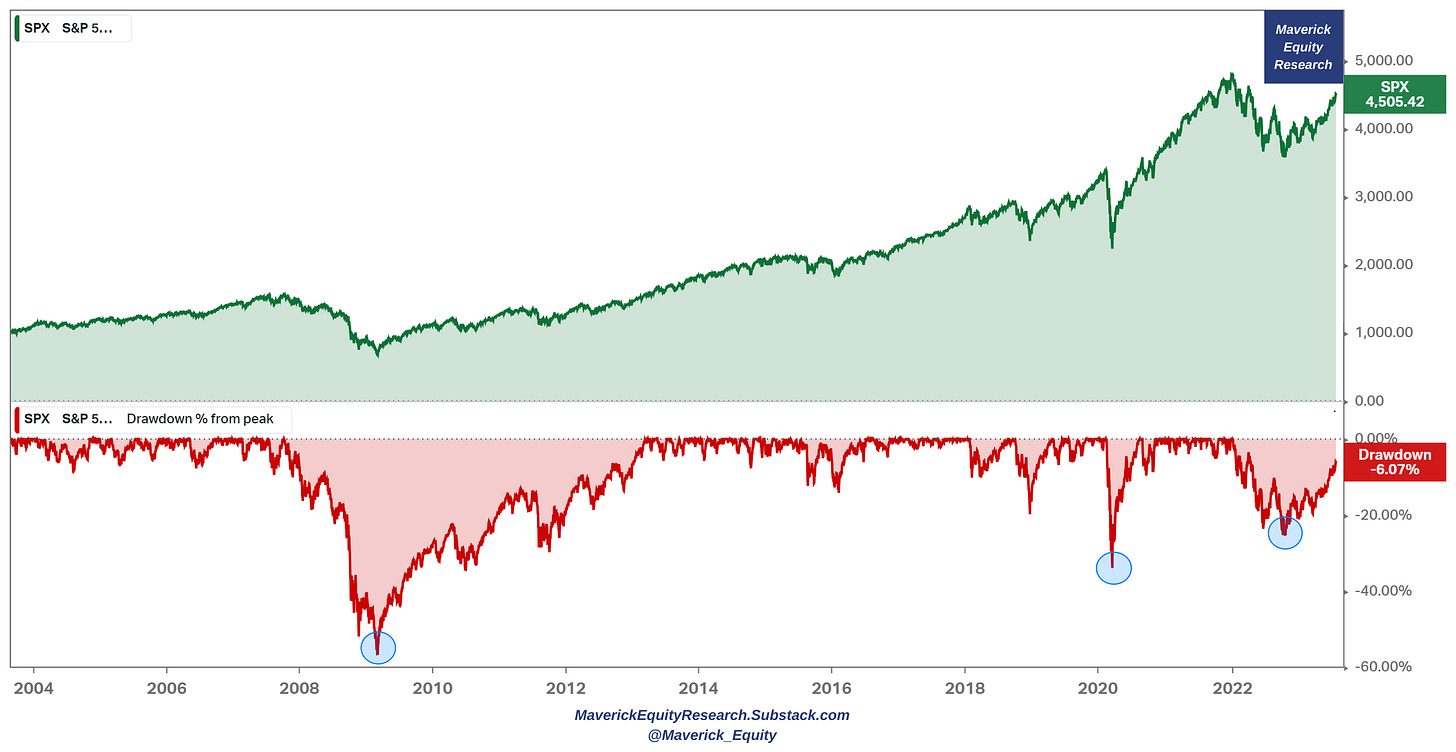
From a maximum drawdown (peak-to-trough decline) perspective:
👉in 2022 we recorded a -25% which except
👉 the 2020 Covid crash with a -33.5%
👉 was the worst one since the whooping -56.8% in 2008 - let that sink in!
A personal anecdote here now: in 2008 I was down 52%, yes 52%! Believe it or not, happy to say it as it was the best lesson I could ever have and unless experienced, cannot be fully personally immersed: it really made me think as owning pieces of real businesses where employees and management go every day to do (most of them) their best and move things forward … versus owning or playing around with ticker symbols which quite some times move based on sentiment or randomly … which can be both a blessing and a curse … to me these days it’s the former.
S&P 500 performance & drawdowns for the past 20 years:
Back to today, we have a new bull market via the popular +20% definition. The Big 3 indices are up >20% since the 2022 bear market lows. Nasdaq-100 (QQQ) leads with a whooping +44%, S&P 500 (SPY) with +27% while the Dow Jones (DIA) with +21.65%.
Some do not like this +20% return definition from the previous low to call it a new bull market, hence are rightfully more picky by saying it should also or at least reach the previous all-time high: the Big 3 indices are less than 5% close to their all-time highs.
Now do they all reach new highs in 2023? Quite likely and even if not this year, they will sooner or later … as long as you believe in humanity making progress, hence economies developing and stock prices just reflecting that via some digits on a screen.
S&P 500 stocks 2023 returns categorized by sectors & industries (size = market cap):
All stocks listed on US stock exchanges by sectors and industries (size = market cap):
Always interesting to check a risk-on & sentiment proxy in the markets, and that is the hyper-growth / innovation investing theme via the Ark Invest ETFs: huge returns!
Wonder about volatility these days? The VIX (volatility index) at multi-year lows. Almost at Q4 2019 pre-Covid spike levels.
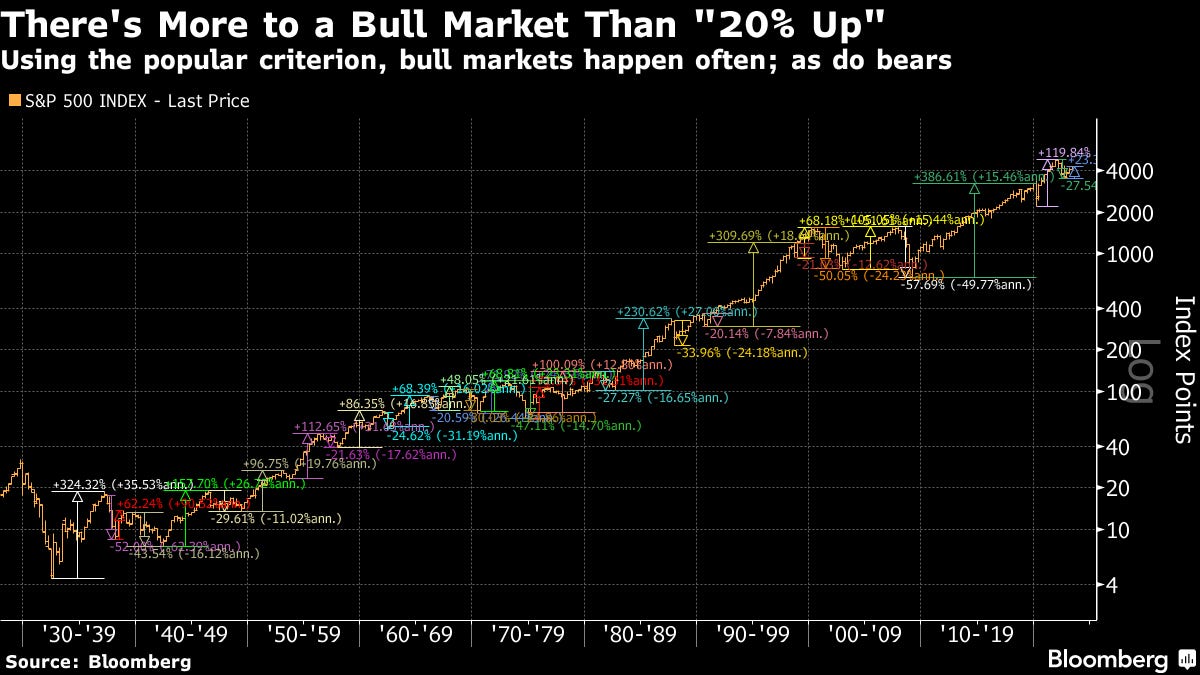
You might wonder, how often do bull & bear markets happen? A single chart can say 1,000 words & below the S&P 500 bull & bear markets since the 1929 Great Depression via the 20% +/- definition:
20% +/- moves happen quite a lot ... what's for sure is that economies and societies evolve, hence the stock market just prices all that in ...
bear markets are always transitory be it recessions, pandemics, wars, inflation, interest rates … hence if you are bullish on humanity, being bullish on stocks is the moving train hard to stop with the …
What about historical drawdowns (% and duration) during the last 9 decades? Like bear markets, they come and go … only ‘permabears’ think all the time the world is crumbling … yet the moving train marches on and on … just check the big up moves in terms of both size and duration!
In this new bull market, we marked a new year-to-date high for the New York Stock Exchange New Highs – New Lows list. You can’t have a bull market without bulls, meaning an expansion of new highs.
The magic question now: was the new bull market to be expected?
In January this year I wrote a piece where I was previewing incoming flows and if there was dry powder cash sitting on the sidelines ready to be deployed. If you missed it: January New Money Flows = The Biggest Market Structure Dynamic!
‘is there dry powder cash sitting on the sidelines? Yes! Actually, it has been the money flow winner in 2022! Does any of that Cash come back into and go into stocks & bonds? It should: inflation is burning cash in stealth mode & reduces purchasing power … time value of money 101.’ Simply put, money is flowing on and on and it has to go somewhere …
We also know that historically, following a down year the S&P 500 is up 86% of the time in the second half of the year and 100% of the time for the entire year
📊 The Most Shorted Stocks
Now that we did set the scene properly, let’s answer the subject research question: which are the most shorted stocks in the new bull market?
For that we’ll look at and inside the Big 3 indices: Dow Jones (DIA), Nasdaq-100 (QQQ) & S&P 500 (SPY): despite a 2023 rally, quite constant short interest levels with the Dow the lowest & SPY the highest. Note the recent down tick for all 3!
Going with a 2D view and showing besides the short interest, the 2023 returns:
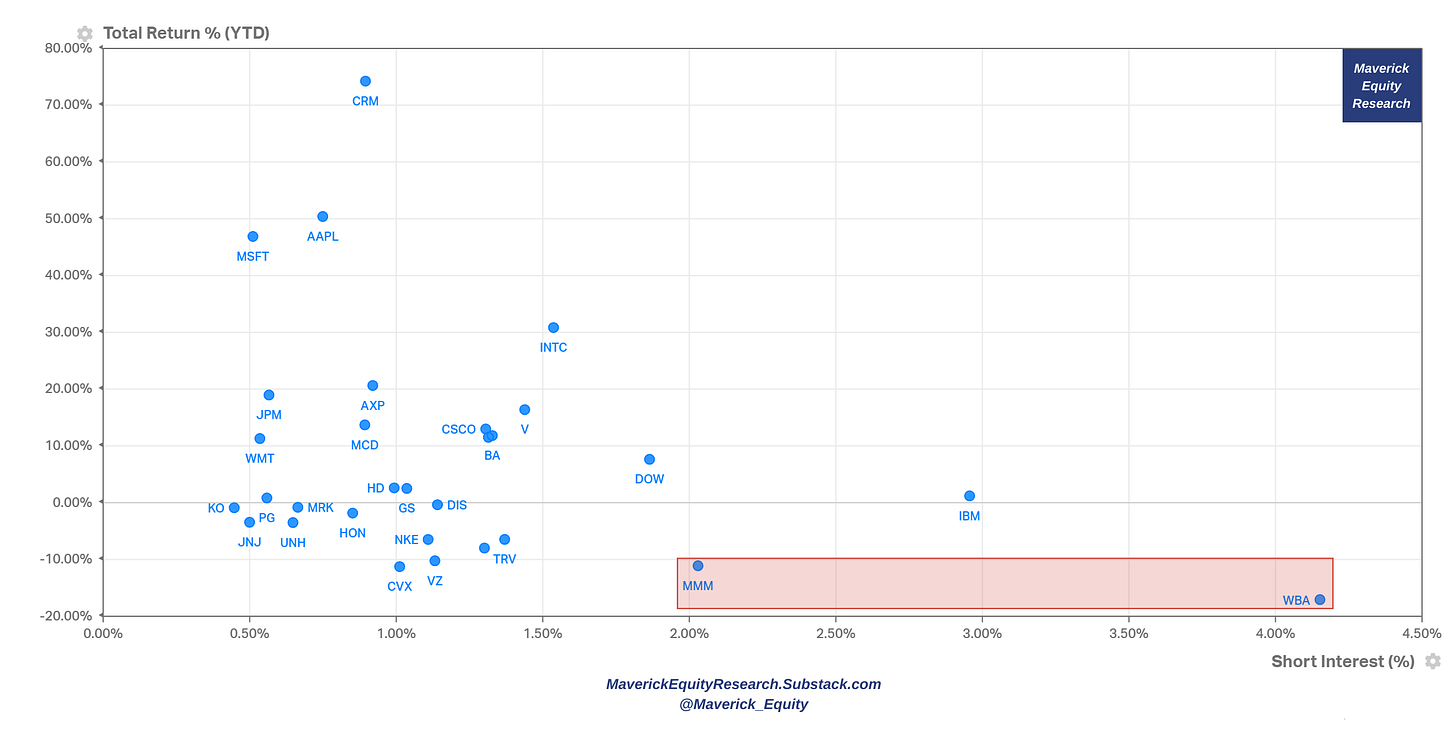
Dow Jones deep dive:
Going inside the Dow Jones with the 2023 returns & short interest levels:
Nasdaq-100 techie deep dive:
Time for the Nasdaq-100 with the 2023 returns & short interest levels:
S&P 500 deep dive:
And the mighty S&P 500 aka ‘the market’, 2023 returns & short interest levels:
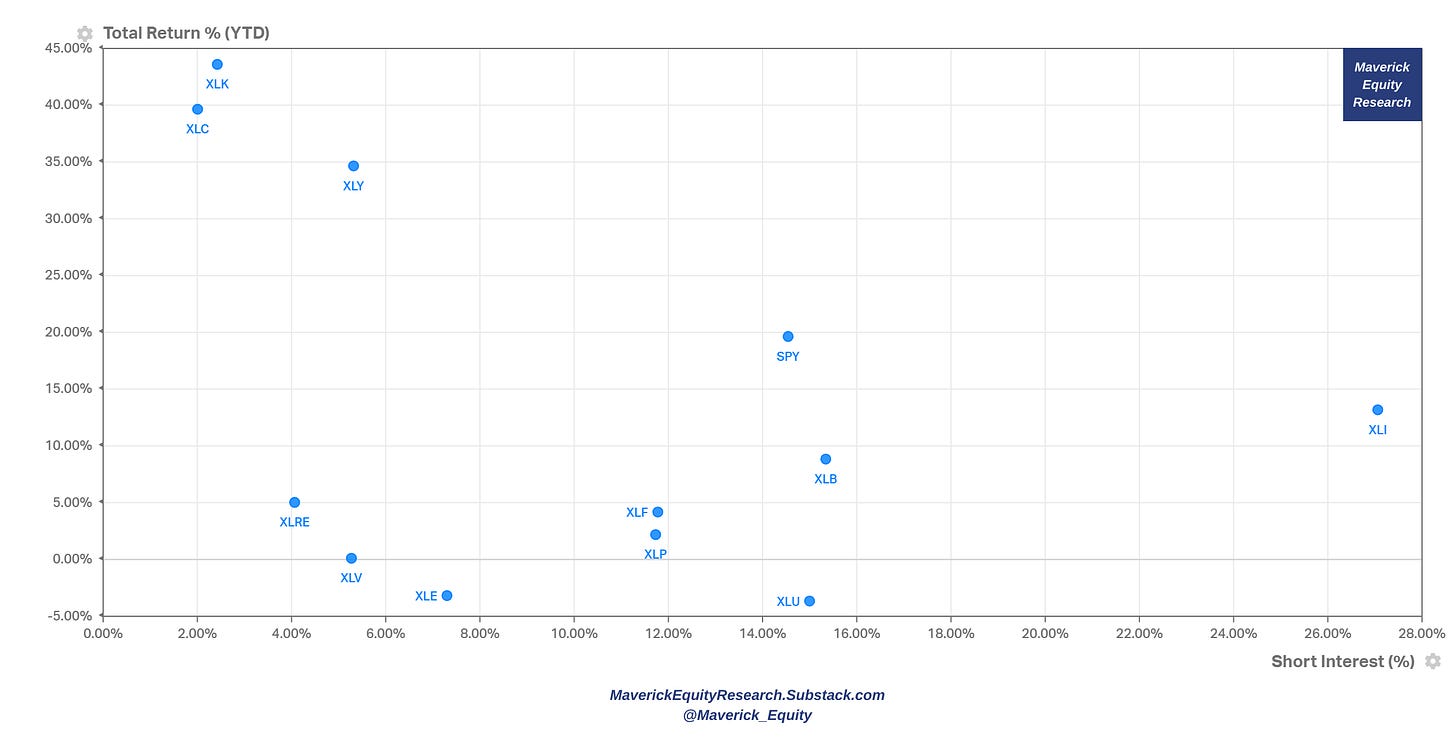
S&P 500 itself (SPY) and the 11 Sectors that shape it!
Legend for the newer investors & recall for the experienced: XLC = Communication Services, XLY = Consumer Discretionary, XLK = Technology, XLB = Basic Materials, XLI = Industrials, XLF = Financials, XLRE = Real Estate, XLE = Energy, XLP = Consumer Staples, XLV = Health Care, XLU = Utilities
Firstly, the 2023 performance of the 11 sectors: XLK (Tech) XLC (Communications) & XLY (Consumer Discretionary) the big 3 leaders:
Time for the short interest for the 11 sectors:
XLK & XLC not surprisingly the least shorted sectors, while oddly enough XLI (Industrials) with a big short interest in 2023 though lately also cooling off
similarly, XLF (Financials) with a big jump on the idea of the ‘most anticipated recession ever’ that many did expect together with one of the sharpest upward interest rate cycles and an inverted yield curve … summer cooling off also lately
Going with a 2D view to show 2023 returns & the short interest for each sector:
Complementary, the S&P 500 with the 11 sectors & the industries breakdown:
Going inside the 11 sectors of the S&P 500 for more granularity & because likely you noticed, plotting 500 stocks in 1 chart is interesting but not enough revealing:
XLK - Technology: not much short selling activity overall given the recent performance and note how nobody is shorting Nvidia (NVDA) these days ;))
XLC - Communications: similarly, where META is not touched a lot by short sellers
XLY - Consumer Discretionary: not too long ago Tesla (TSLA) was highly shorted (Musk said was the most shorted stock in history) but these days barely at all …
XLE - Energy: mixed bag here given the great run up while lately returns cooling off
XLRE - Real Estate: many commentators point out real estate being very vulnerable given the rising interest rates, though that’s not reflected much in the short interest
XLF - Financials: besides some exceptions, not much short interest action here
XLV - Health Care: performance wise a mixed bag and not much short interest … sector is defensive in general
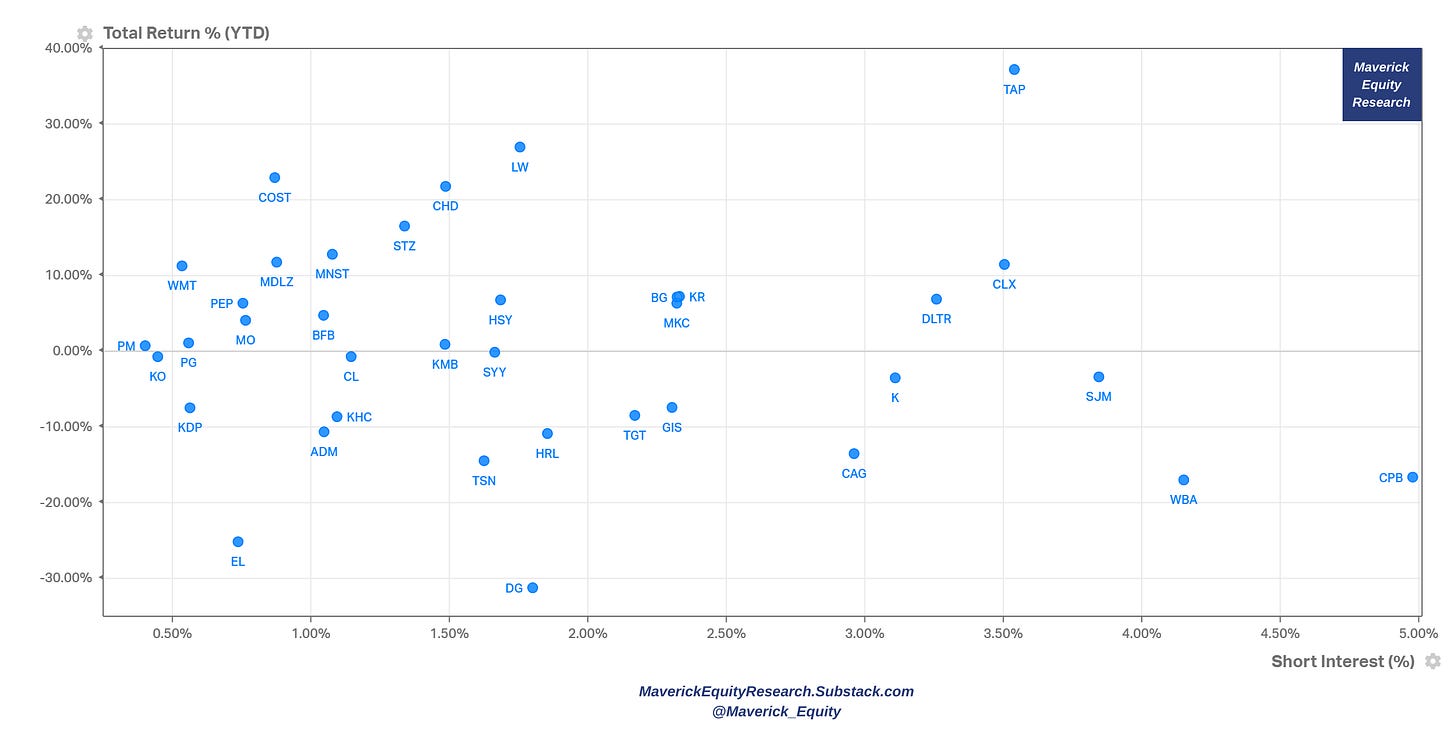
XLP - Consumer Staples: performance wise a mixed bag and not much short interest
XLU - Utilities: not much short interest in the single names, but as a sector one of highest shorted one … which is quite peculiar also because it is a defensive sector
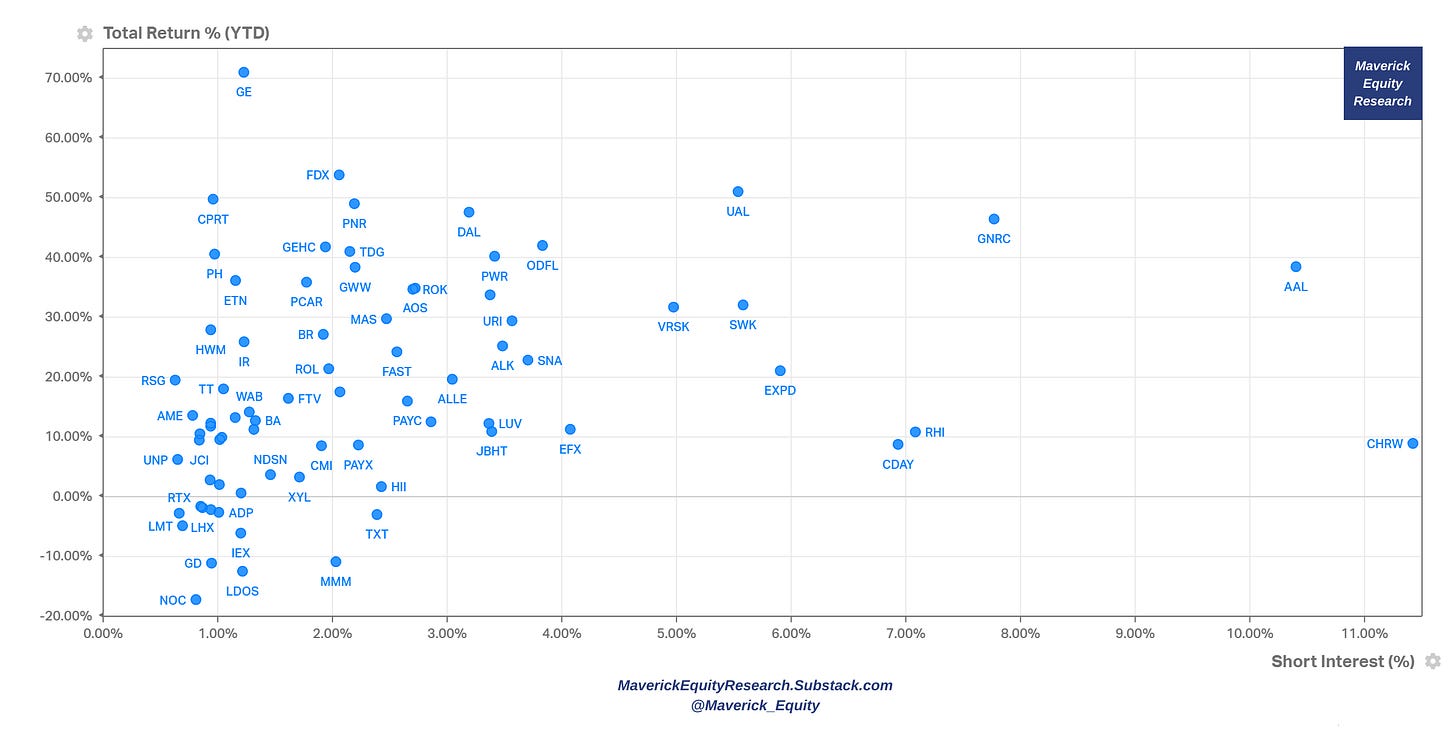
XLI - Industrials: not much short interest in the single names, but recall my note from above: lately XLI was and is the highest shorted sector out of the 11 …
XLB - Materials: not much short interest in the single names, but as a sector the 2nd highest shorted one …
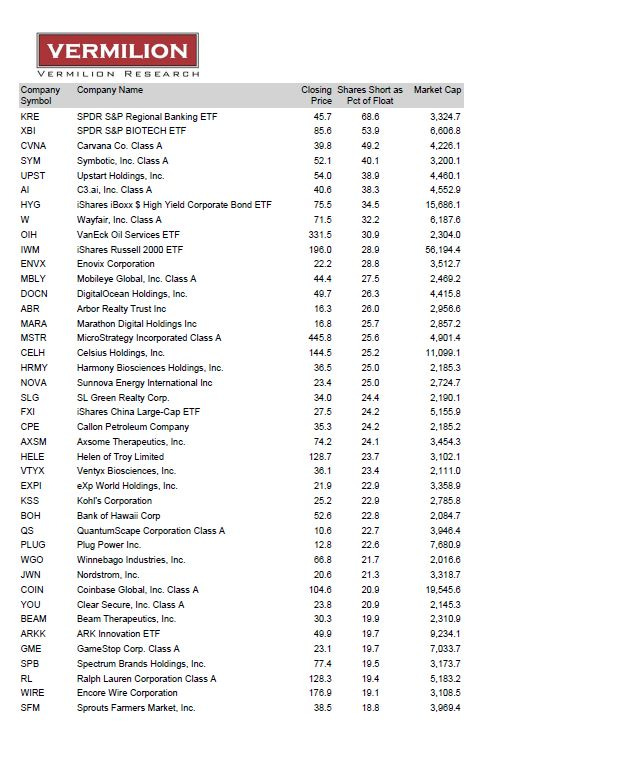
Going even bigger than the Dow, Nasdaq-100 and the S&P 500, let’s see the most shorted stocks from the NASDAQ and NYSE combined:
Do you wonder the situation in the bond market? JNK, the most liquid High Yield bond ETF hovers above the record $7 billion notional short interest … a pain trade:
Wonder what are they thinking there? They are not buying into the economic recovery and the recent stock market rally, but most of all I suspect they are looking at US junk loans getting downgraded at increasing pace: America's US$ 1.4tn risky corporate loan market has been hit by the biggest slew of downgrades since the depths of the Covid crisis in 2020, as rising borrowing costs strain businesses piled high with floating-rate debt … a space to watch for sure imho!
👍 Bonus Charts 👍
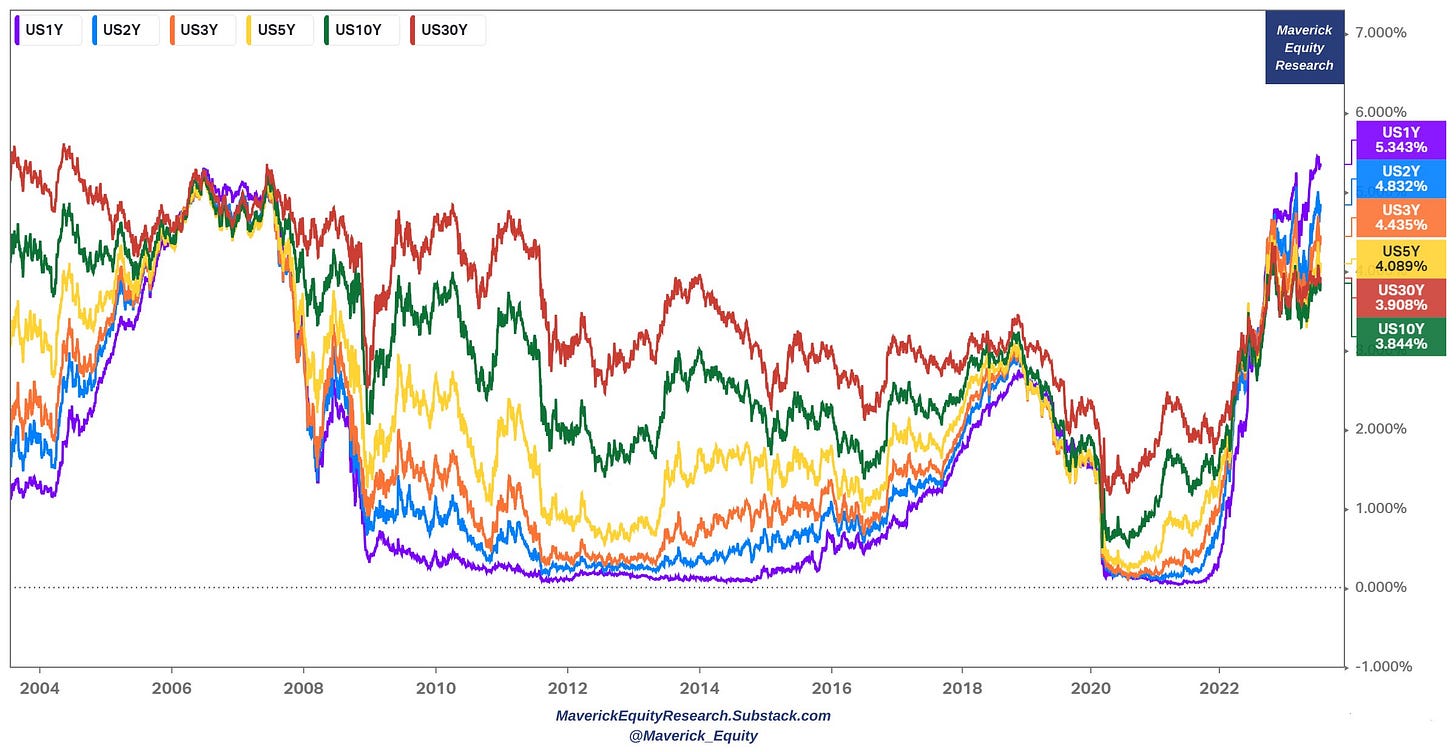
US interest rates: 'All riseeee! like judges say (FED)! U.S. government bond yields 1y 2y 3y 5y 10y 30y with a 20-year lookback period:
3 hiking cycles in 20 years: not the 1st one nor the last one ... I tell you that ...
currently above the 2015-2019 period and around the 2004-2009 cycle
are we experiencing Peak FED? Peak interest rates? Quite likely imho …
Now into our context: after the era of cheap interest rates, there must be companies out there that are now feeling the pain and will struggle with high financing costs and/or lack of funds to borrow to keep making ‘the vision’ a viable business model … i.e. short selling candidates …
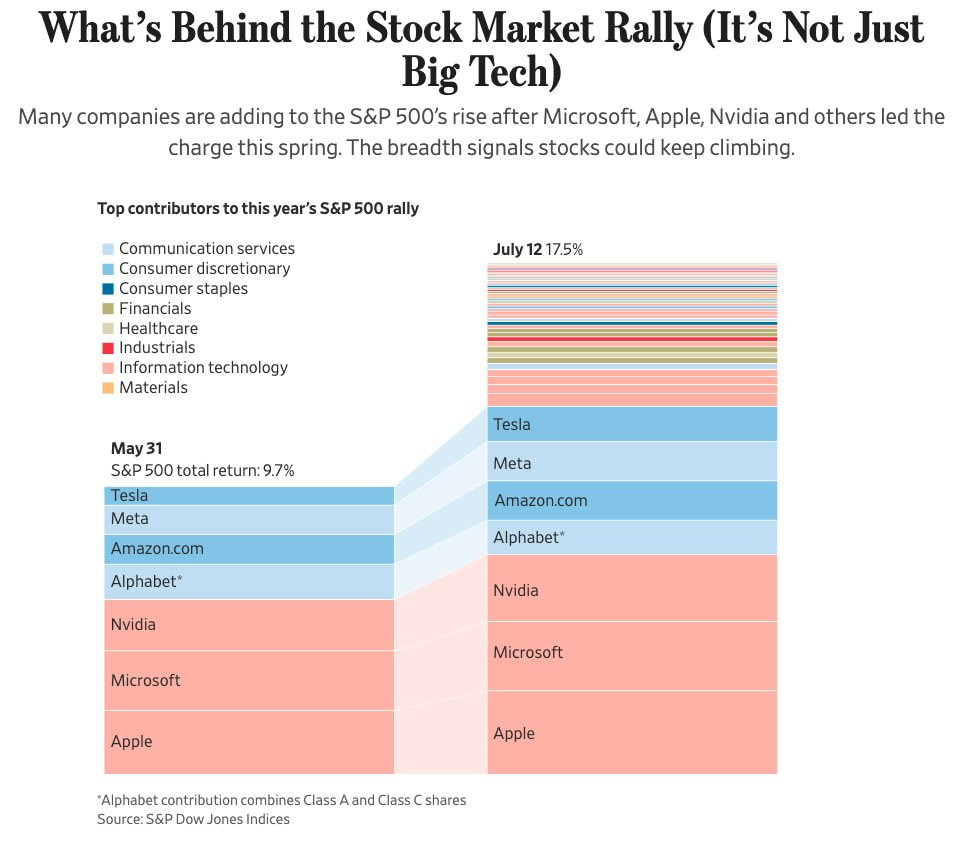
Market breadth has been a key critique of this new bull market & for a while that was fair & square as the ‘Magnificent 7’ big tech were driving most of the gains. Lately though the rally is broadening as other sectors are contributing more & more.
over 80% of the index is now trading above its 50-day MA (moving average)
all sectors of the S&P 500 have climbed since the end of May
US Recession Probability in the next year has fallen to 20% via GS (down from their earlier projection of 25%) which is way below the consensus:
that’s still slightly above the unconditional average post-war probability of 15% - a recession has occurred approximately every 7 years
but far below the 54% median among forecasters in the latest Wall Street Journal survey (which is down from 61% three months ago)
This research is NOT behind a paywall & there are NO pesky ads floating around.
Did you enjoy this extensive research by finding it interesting, saving you time & getting valuable insights? Now some of you asked how can one support me which is really kind of you 🤗. Therefore, it would be great & highly appreciated if you would support an independent investment researcher for the ‘Maverick-esque’ ongoing & future research. A donation or a tip to support my work can be done via the following:
Thank you & have a great day!
Mav















Great chart deck!
Great write up! This week should be exciting for trading.