✍️ Maverick Charts & Markets - August 2024 Edition #20
Buffett & Berkshire, S&P 500 & Gold, Groceries, Valuations, Snowflake, Capital light, Small Caps, Defense, Inflation, Retirement outcomes, Risk Management & Hedging, Geopolitics & US Elections
Dear all,
there you go with August’s 25 charts + bonus that I carefully cherry picked for you as these monthly wrap ups are done so that many can connect the dots across markets!
Delivery is in typical Maverick fashion, via charts that say 10,000 words covering Macro, Stocks, Bonds & More which also naturally connects the Geopolitics dots.
Research is NOT behind a paywall and NO pesky ads here unlike most other places!
What would be appreciated?
Just sharing this around with like-minded people, and hitting the 🔄 & ❤️ buttons! That’ll definitely support bringing in more & more independent investment research!
First of all, 2 quotes on 2 key topics from the one and only Warren Buffett:
👉 How to end the U.S. deficit in 1 go: "You just pass a law that says any time there's a deficit of more than 3% of GDP, all sitting members of Congress are ineligible for re-election."
👉 Investing and human emotions: “Beware the investment activity that produces applause, the great moves are usually greeted by yawns.”
Second of all, your daily 3 wins in general in order to be a complete winner:
And now it’s Maverick charts time … that shoot 10,000 words:
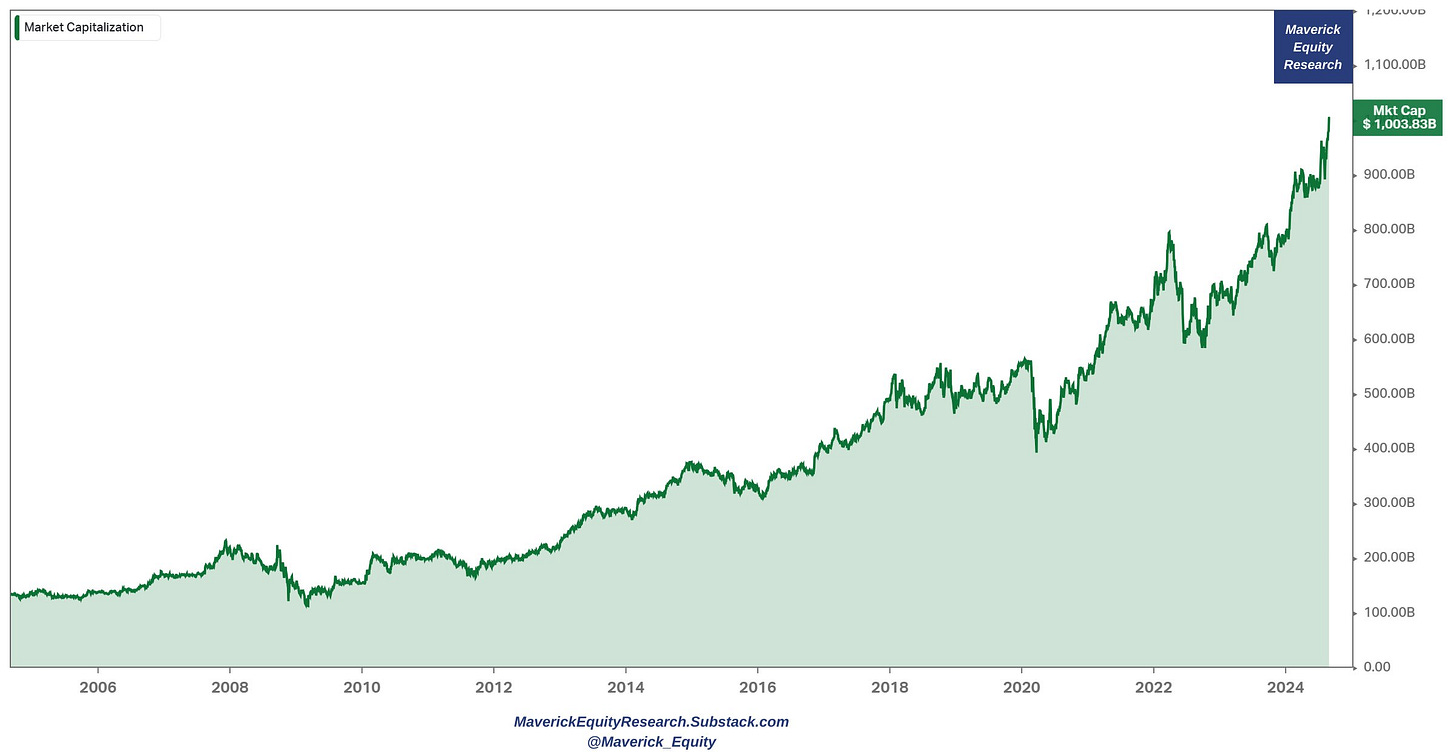
Chart Of The Summer = Buffet's Berkshire Hathaway (BRK), let these sink in:
👉 reached 1 TRILLION market capitalisation for the 1st time ever …💰
👉 how long did it take? 44 years, 5 months, 13 days … (while Zuckerberg was the fastest with Meta/Facebook: 9 years, 1 month, 10 days). In general, I prefer the solid slower & steadier way than the yes/no focus on any single thingie.
👉 also the 1st company ever to reach 1 trillion outside of the technology sector ... 🫰
As a Berkshire shareholder very happy ... they have done exceptionally well!
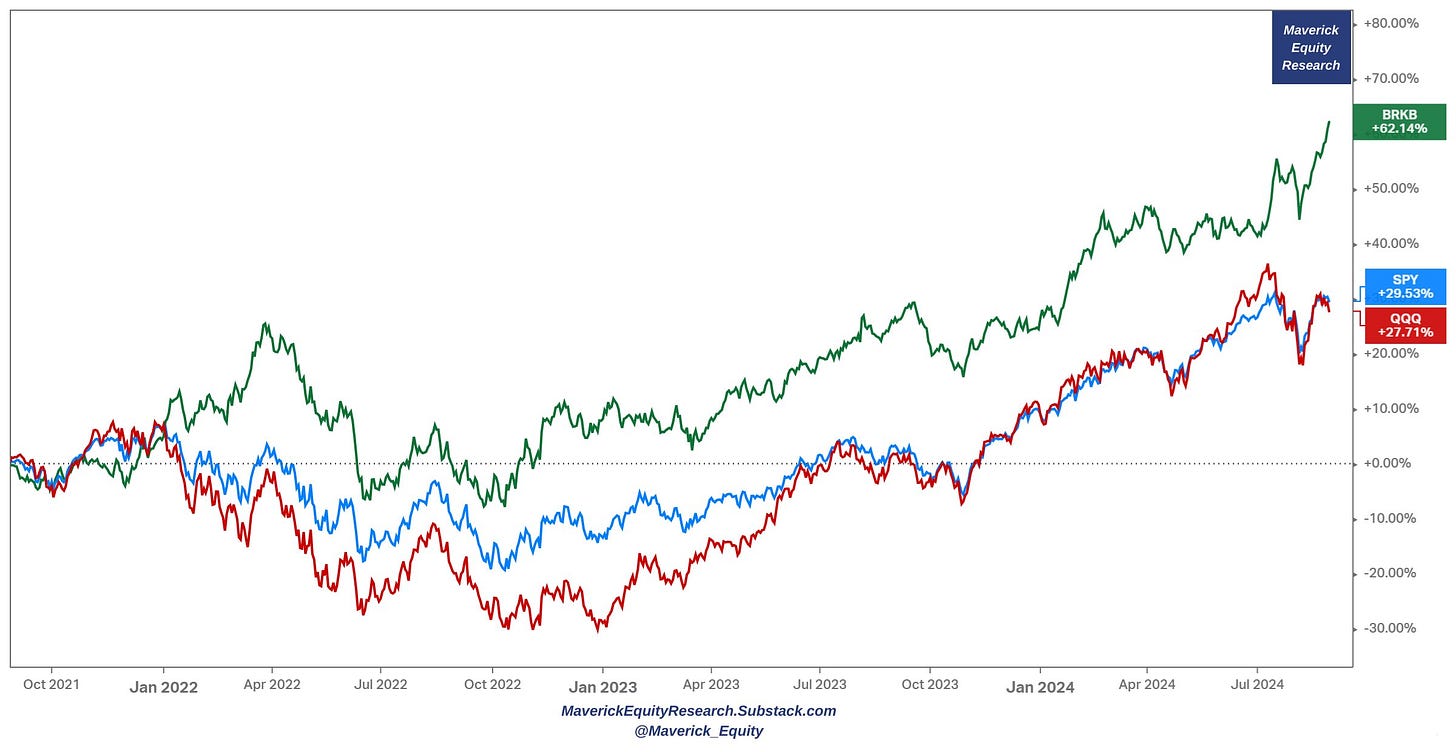
Berkshire (green) outperforming big both S&P 500 (blue) & Nasdaq 100 (red) in 2024 with +30%, and the last 3 years 62% (2nd chart)
Looking a bit at the other side of the coin, 2 points:
👉 the great returns lately are a bit too good as in too short of a time, which is something I am rarely a big fan of …
👉 Buffett has been buying his own stock quite some since 2020 Covid times ... yet notice lately not much ...
These 2 notes are not a biggie, in fact they are luxury problems but worth to be known.
Less buybacks as likely seen not adding (much) value to shareholders right now, what is the alternative? Let’s look at Berkshire's Hathaway or actually better said 'Berkshire’s STASHaway' cash position:
👉 cash pile = $277 billion from $189 is the biggie, doing the ‘T-bill & Chill’ strategy ...
👉 Buffett like a cat, no matter what landing on top and smiling = taking profits and building a huge cash large pile ... cash compounds now at +5% given the high interest rates ... heads he wins, tail he wins ... keep compounding!
👉+ gets optionality via that cash: buy undervalued stuff that they find or buy the same should we have a correction/recession
👉 note how Cash went down during the 2007-2009 GFC (Global Financial Crisis) as Buffett was buying quality businesses for dirt cheap prices
👉 if by chance we get a recession (well, reminder: sooner or later it will happen, it is just the basic 101 business cycle), what do you think Buffett will do? Same thing again!
Overall, I call this the compounding/getting paid to wait ‘T-bill & Chill’ ‘T-bill & Wait’ strategy hunting for opportunities that always come along sooner or later ...
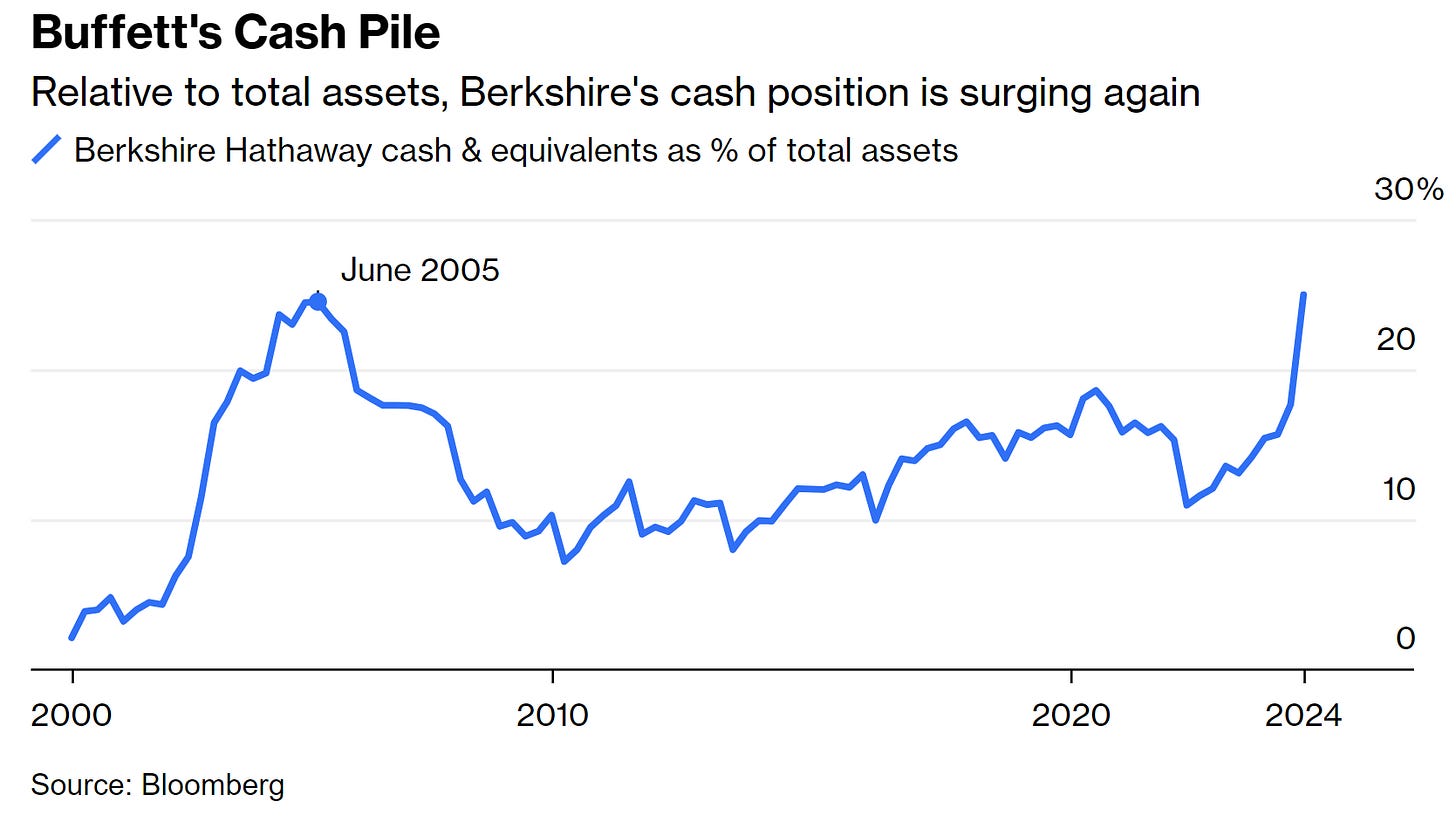
Last but not least, Buffett's cash pile as a % proportion of total assets:
👉 $277 billion are now officially back to their highs before the 2008 financial crisis when a cash-rich Buffett famously scooped up iconic investments at bargain prices
👉 2 key notes from the Berkshire Hathaway annual meeting from May, with Buffett: “I don’t mind at all, under current conditions, building the cash position” ... “When I look at the alternative of what’s available in the equity markets and I look at the composition of what’s going on in the world, we find it quite attractive.”
S&P 500 valuation:
👉 the gap between the 21.8x forward P/E (green) and the trailing 28.5x P/E (red) gets bigger & bigger ... thoughts? Covid 2020 an outlier, ignore it ... what about now?
Deep dive analysis on that in the next S&P 500 report with a focus on Valuation. Until then, you can check the previous 5th edition:
✍️ S&P 500 Report: Valuation, Earnings & Fundamentals + Special Metrics #Ed 5
The famous S&P 500 in gold terms chart since 1971 which did circulate a lot in August and created a big buzz as it says the S&P 500 is now where it was in 1971
👉 why since 1971? When President Richard Nixon severed the dollar's link to gold ...
👉 just check my 2nd chart: Gold (price return, red), S&P 500 index (price return, blue) SPY ETF (total return, green) … and that is just last 30 years ... 50 years, gold would not be even seen as rising relative to the S&P 500 ... compounding is magic ...
👉 also, the big reminder: never compare price return with total returns
👉 from my side, a 1-5% allocation to Gold is fine, but overall I am not impressed: gold has utility in electronics/tech/chips, Olympic medals, jewelries etc as an input, but overall it just produces nothing, has no cash flow behind, has no IRR …
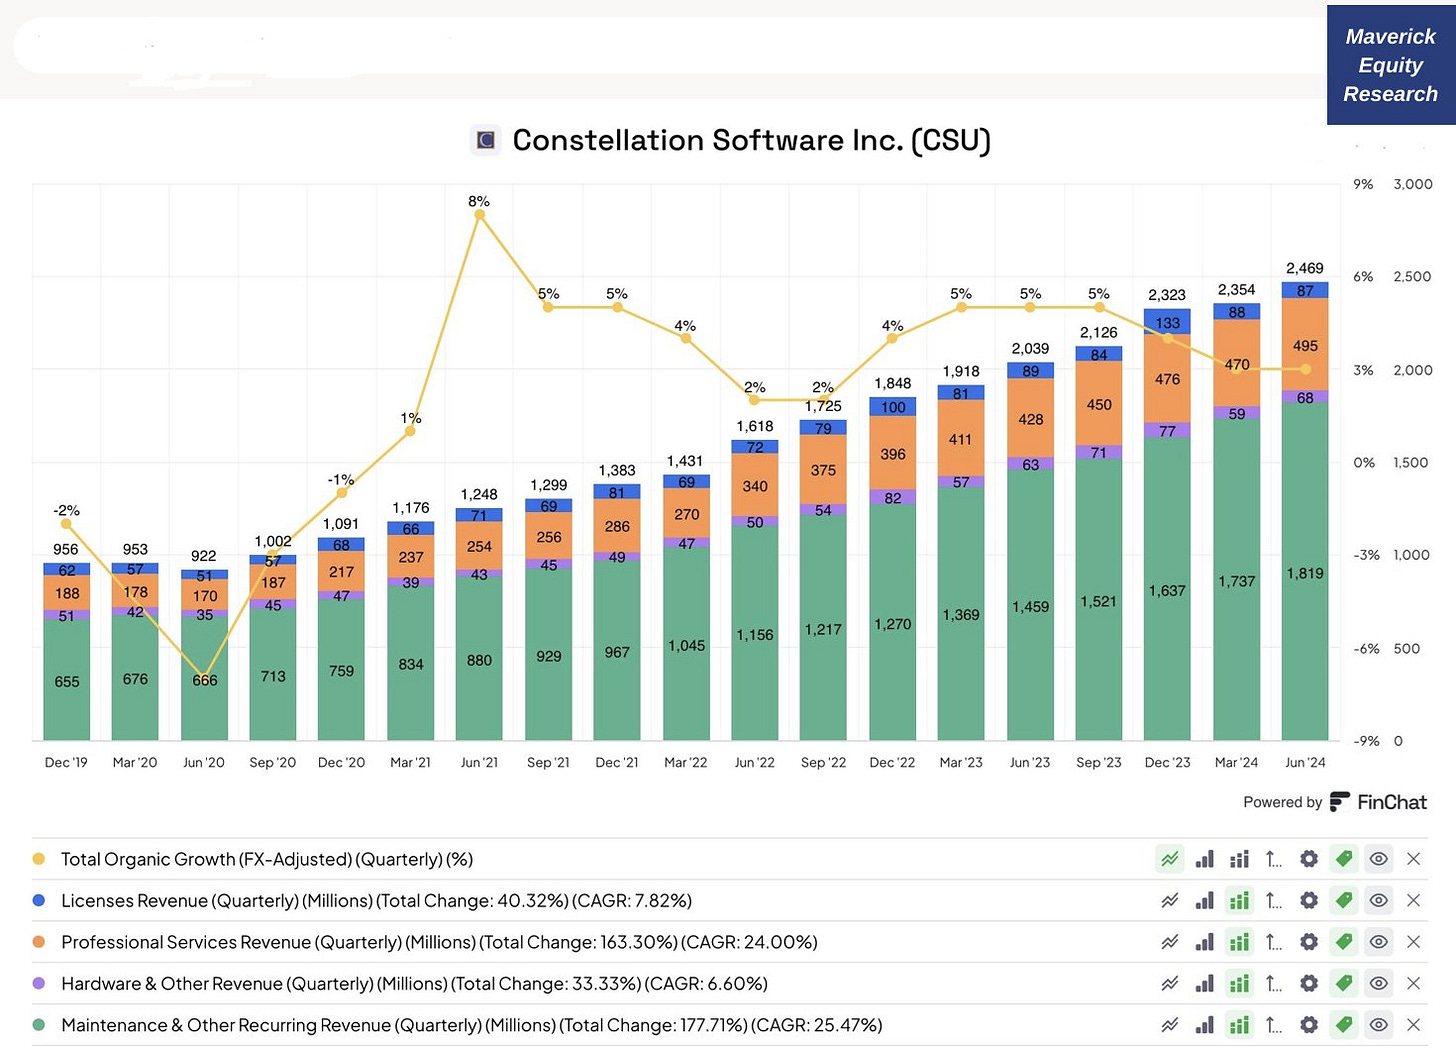
Constellation Software (CSU) in one single chart: revenue breakdown + growth … Maverick likes that thick recurring revenue green share … keep em’ coming …
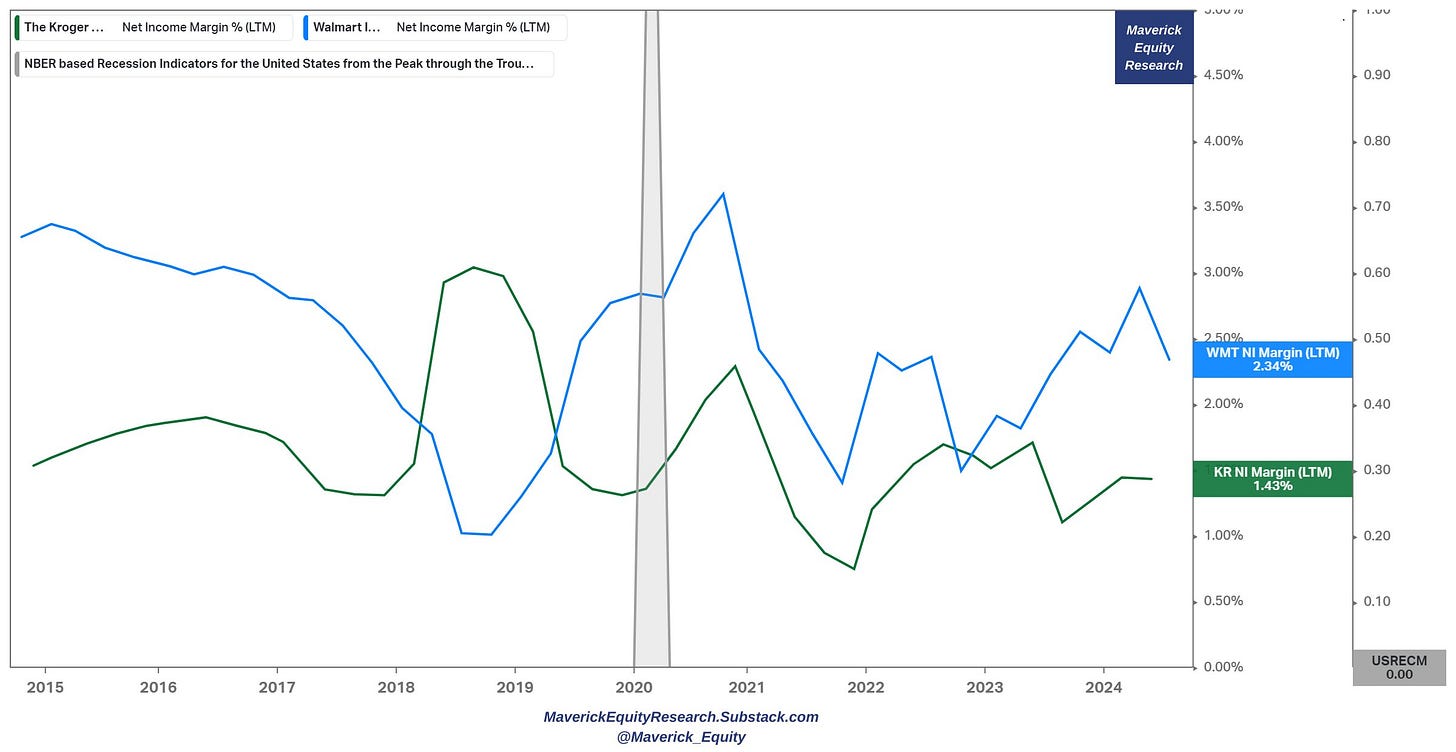
Walmart and Kroger Net Profit Margins are DOWN since Covid, or stable if the point of reference is 2022, hence no gouging of consumers
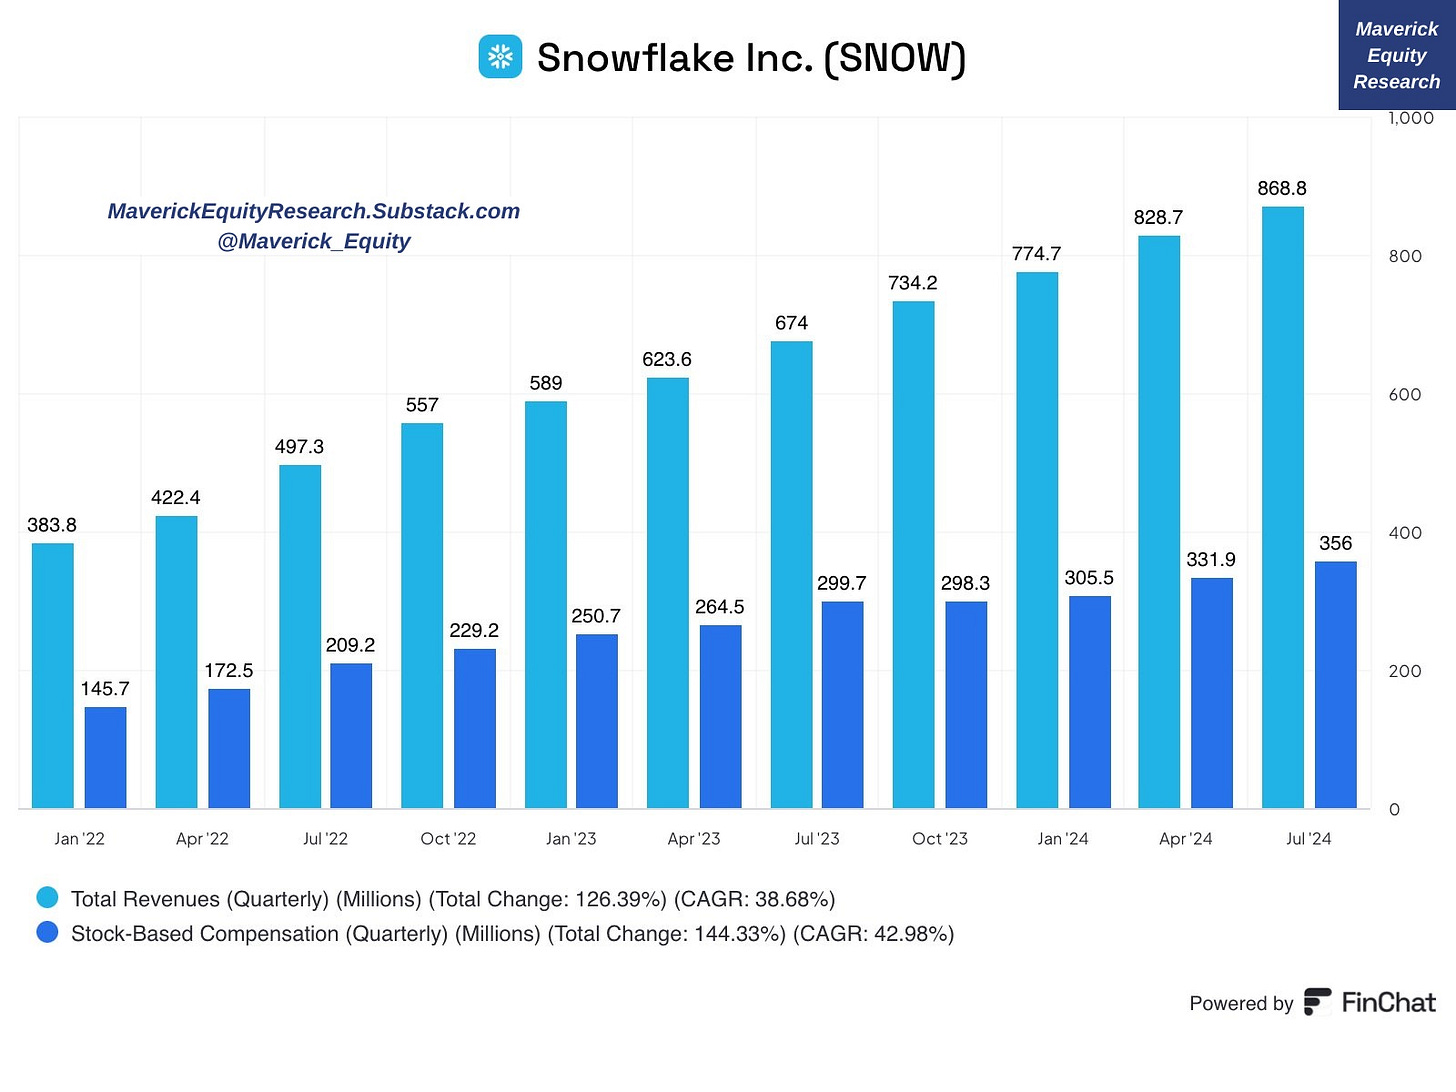
Snowflake (SNOW) kind of 'snowflakey' via their Stock-Based Compensation (SBC)? SBC = 41% of revenue in the last quarter ... Can't AI make SBC go down? ;)
Complementary view: Free Cash Flow vs. Net Income, going opposite directions
You might wonder, why does Net Income go more and more negative despite a growing free cash flow? Well, that Free Cash Flow (FCF) is not that ‘free’ as it does not include Stock-Based Compensation (SBC): SBC always higher than FCF
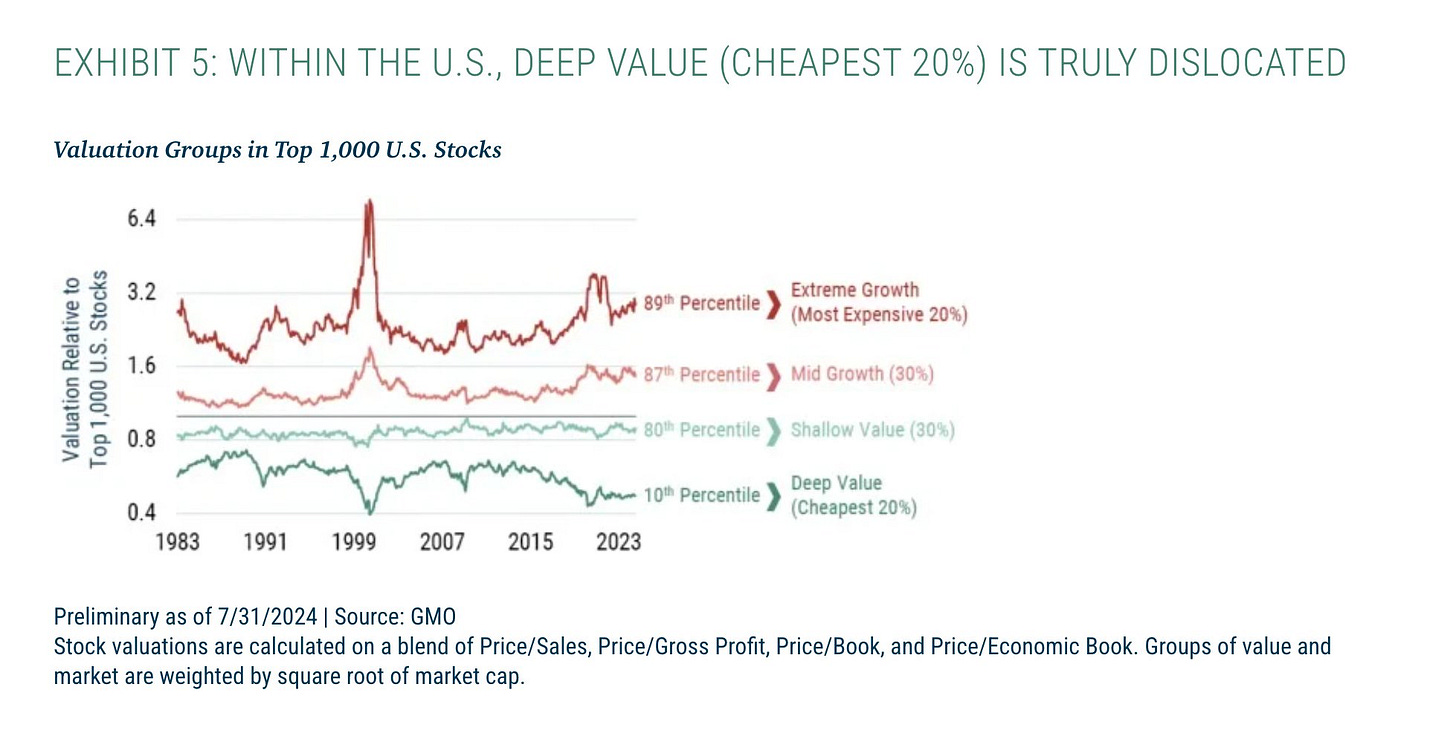
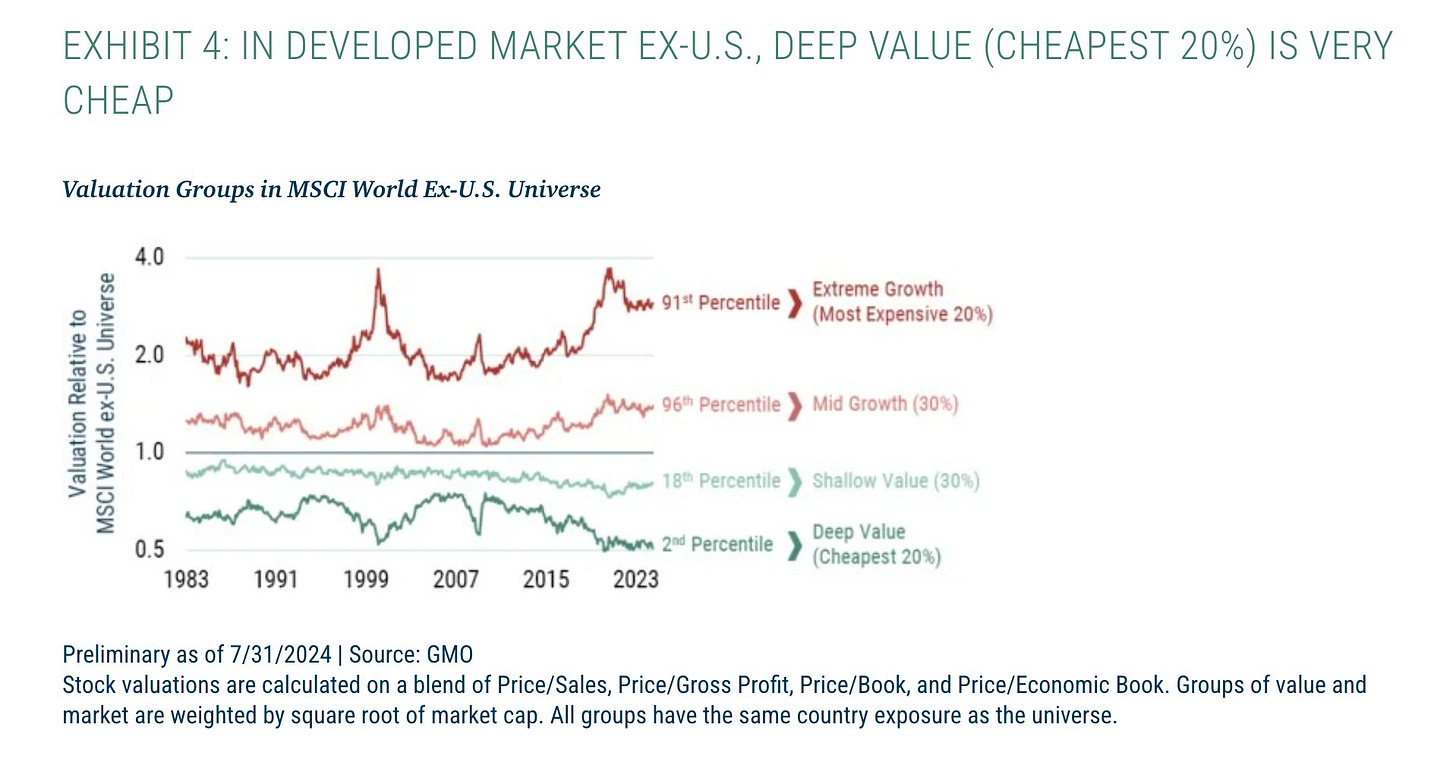
Equities Valuations: US and Developed Markets (excluding US) via GMO
👉 US: vast majority of stocks, namely 80% of them are pricey pricey: trading currently in the most expensive 20% of their valuation history, while conversely, 20% of them (deep value) are trading currently in the cheapest 10% of history
👉 Developed Markets (Ex-US): 50% pricey pricey, while the other half looks decent, especially the bottom 20% (deep value) which trades in the cheapest 2% of history
Where will I focus my research hunt for the Full Equity Research section? You got it: the cheaper deep value land! Not just US, but also Switzerland, Canada and the EU.
Asset LIGHT businesses generally outperform capital INTENSIVE businesses
👉 Maverick’s favorite businesses: the mix of high insider ownership (preferably also founder led), capital/asset light and great culture
👉 my Full Equity Research section will cover in the future these kind of companies
Either High-yield bonds overpriced, or small caps undervalued, close the gap:
👉 I would say rather small caps are undervalued and small caps is my hunting ground
👉 my Full Equity Research section will cover in the future these kind of companies
"The best offense is owning Defense." via Bofa since 1989: Aerospace & Defense 12%/year, S&P 500 10%/year while Industrials 8%/year
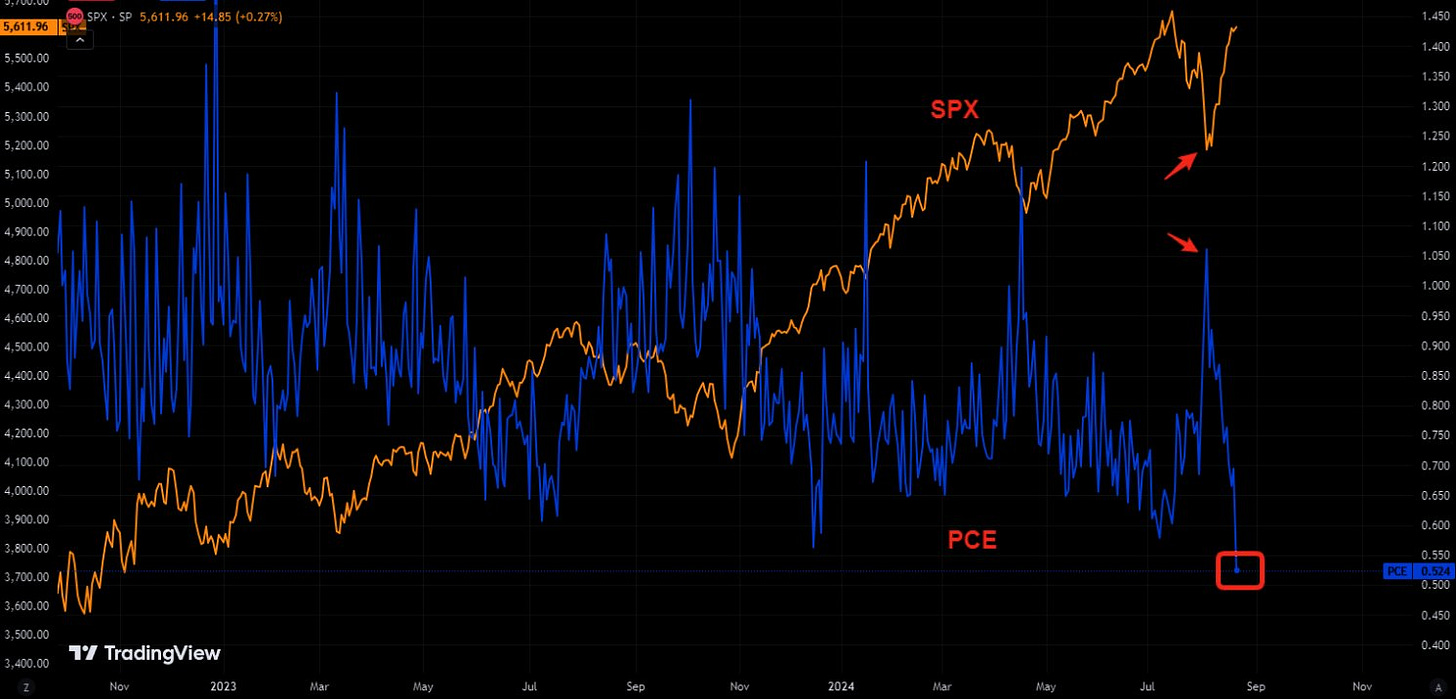
Retail investors never panicked during the "August Angst"
👉 VandaTrack’s Iachini noted the biggest flows were into popular tech names while Nvidia and Tesla topped trading at Interactive Brokers, followed by a risky exchange traded fund designed to boost short-term chip stock gains via leverage
Bear markets recovery = the quicker they are, the faster they recover
On Risk Management & Hedging, a dear topic of mine, we have now big ‘Puts’ hate = you buy protection when you can (cheap), not when you must (expensive, not worth it) …
August Google searches of “recession” ... up & down ... even erections last longer than the 'Yes/No’ recession change of minds ;)). In case you missed my latest take on the US economy, there you go (4th edition coming in September/October)
✍️ The State of the US Economy in 75 Charts, Edition #3
110 years of Inflation rate (CPI YoY), a very long series via one Maverick chart!
👉 2.9% below the 3.3% long-term average … back to normal around here these days!
N.B. A special Macro report dedicated exclusively on Inflation will be done, stay tuned!
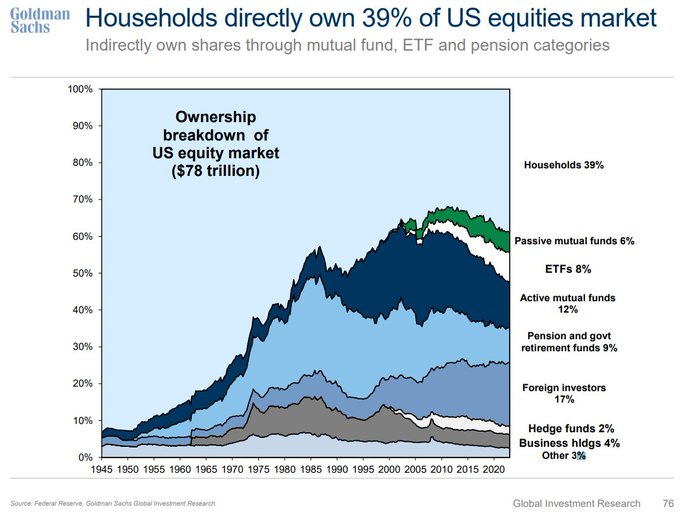
Households directly own 39% of US equities market … a growing share!
In terms of Households allocations to stocks:
👉 at near record highs: from this chart and historical episodes it might signal it’s a top, but I would say not really: participation in the stock market is way higher these days + when the market itself makes all-time highs, it’s normal that the allocations are also getting closer to record highs
👉 percentage has more than doubled in ~15 years which is normal considering the great bull run we have had after the GFC
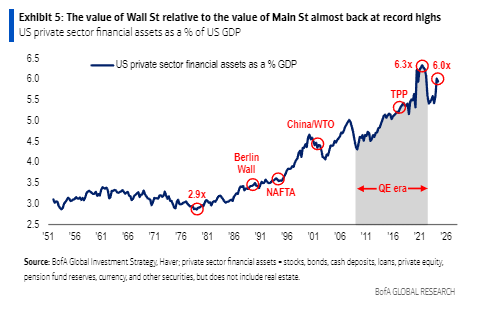
Wall Street vs Main Street so to speak
👉 Wall Street defined as private sector financial assets = 6x the size of Main Street defined as in US GDP ...
👉 6x = close to all-time highs of 6.3x from the 2021 stock bubble / bonanza
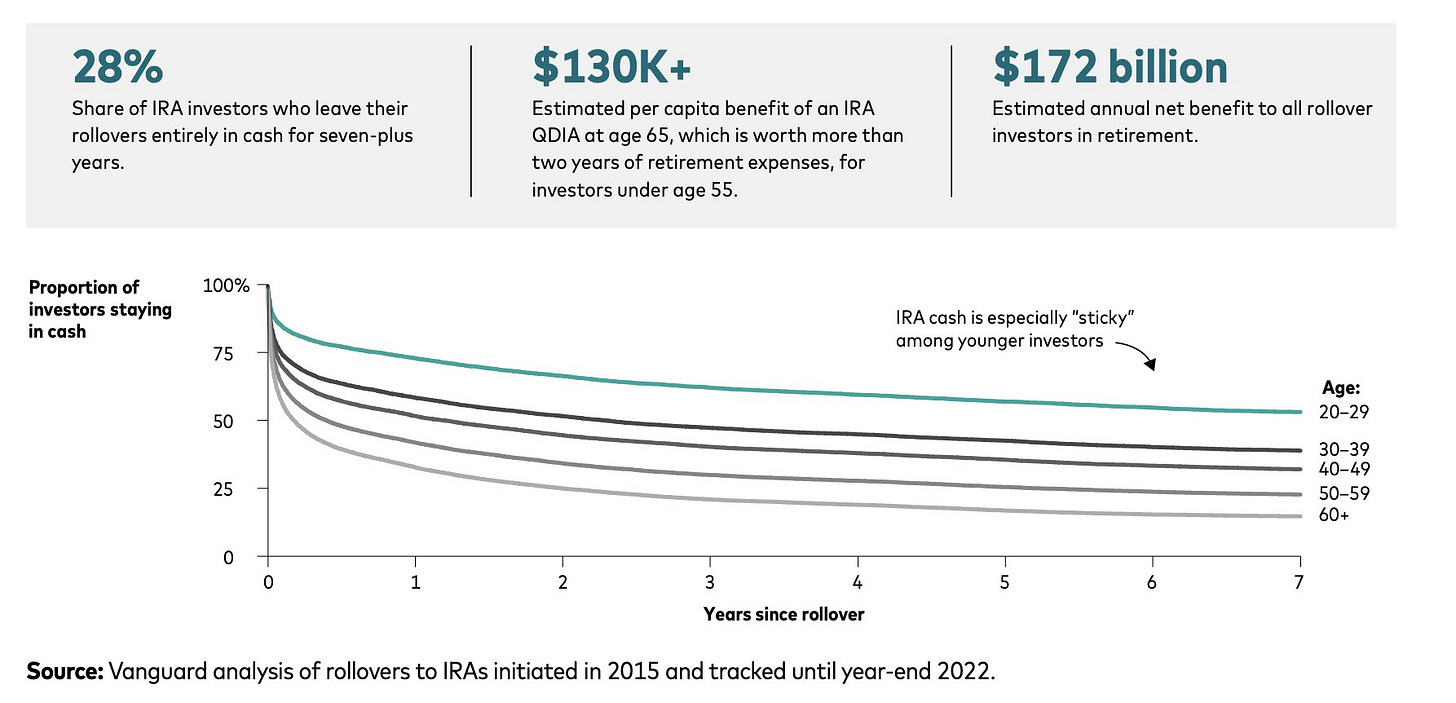
‘Improving retirement outcomes by default: The case for an IRA QDIA’, Vanguard:
👉 IRA cash is highly “sticky.”, especially among younger investors, women, and those with smaller balances whom are especially prone to staying in cash for years following a rollover, and direct-contribution cash is even “stickier” than rollover cash
👉 28% of IRA investors leave their rollovers entirely in cash for 7+ years
👉 for investors under age 55, Vanguard estimates that the long-term benefit of investing in a target date fund (versus staying in cash) upon rollover is equivalent to, on average, an increase of at least $130,000 in retirement wealth at age 65. Enabling an IRA qualified default investment alternative (QDIA) could deliver approximately $172 billion in long-term benefits to all rollover investors in retirement each year
👉 cash allocation in IRAs has been consistently higher than in 401(k)s since 2007.
👉 and the gap has widened in recent years: since 2018, IRA cash allocations nearly doubled (from 5.4% to 9.9%) while 401(k) cash allocations remained in the 2%–4% range.
👍 Bonus charts: Geopolitics & Markets When U.S. Elections edition 👍
Summer strength in election years? Perfectly normal!
👉 "Remember, it is perfectly normal to see a lot of summer strength in an election year. June, July, August are the three strongest months in election years, playing out once again." via Ryan Detrick
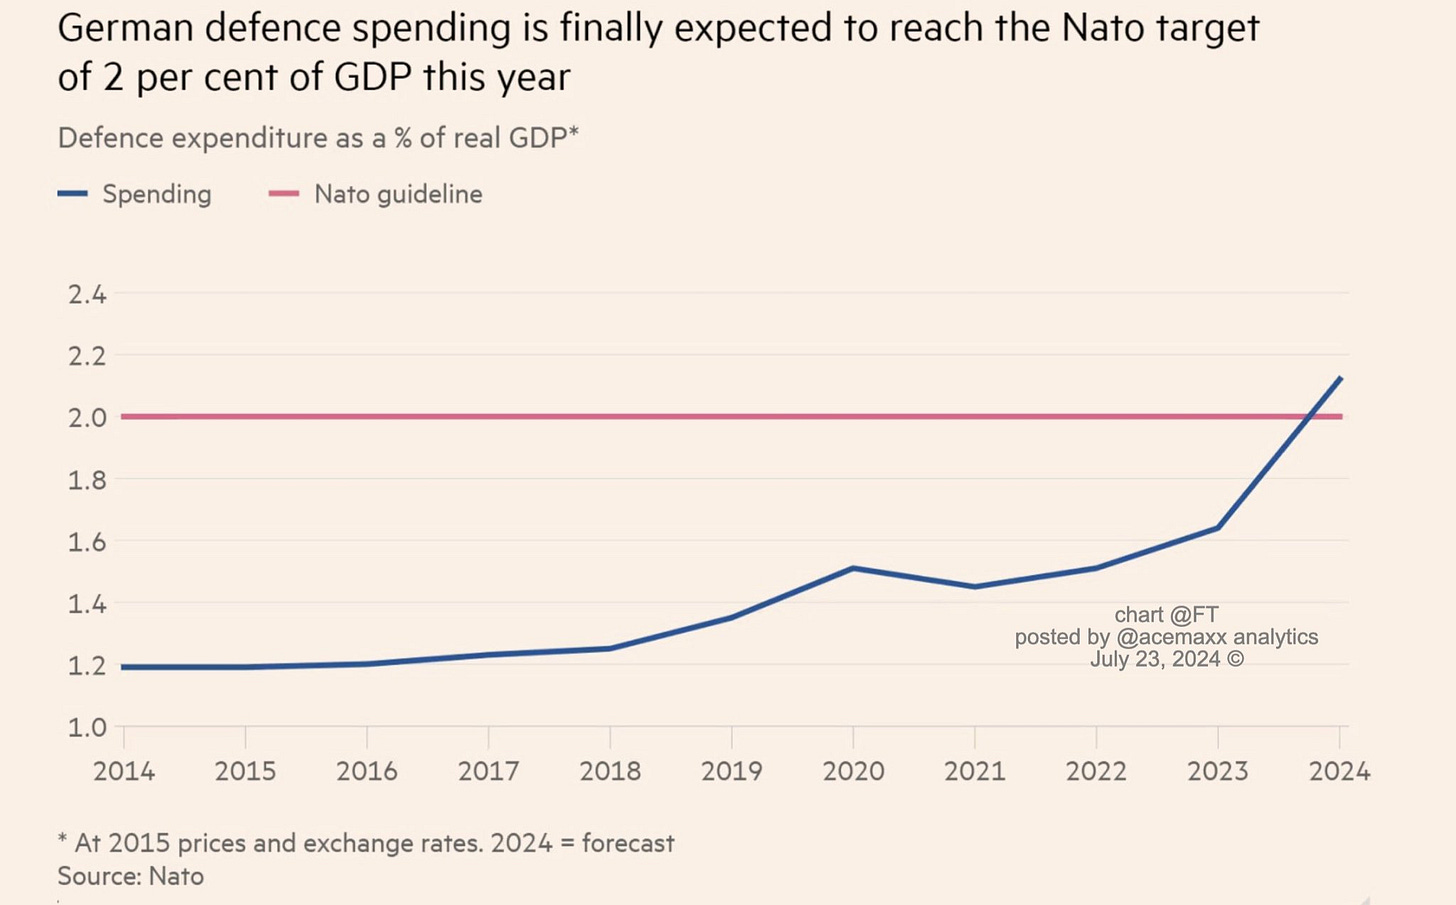
Germany’s defence spending to finally reach in 2024 the 2% of GDP NATO target
👉 note, I think police spending and military pensions are included here, hence not a lot would be then ‘new’ defence spending (correct me if wrong)
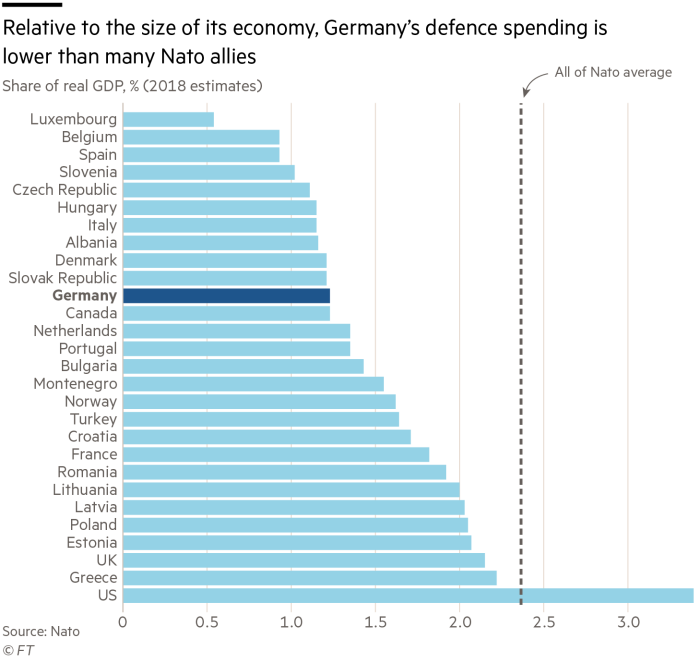
Among the NATO allies and relative to the size of the economy, Germany is on the low end of the spectrum when it comes to defence spending
Germany vs Germany:
👉 distribution of companies: East vs West quite a difference even nowadays ...
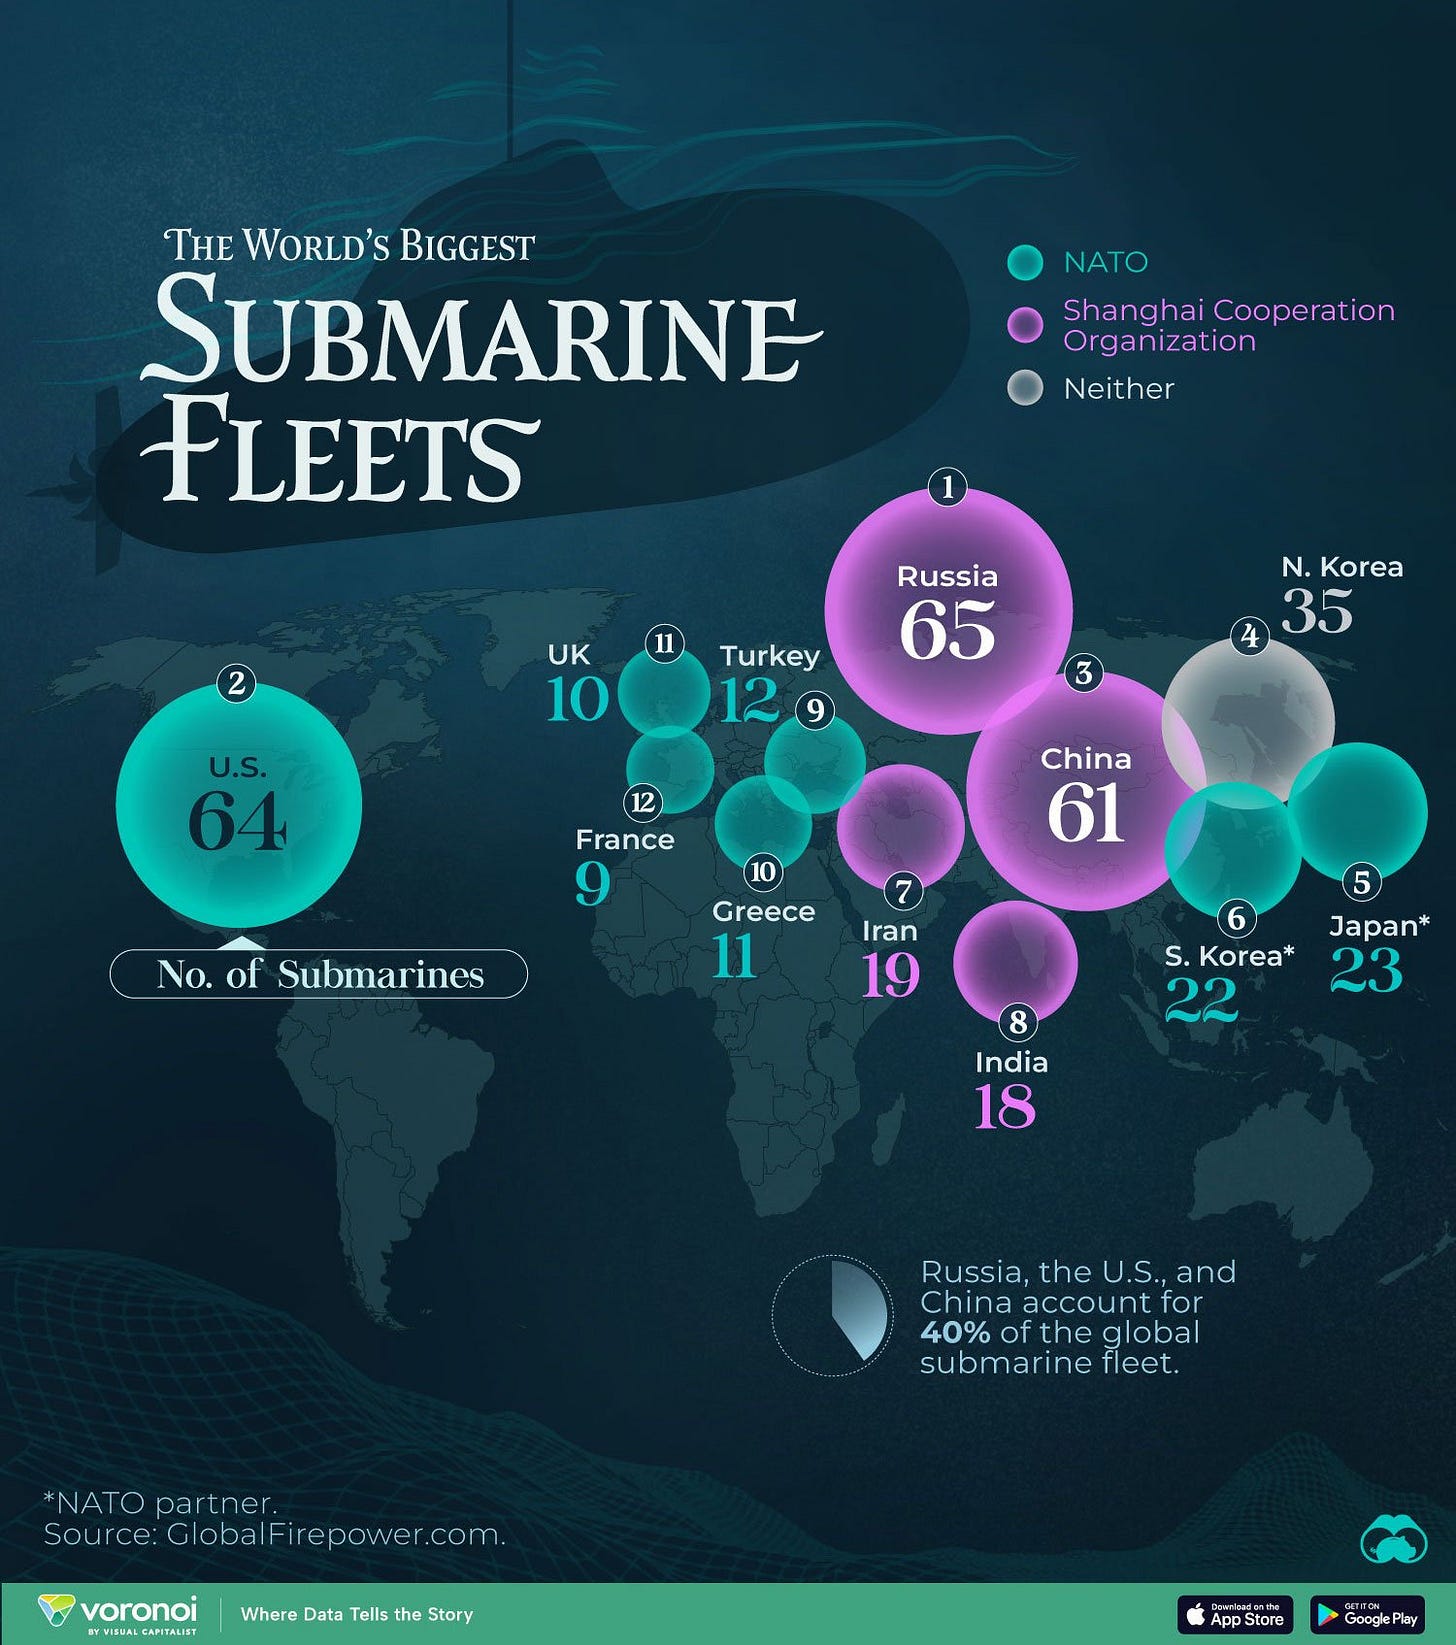
World’s Biggest Submarine Fleets: US, Russia & China top 3, a 40% global share
Research is NOT behind a paywall and NO pesky ads here unlike most other places!
Did you enjoy this extensive research by finding it interesting, saving you time & getting valuable insights? What would be appreciated?
Just sharing this around with like-minded people, and hitting the 🔄 & ❤️ buttons! That’ll definitely support bringing in more & more independent investment research!
Have a great summer!
Mav 👋 🤝


















Danke Mav, sehr gut!
Berkshire Buffett charts and insights were top top!
Thanks a lot Mav, great as always!