✍️ Maverick Charts - Macro & More - August 2023 Edition #10
25 Sleek charts that say 10,000 words ... save precious time & provide insight!
Dear all,
your monthly Top 20 Macro & More charts from around the world + 5 Bonus!
GDP is expected to be +positive in all G7 countries in the third quarter of 2023
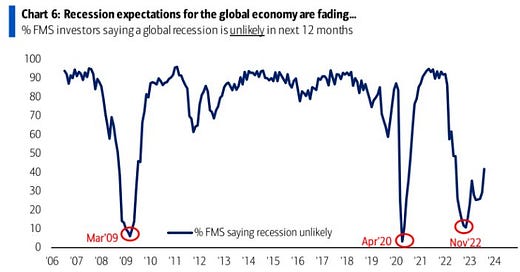
Fund Manager Survey: expectations for the global economy are fading
👉 after in 2022 we had ‘the most anticipated recession ever’ that never came …
👉 more on that in case you missed it ✍️ The State of the US Economy in 35 Charts ✍️
US Households Leverage:
👉 Liabilities to Net Wealth is down to 13%
👉 = lowest since the 1980 and materially below the trendline … not bad at all to see …
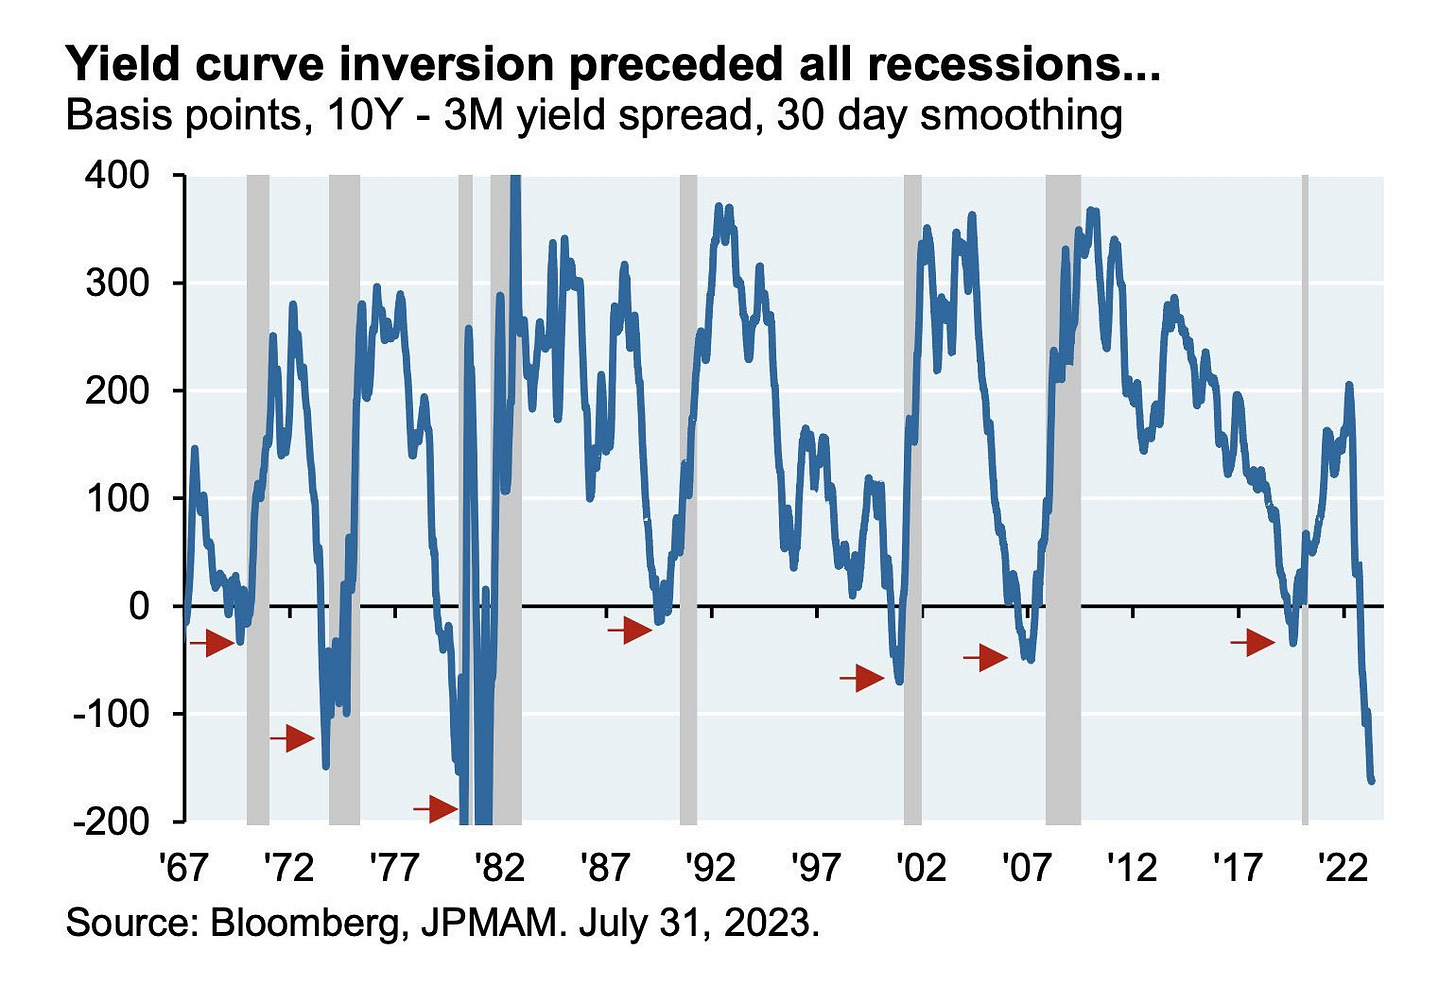
4 & 5 & 6. Magic magic Yield Curve, what are you telling us these days?
👉 a recession is coming this time also, or
👉 you inverted this time like Maverick in Top Gun and showing us the birdie?
Why am I asking? That is because Yield curve inversions preceded all recessions since the 1960s
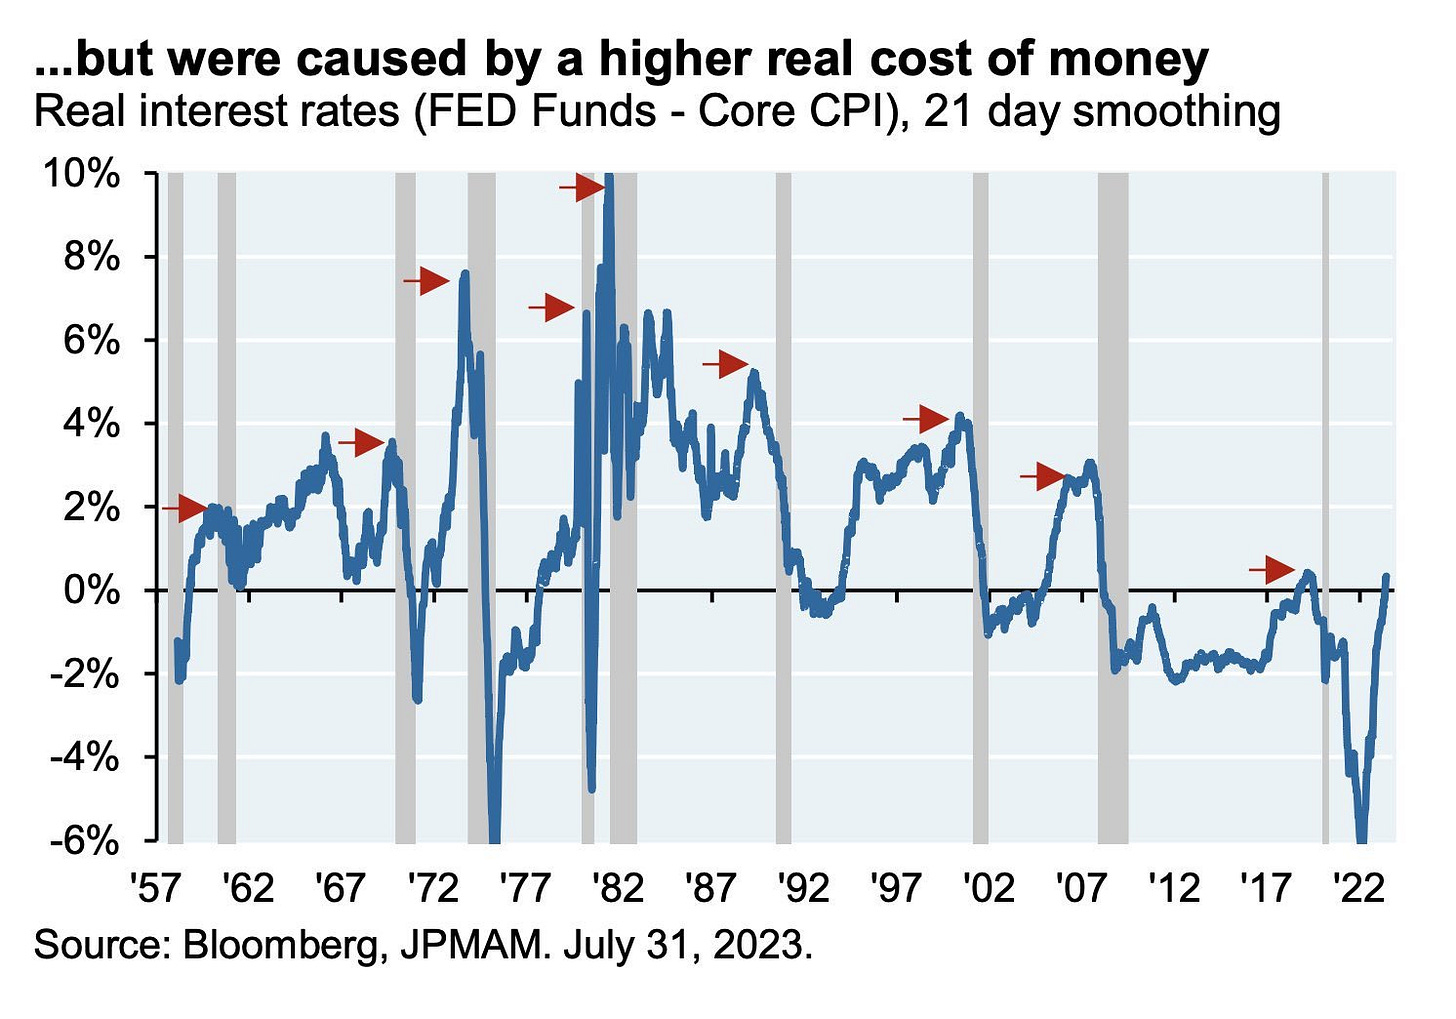
👉 THOUGH a very important note here which you do not see much around
they were caused by a higher real cost of money (FED funds - Core CPI)
which ain't high these days, right?
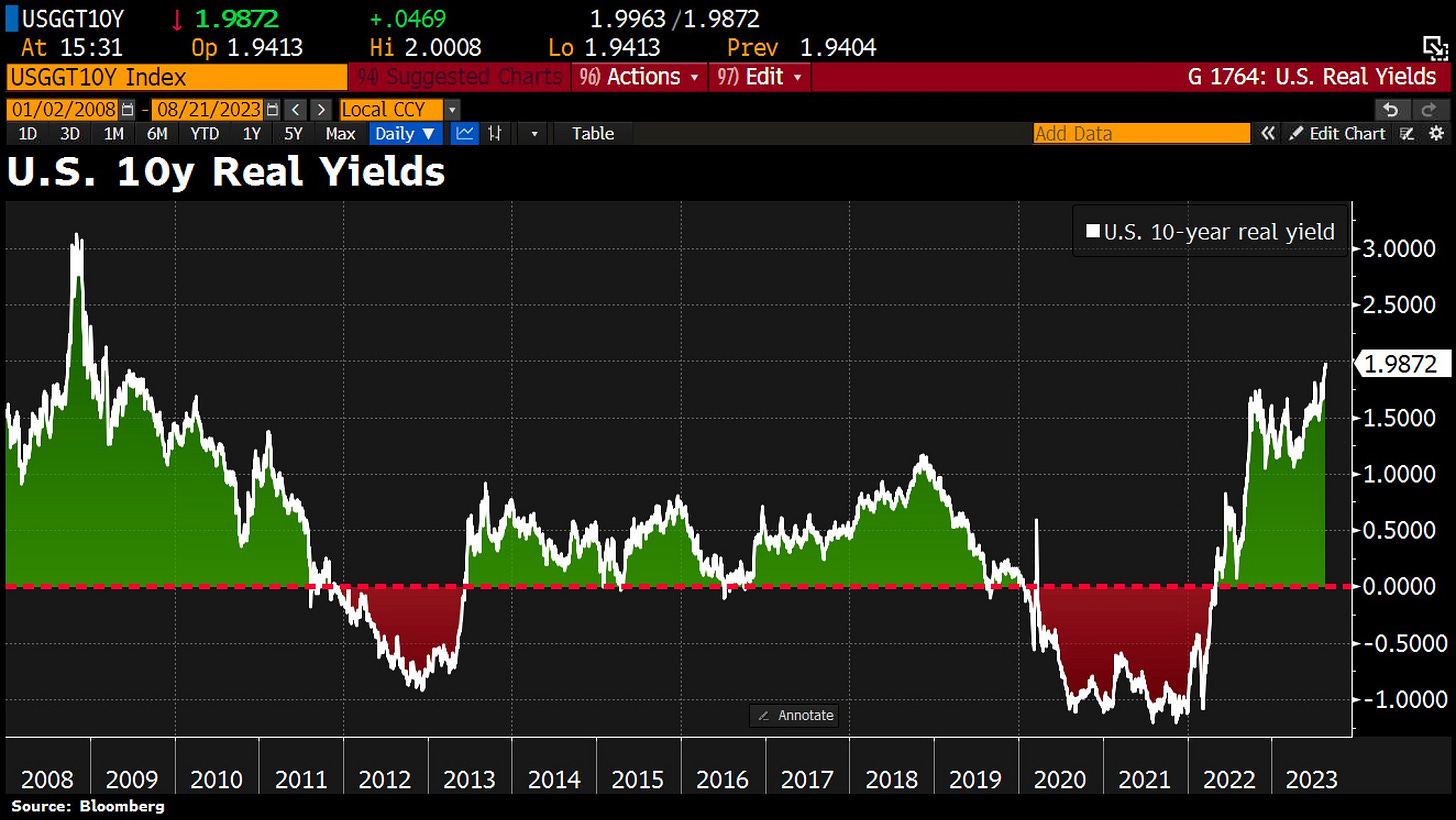
Bloomberg complementary view for the Real FED policy rates since 1980:
And yes, Bonds Are Back and they pay investors:
👉 US 10-year real yield at 2% pay over inflation
👉 highest levels since 2009
N.B. working currently on Special Report entirely dedicated to Bonds, stay tuned…
FED Balance Sheet & Fed Funds Effective Rate:
👉 still about $8.3 Trillion in monetary stimulus sloshing around the monetary system
👉 likely heading south and going inverted ... like Maverick in Top Gun ;)
Now this is a funny & popular chart that I kept getting asked to have my take on:
👉 Corporate High Yield at 3.79% and at the exact level from 2007 right before yields spiked and we had the Great Financial Crisis when Lehman imploded
3.79% is not some magic indicator, but a value that we were bound to have naturally in 15 years+ since Lehman imploded
it’s not the first time since we have the 3.79% value, hence why it did not spike before and ‘foresee’ a recession or ‘cause’ it?
recall: banking system is way more solid today than back then, no comparison
Overall, it’s a headlines nice looking chart, but no informational/research value imho.
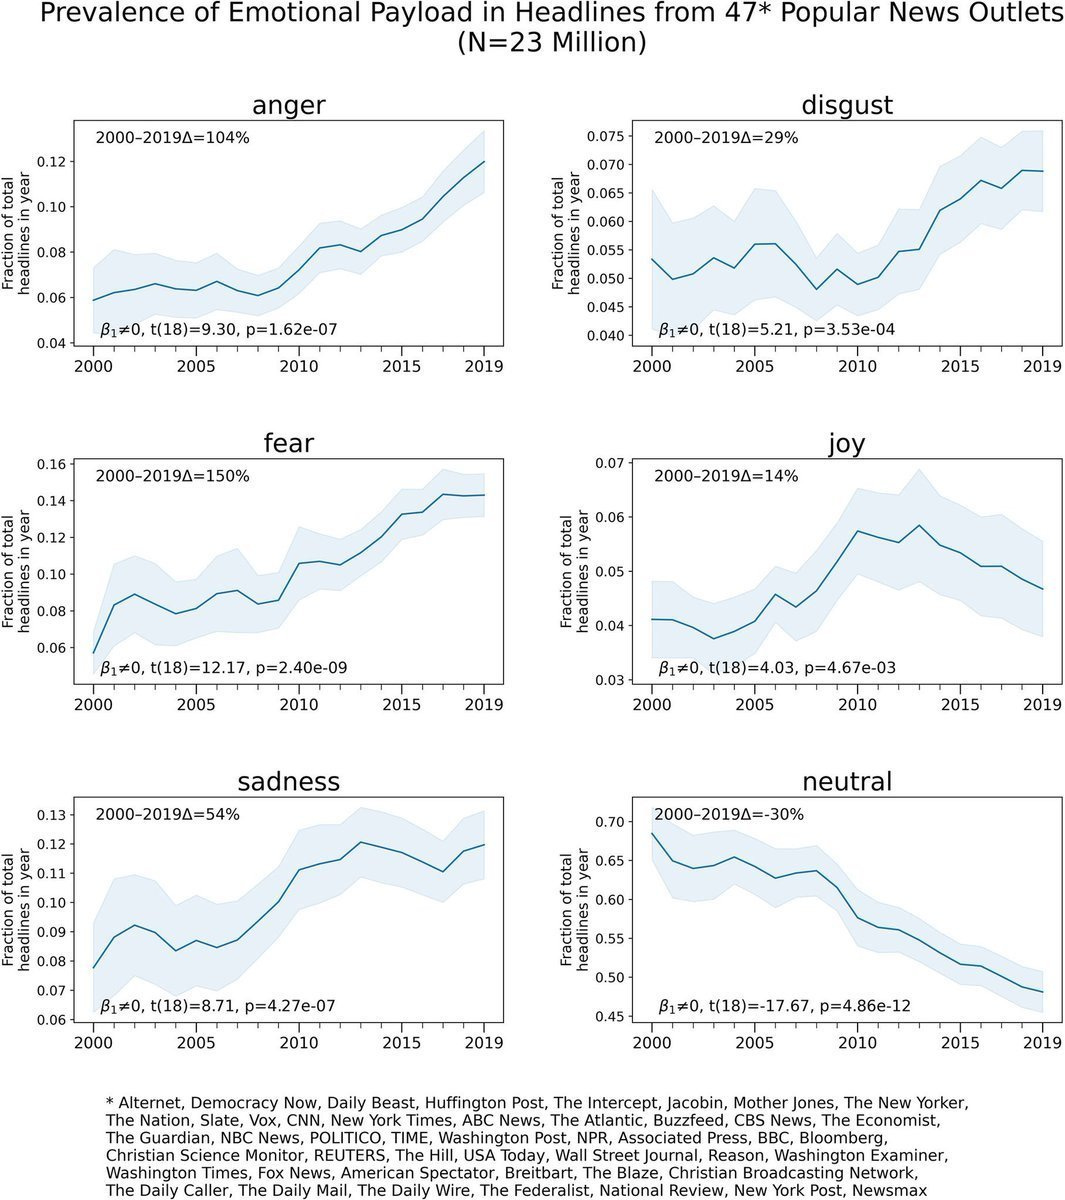
The Media chasing clicks & eyeballs for money = The Rise of NEGATIVE Media
👉 since 2000, the media massively increased headlines that use fear, anger, disgust, and sadness: anger +104%, fear +150%, disgust +29% & sadness +54%
👉 and in the same time it has also decreased articles of neutrality and joy
= the media is deliberately pushing your buttons as humans around the world are more activated by negative news coverage, hence creating a perverse incentive to spread gloomy content; no surprise no/few media outlets are covering this key point
N.B. don’t be ‘the product' via spread fear, anger, sadness & disgust coverage of all kind because it = them making $ money on you, it's the new 'normal' nowadays
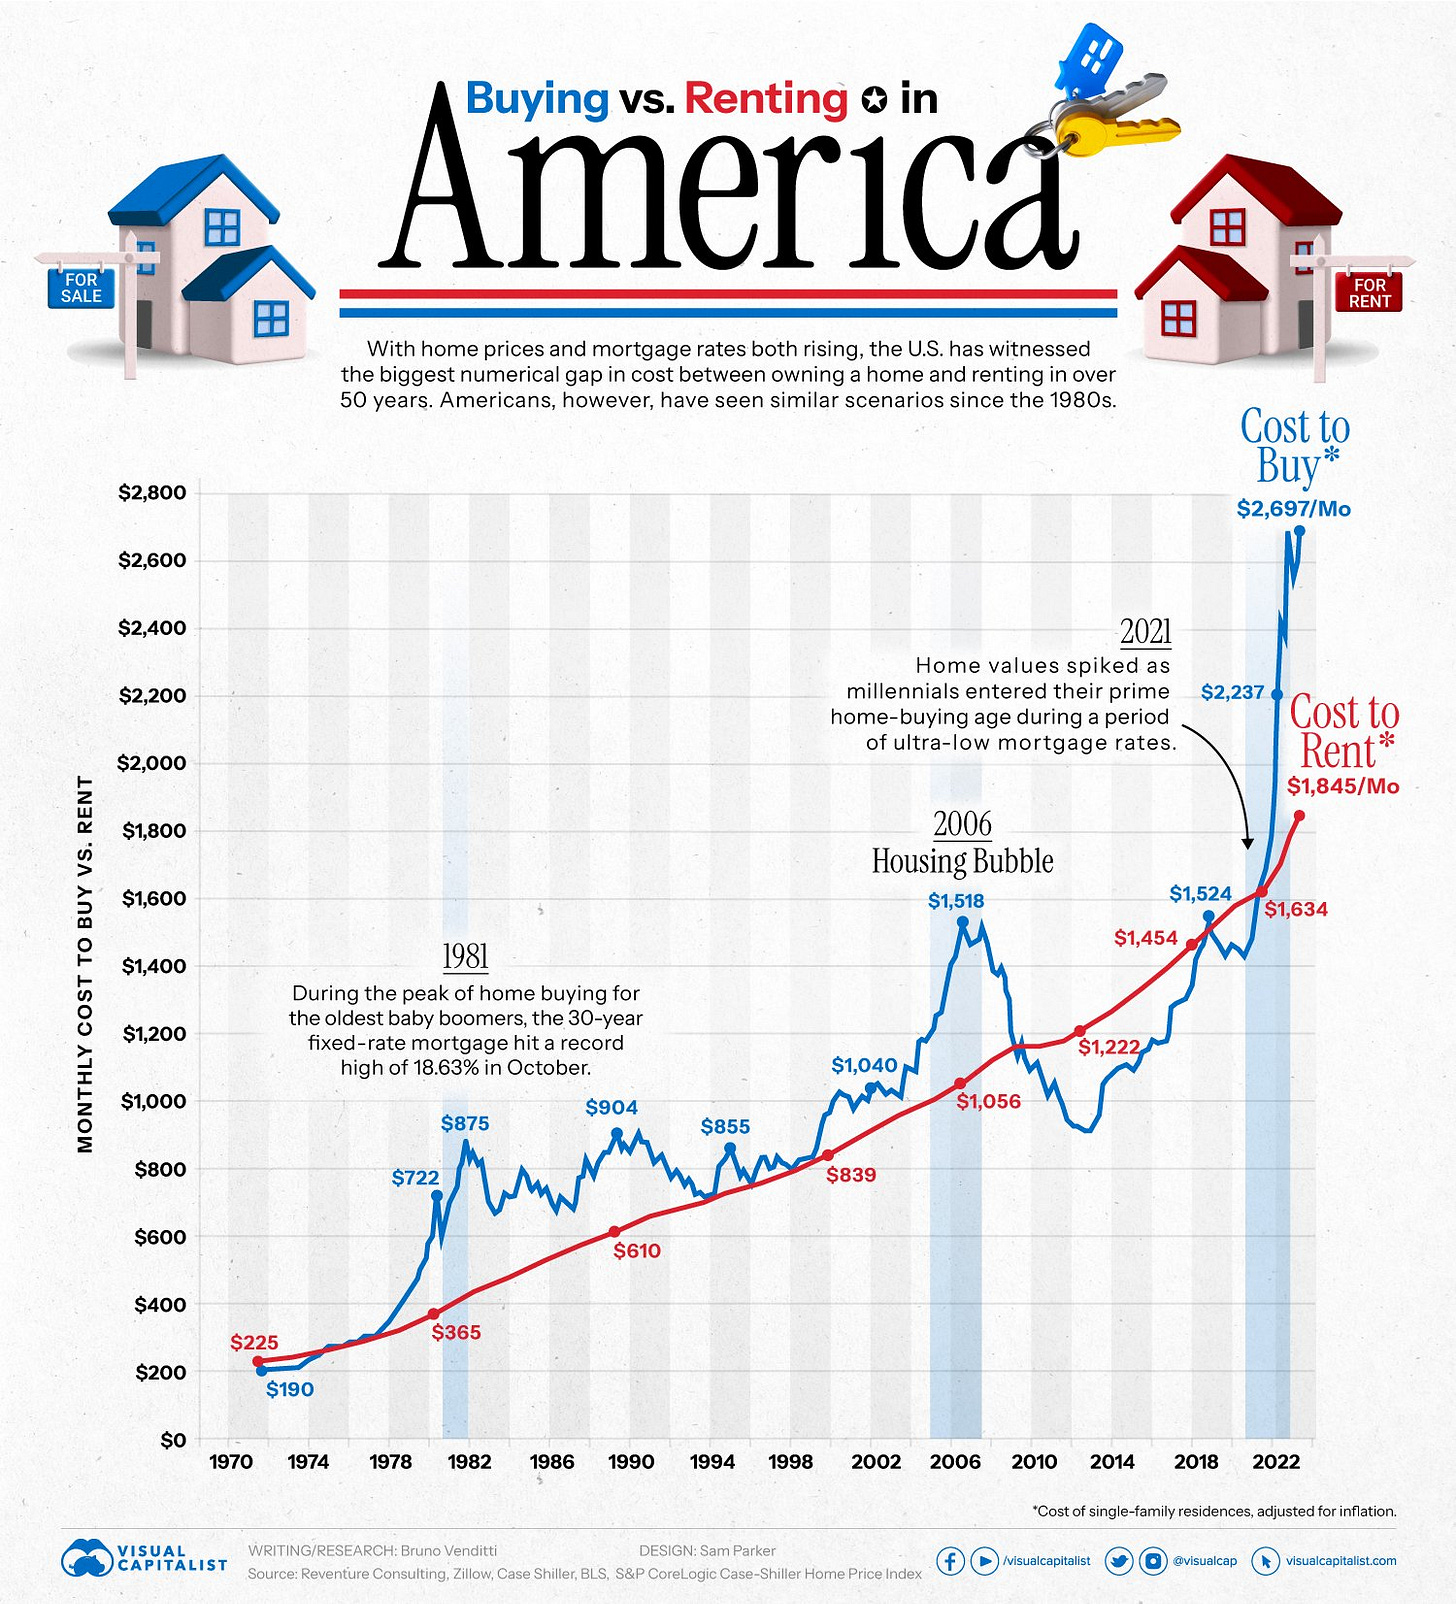
US Housing - Monthly Cost of Buying vs. Renting:
👉 median rent about $1,850/m = 30% cheaper than the median cost to buy at $2,700/m 👉 gap = the largest historical difference between renting & buying, let that sink in!
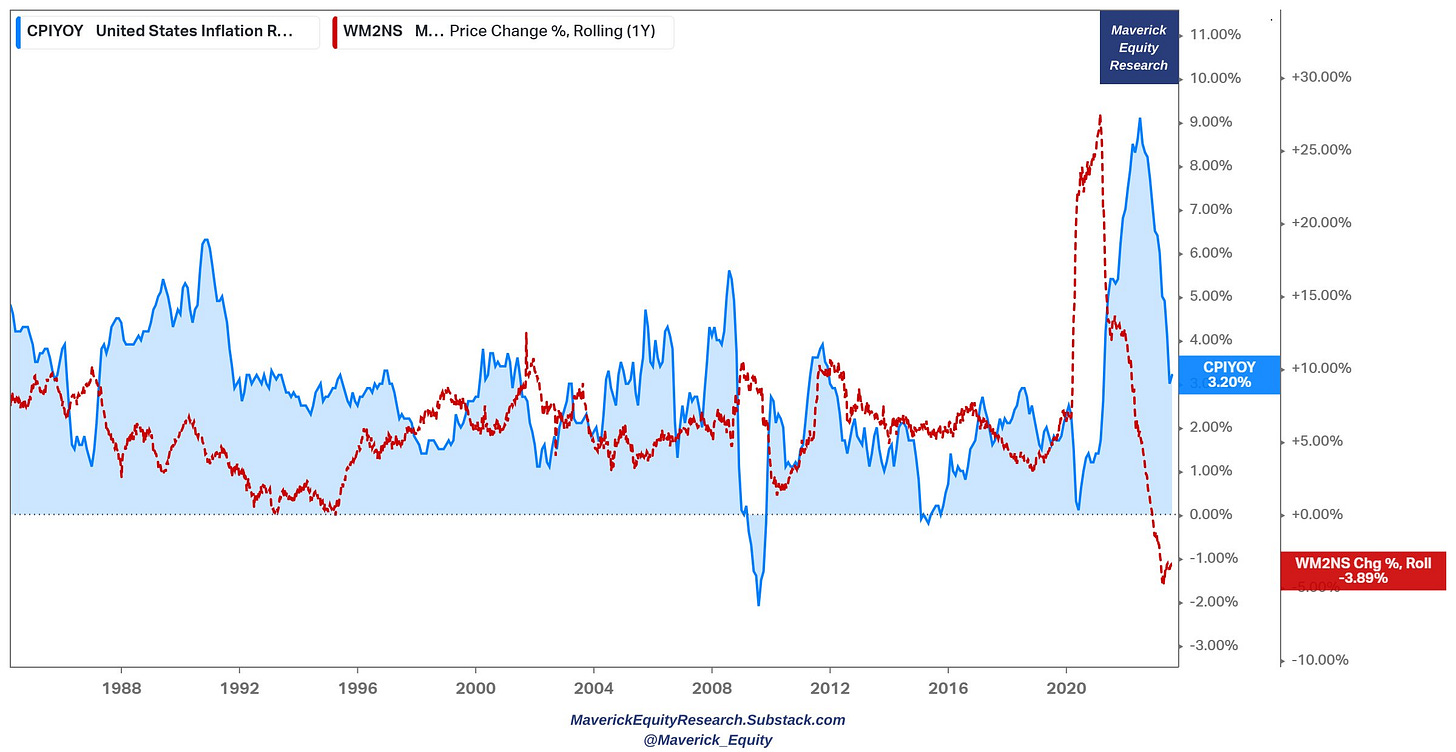
US Inflation:
👉after peaking in June 2022 at 8.9%, inflation reversed and fell to 3.2% following the key driver M2 money supply growth rate at -3.89%. The latter turned negative in Q4 2022 for the first time since 1933. Yes, almost a century! Let that sink in! …
👉 therefore, if inflation is primarily monetary phenomenon (which is in my opinion), how could it not keep going down? US CPI Y/Y (blue) & M2 growth Y/Y (red):
EuroZone inflation:
👉M2 (money supply) growth: negative at a -1.4% which = historical record low
👉 and yes, how could it not keep going down as well?
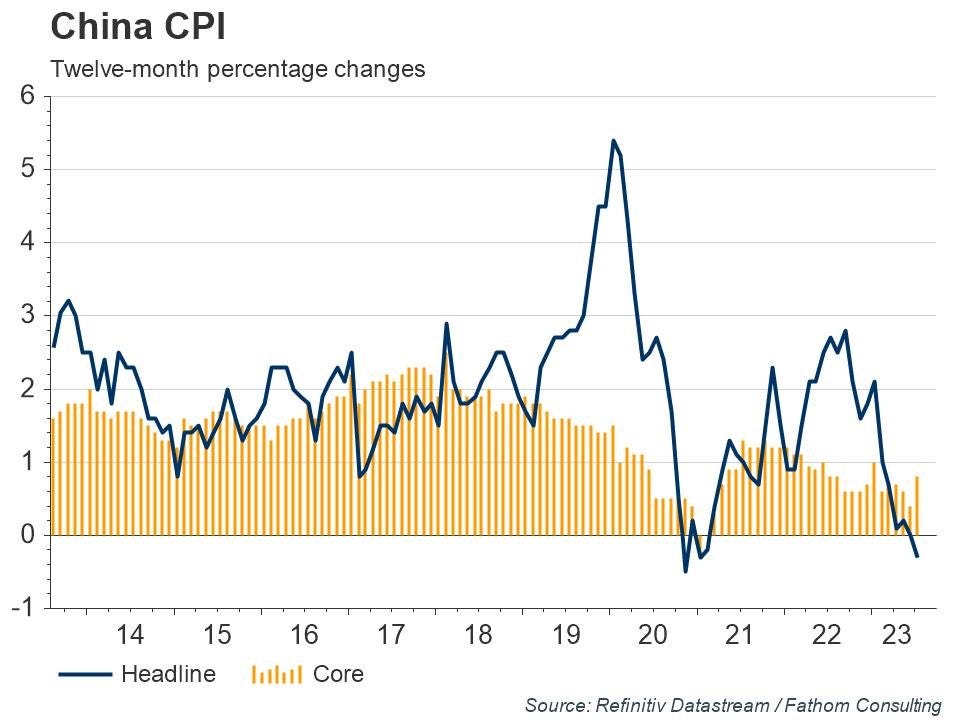
China inflation:
👉 China town into deflation - yes, de not i ...
👉 Now that disinflation process was fast ... Last time it was during the Covid times ..
The rise of the BRICS vs G7: BRICS are now 31.5% of global GDP vs the G7's 30%
👉 BRICS = Brazil, Russia, India, China & SA
👉 G7 = Canada, France, Germany, Italy, Japan, UK & US
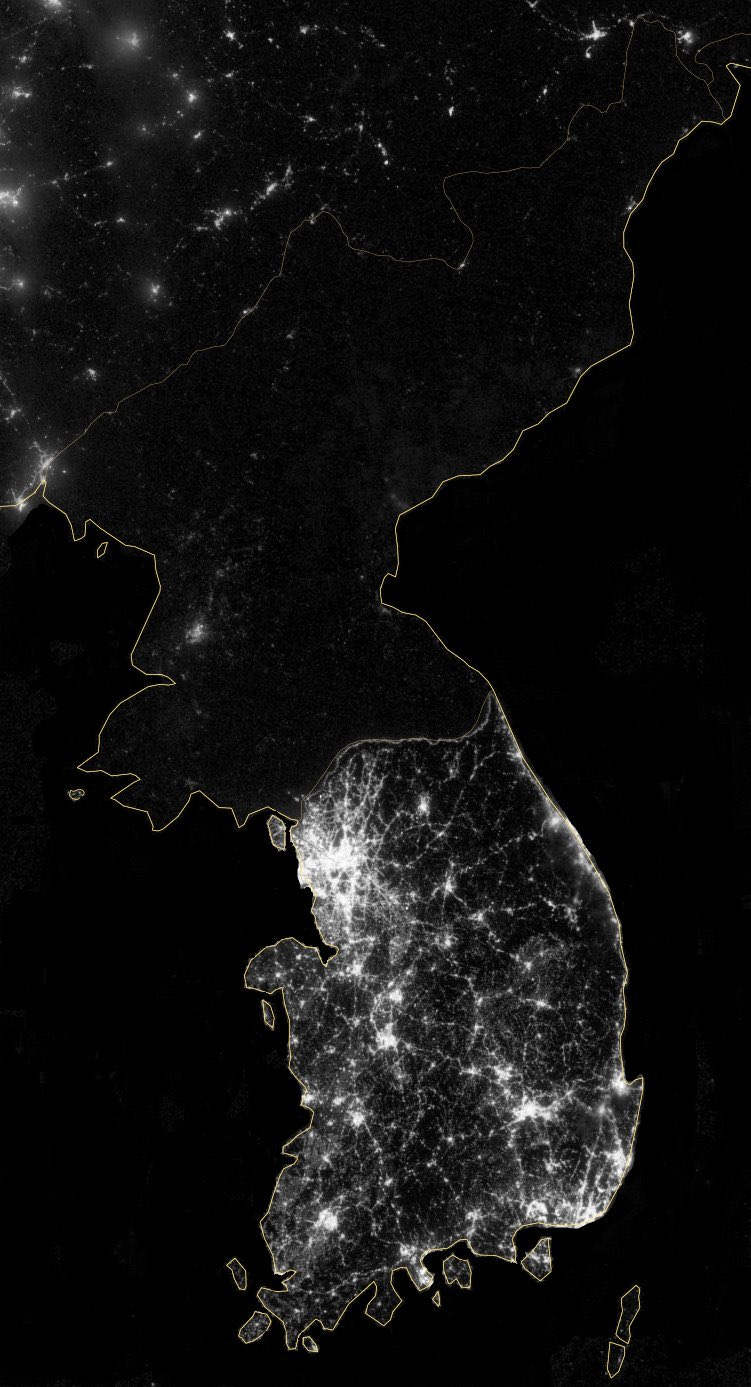
Guess what’s there below? North Korea & South Korea by lights activity at night
👉 now guess which one is communism and which one capitalism? You got it ;)
👉 old adage goes like: socialism is even distribution of poverty, capitalism is uneven distribution of wealth (there is a lot more to the subject naturally, one day maybe…)
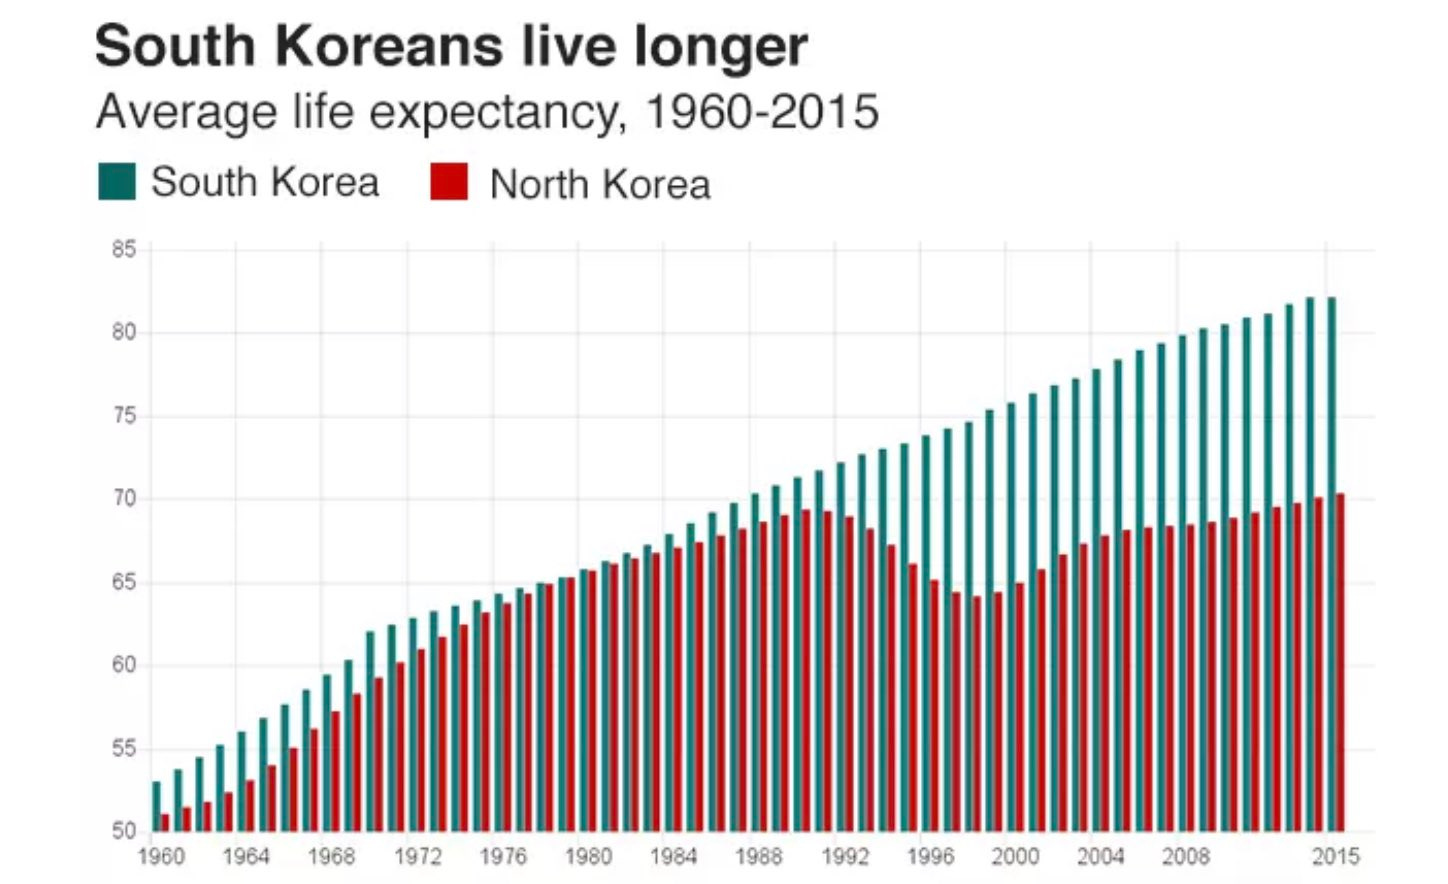
Lights activity during night is not just about playing video games and going out. Check the big gap in terms of live expectancy … not much to comment further …
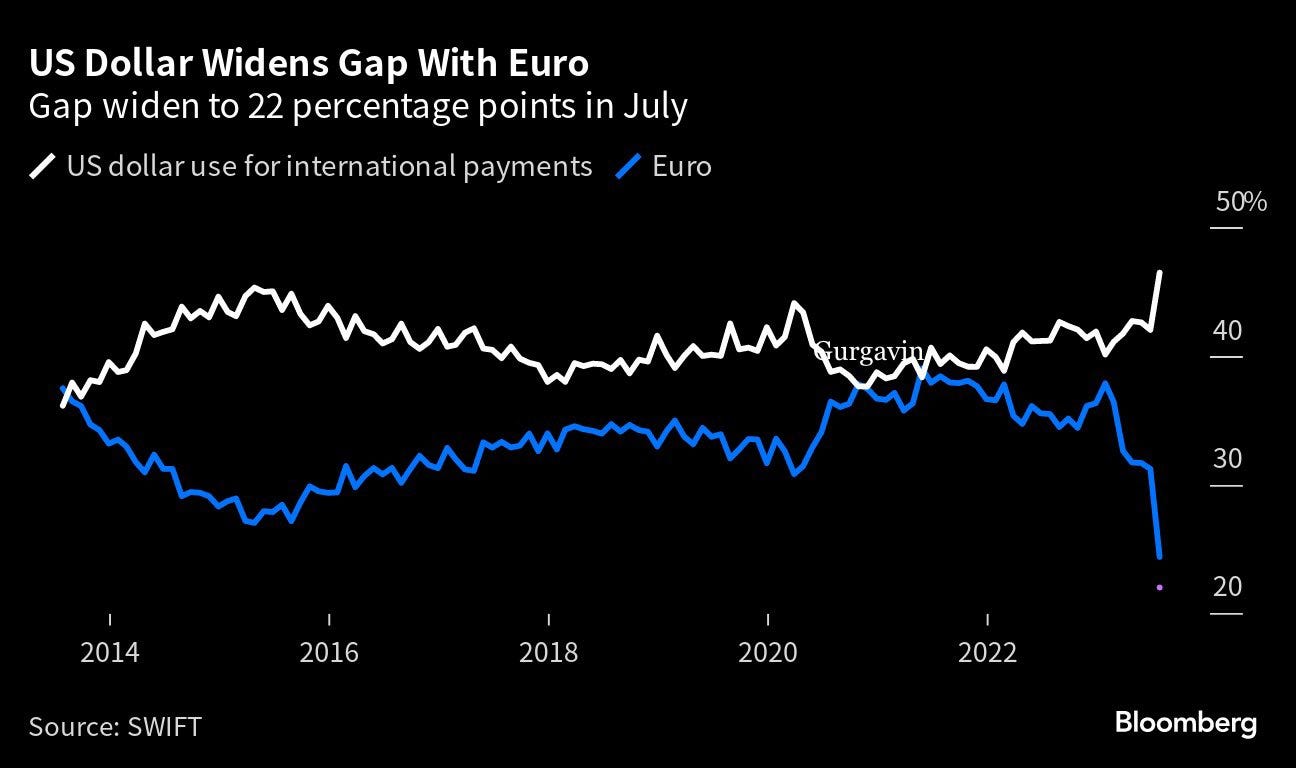
18, 19 & 20. It is soon 20 years since I keep hearing ‘The Death of the US Dollar’
👉 US dollar use for international payments VS the Euro: 22% gap
👉 US dollar role globally with a new all time high at 46%
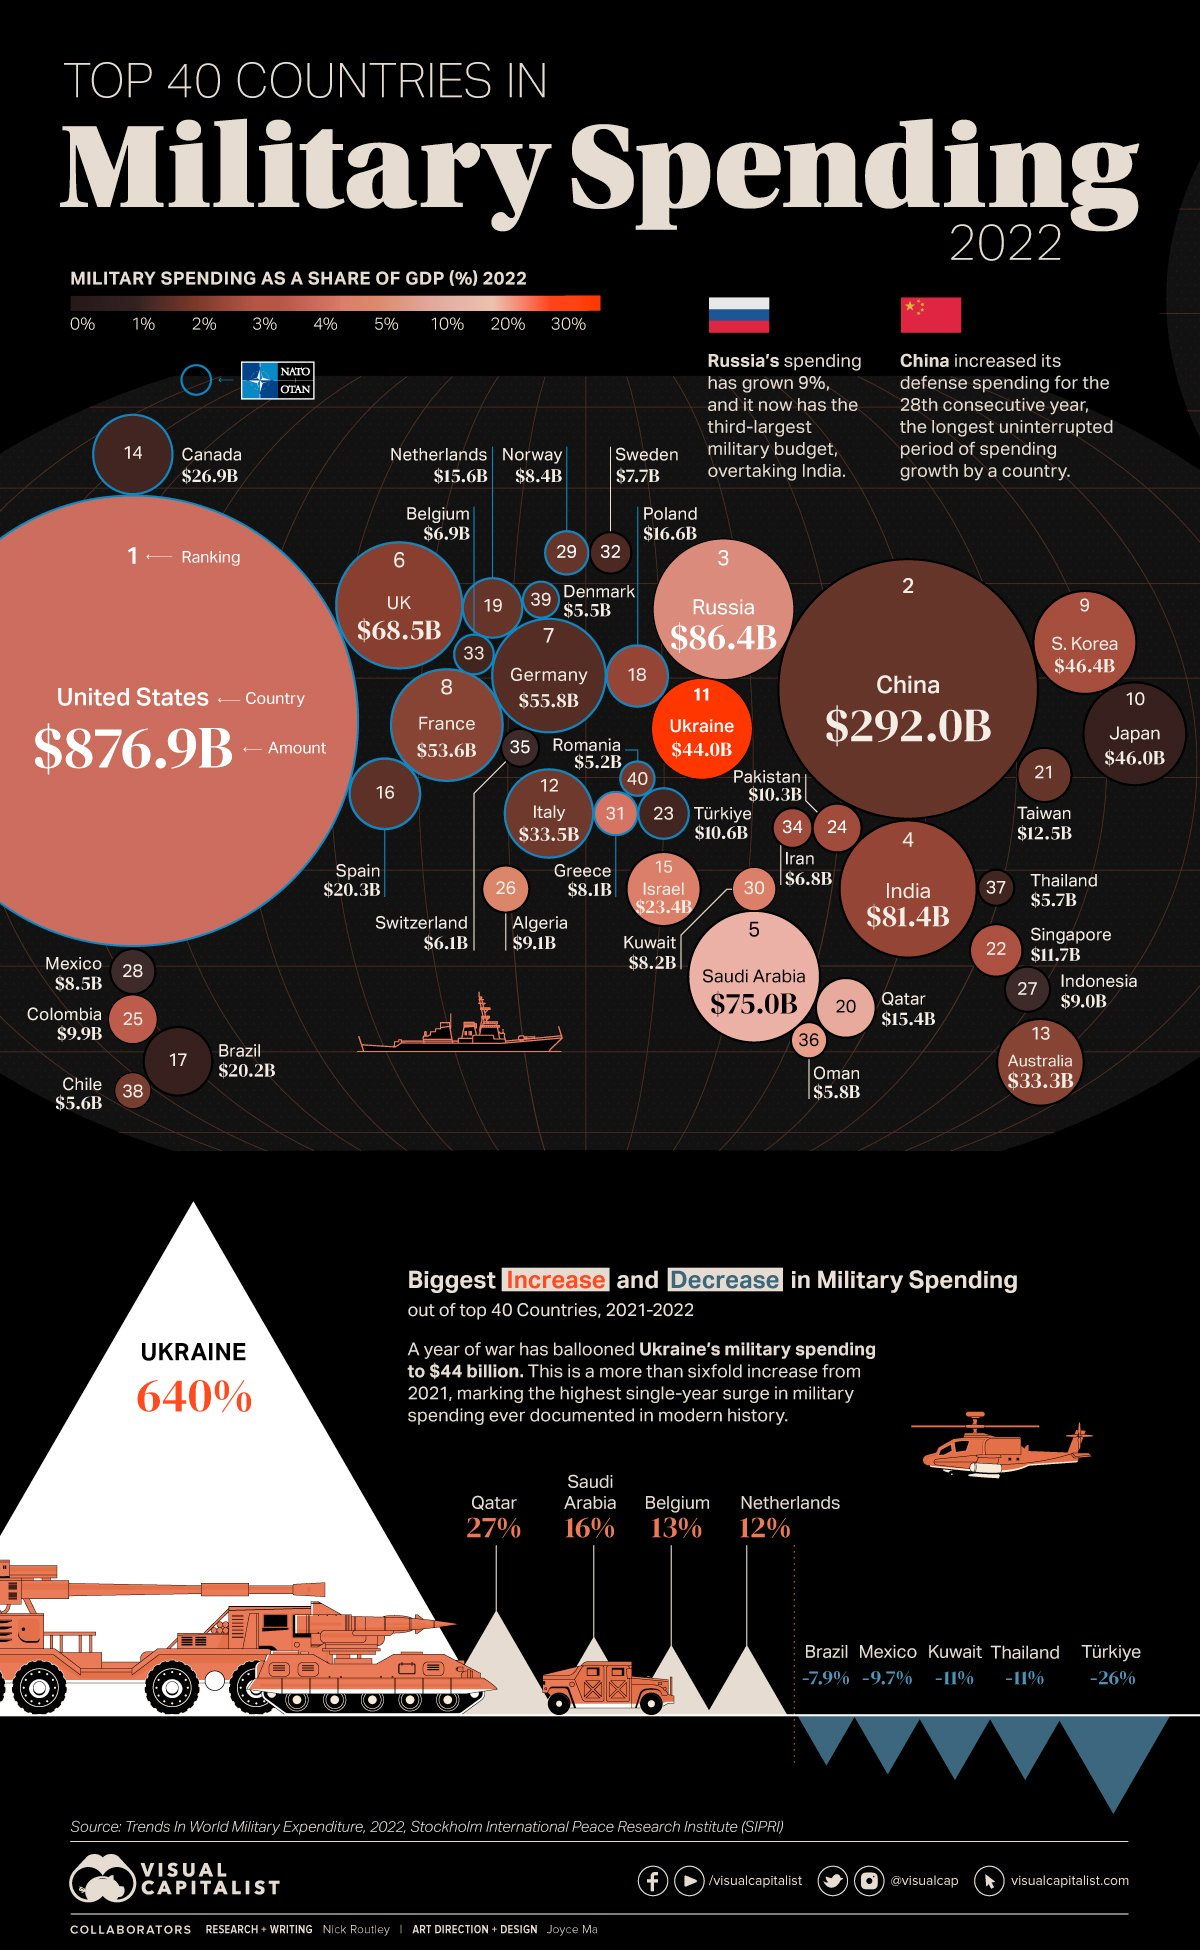
World’s Top 40 Largest Military Budgets: US #1 matters for US dollar world status
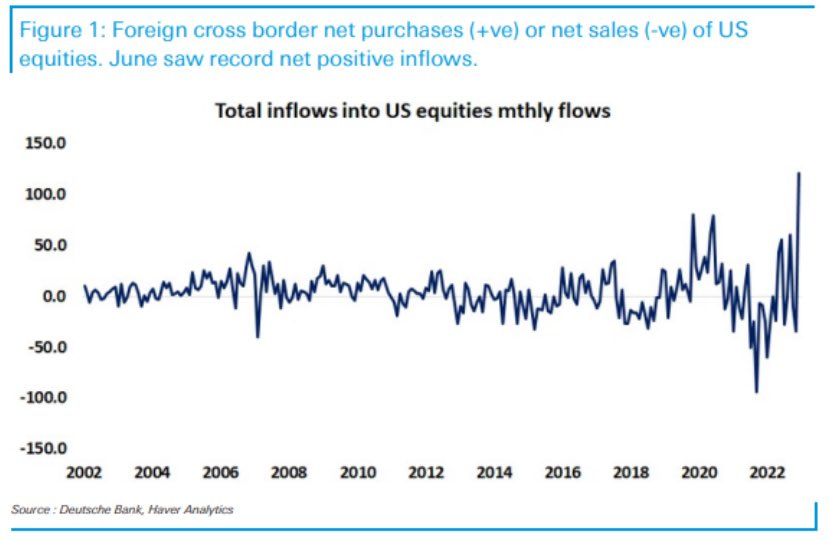
Also, record positive inflows into US equities: and yes, they are priced in USD :)
Add also the last 5 years since cryptocurrencies came to town & suddenly overnight macro monetary experts are born (sarcasm alert) when they realise the $ (any currency btw) is fiat currency … while cryptocurrencies ‘are real’ and will replace the dollar … not saying there is no use case for crypto, but to say it’ll replace the $ is bananas imho
By the way, the only few people that make money (real dollars, euros the irony) via cryptocurrencies are:
the scammers and grifters pumping the thousandths of cryptocurrencies out there
a very few that bought early without knowing what they bought, but even those that bought early sold too soon … then started to ‘trade’ in & out … I know many and nope, they did not do well as many headlines kept saying across the years … for clicks, views, chasing eyeballs for sensationalism = advertising revenue
the ones that own the crypto infrastructure, mine it etc & maybe one day I will do an investment research (Special Situations section) piece on it - preview = simple: ‘Don’t go to Las Vegas to gamble, you will lose, but own a small part of Las Vegas (infrastructure) and you have a good chance to win … you just need many many players joining your infrastructure … let them play, have fun … tails you win, heads you win …’
5 Bonus charts:
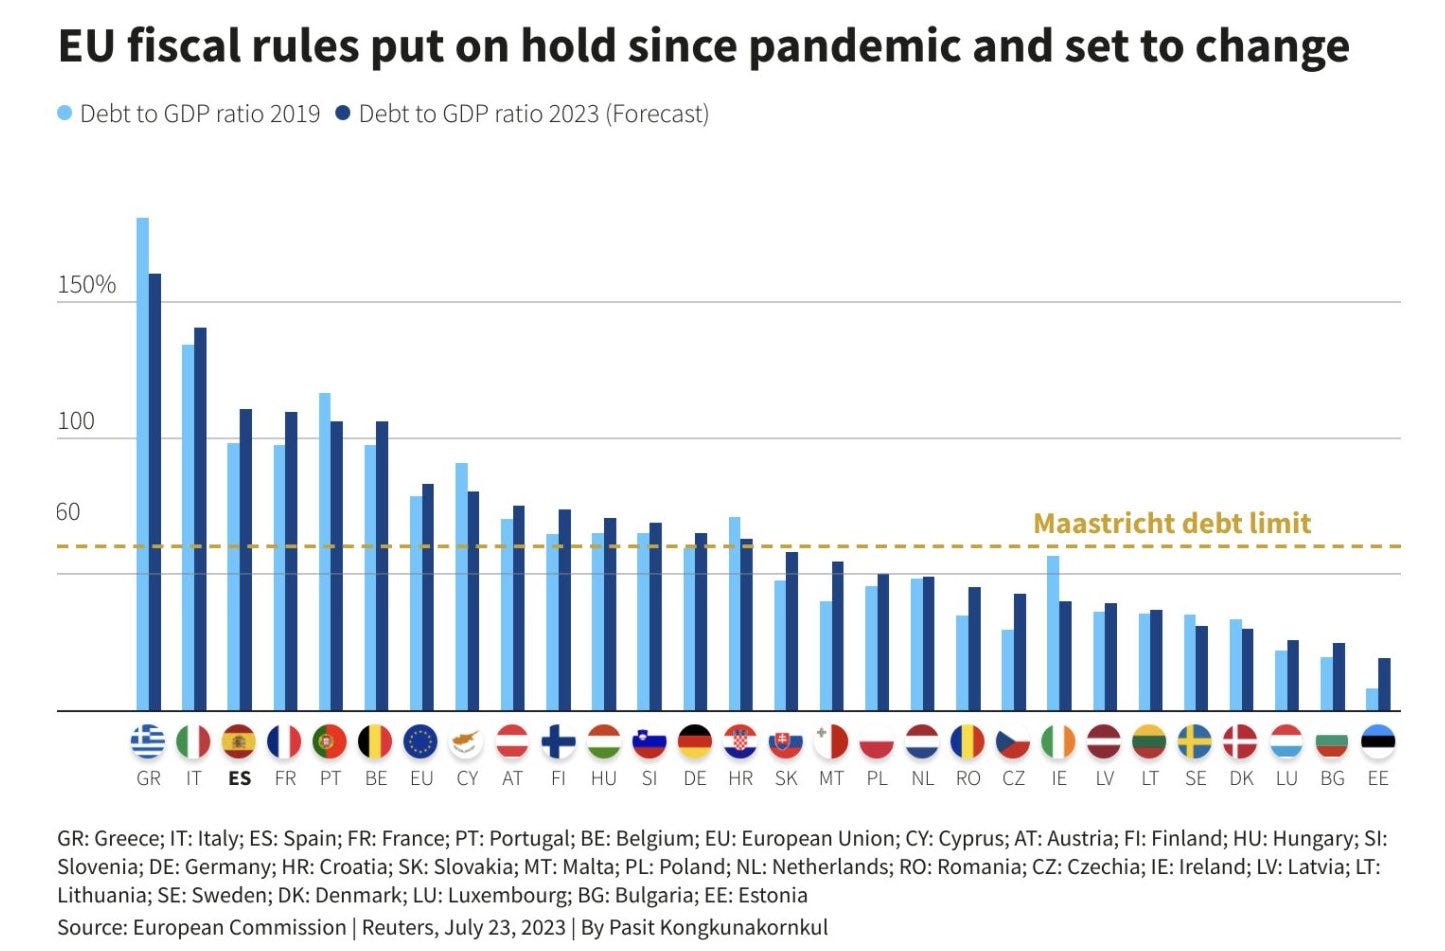
EU Maastricht Debt/GPD limits on hold since the pandemic and set to change … no wonder given many are above the Debt/GDP ratio limit …
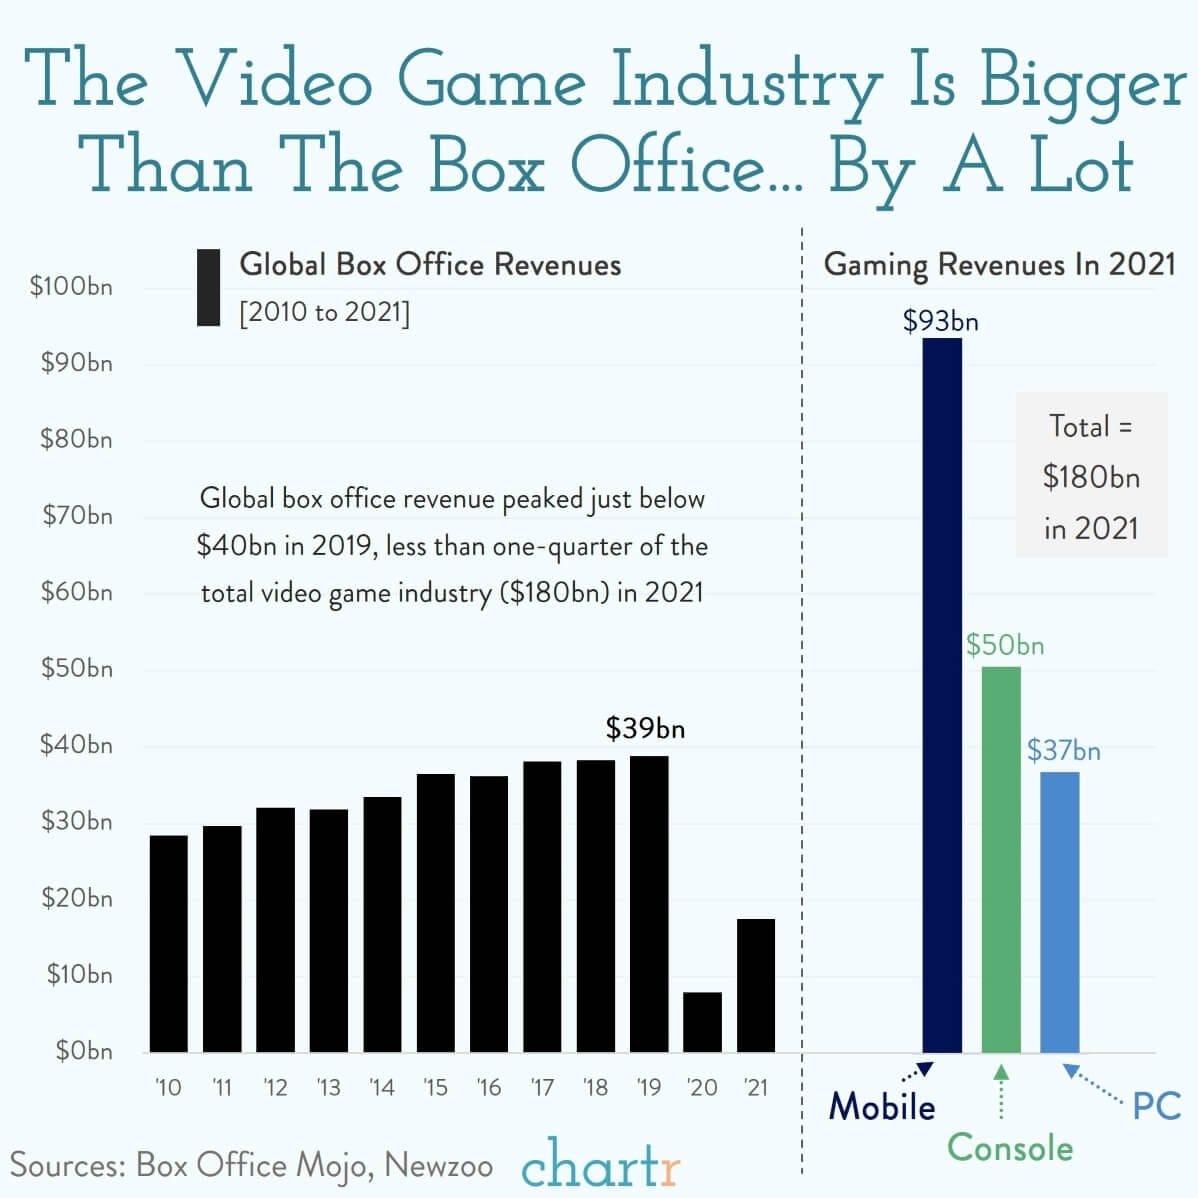
The Video Game Industry Is Bigger Than You Think
bigger than all music, TV, and film combined aka ‘The Box Office’
it has out-earned music and entertainment for the last 8 years!
Norway’s oil fund fun fact:
It makes $1 billion per week and holds 1.4% of the world's shares
larger than the combined wealth of the 10 richest people in the world
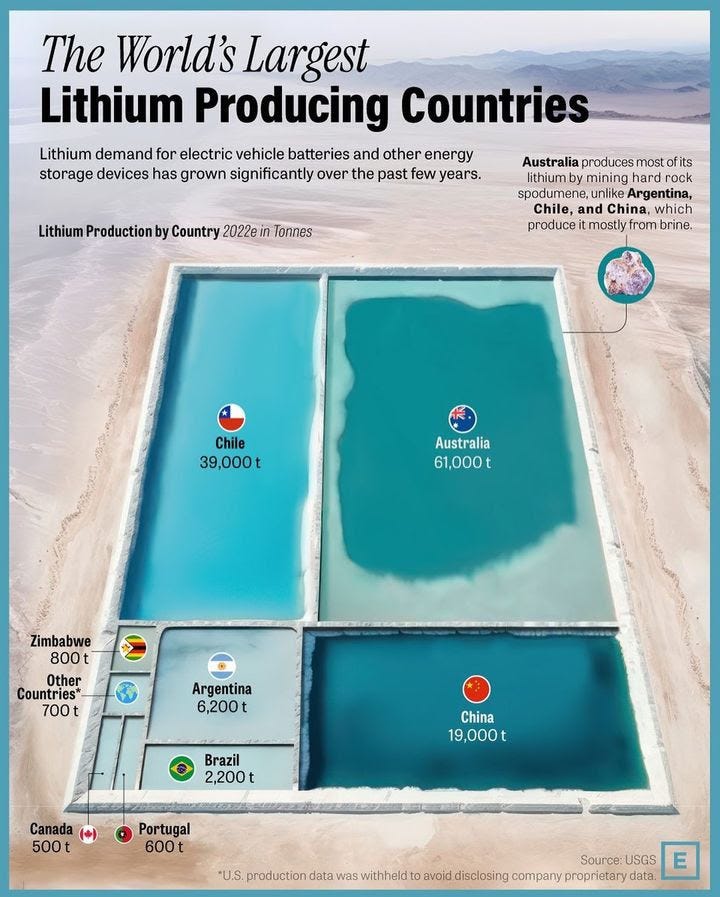
Guess the biggest lithium producer country (EV batteries key part)? Australia!
In 2022-2023, Australia made $16 billion in Lithium which is up from $5 billion the previous year
who bought that and how much of it? China bought 96% of it
VC money seems to be flowing out of crypto to you guessed it, AI!
Research is NOT behind a paywall & no pesky ads here. What would be appreciated?Just sharing it around with like-minded people. In case not already, subscribe to get all the future research straight to your inbox. Twitter thread can be read here.
Thank you & have a great weekend!
Mav










Wow