


✍️ Maverick Charts of the Week #11: Corporate America margins, tax rates & CEO confidence + S&P 500 Valuation, Earnings & Chatter
10 Maverick Charts that say 10,000 words + 5 Bonus

Dear all,
10 + 5 Maverick Charts of the Week that I diligently cherry picked for both data-driven insights + valuable food for thought!
Table of contents:
📊 Maverick Charts: Corporate America profit margins, tax rates & CEO confidence, S&P 500 Valuation, Earnings & Chatter + fun chart Germany and California GDP
📊 Bonus: The world’s most educated countries, Top 25 countries with the highest life expectancy, Global defense industry, Shadow economies & Robo-taxis
Delivery is in typical fashion, via Maverick charts that say 10,000 words or more!
📊 Maverick Charts: Corporate America profit margins, tax rates & CEO confidence, S&P 500 Valuation, Earnings & Chatter + fun chart Germany and California GDP 📊
Kicking off with another rare Maverick-esque chart you rarely see elsewhere, and a question that many ask and/or should ask, not too often, but quarterly like I do:
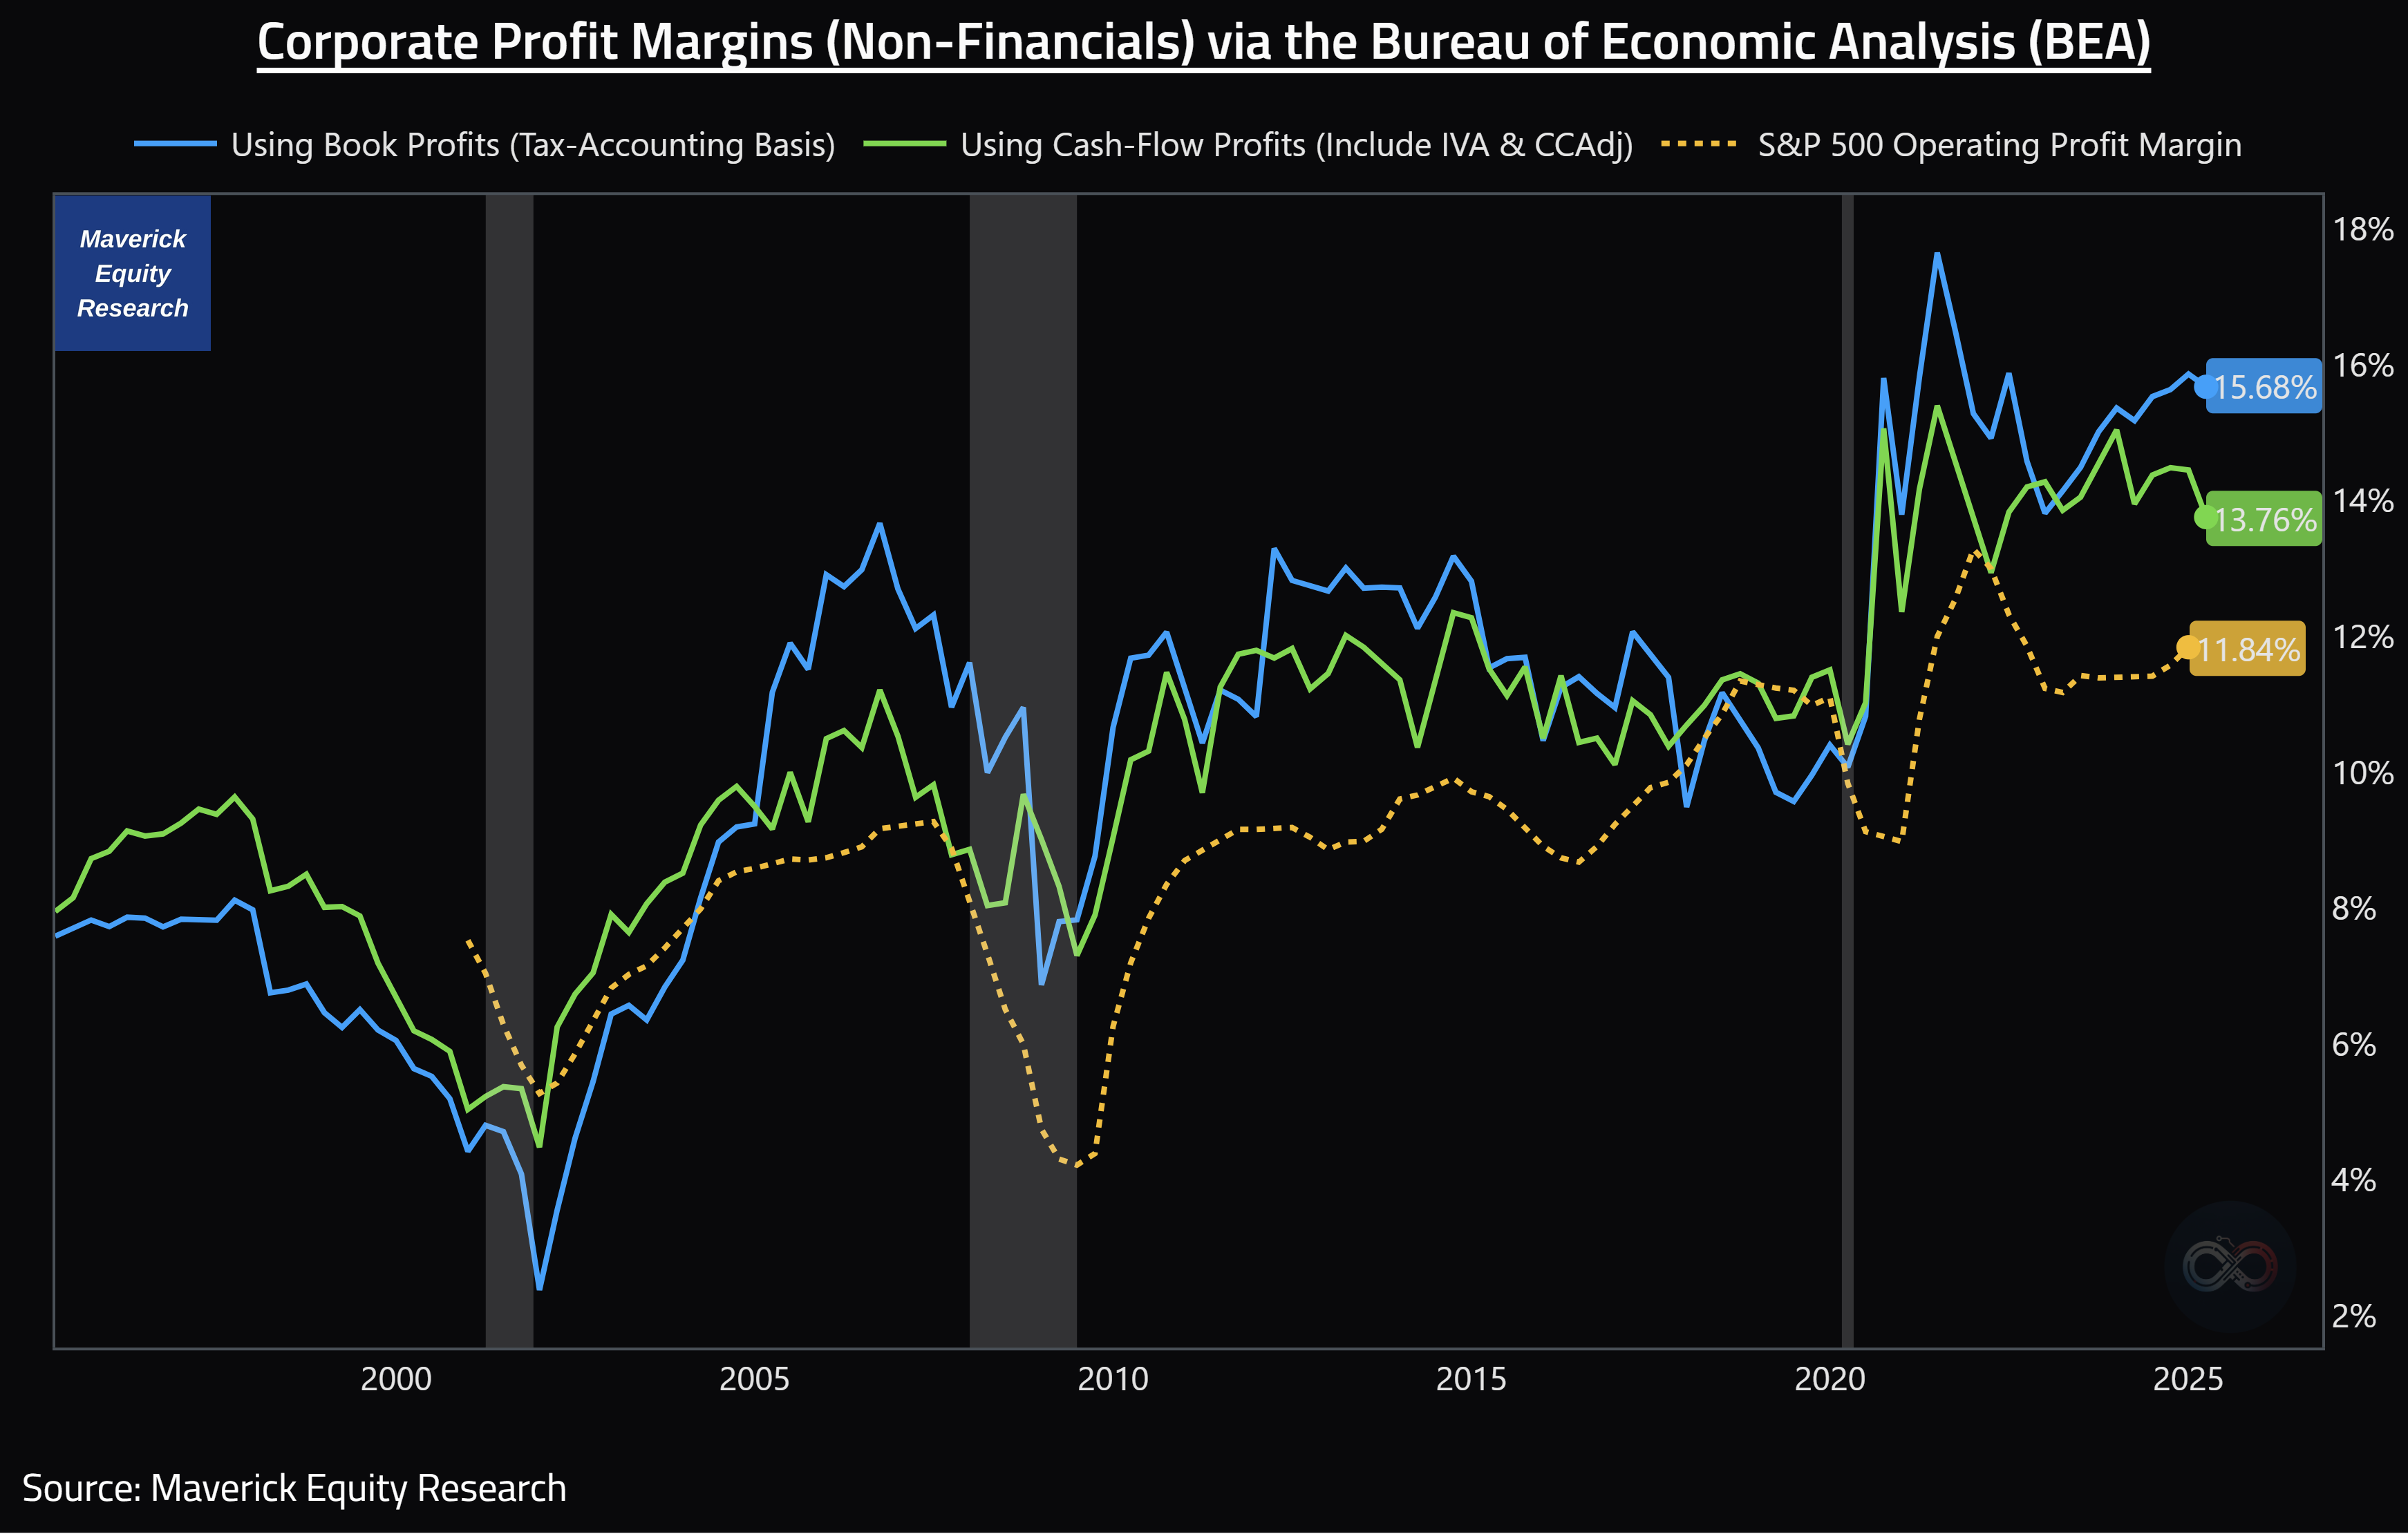
‘Maverick, how are profit margins in the entire Corporate America doing?‘ via BEA, both overall (excluding financials) + the S&P 500 (including fins) for 10,000 words:
👉 both are doing very well - note how they are even above both 2019 pre-pandemic times & 2006 pre-Lehman/GFC times (bottomed at 4.2%, now at almost 12% for a 3x)
👉 on the short term everything is possible in the U.S.: hiccups, recessions, circus politics, headlines, drama, YOLO, FOMO, though one has to really be brave/foolish to bet against Corporate America & the U.S. consumer - the medium-long trend is up!
2 further complementary notes to cover F.A.Q.:
S&P 500 profits & BEA profits are correlated (correlation > 0.8), yet differences exist due to coverage, accounting methods, and industry representation
BEA corporate profits data include the profits of S&P 500 companies as part of the broader universe of all U.S. corporations, but the BEA figures are more comprehensive and reflect the entire corporate sector, not just the S&P 500 index
U.S Corporate Tax Rate (Non-Financials) in order to get it going below the operating margins of Corporate America’s income statements:
👉 Low tax rate at 17.93% currently - a clear down trend for many decades now
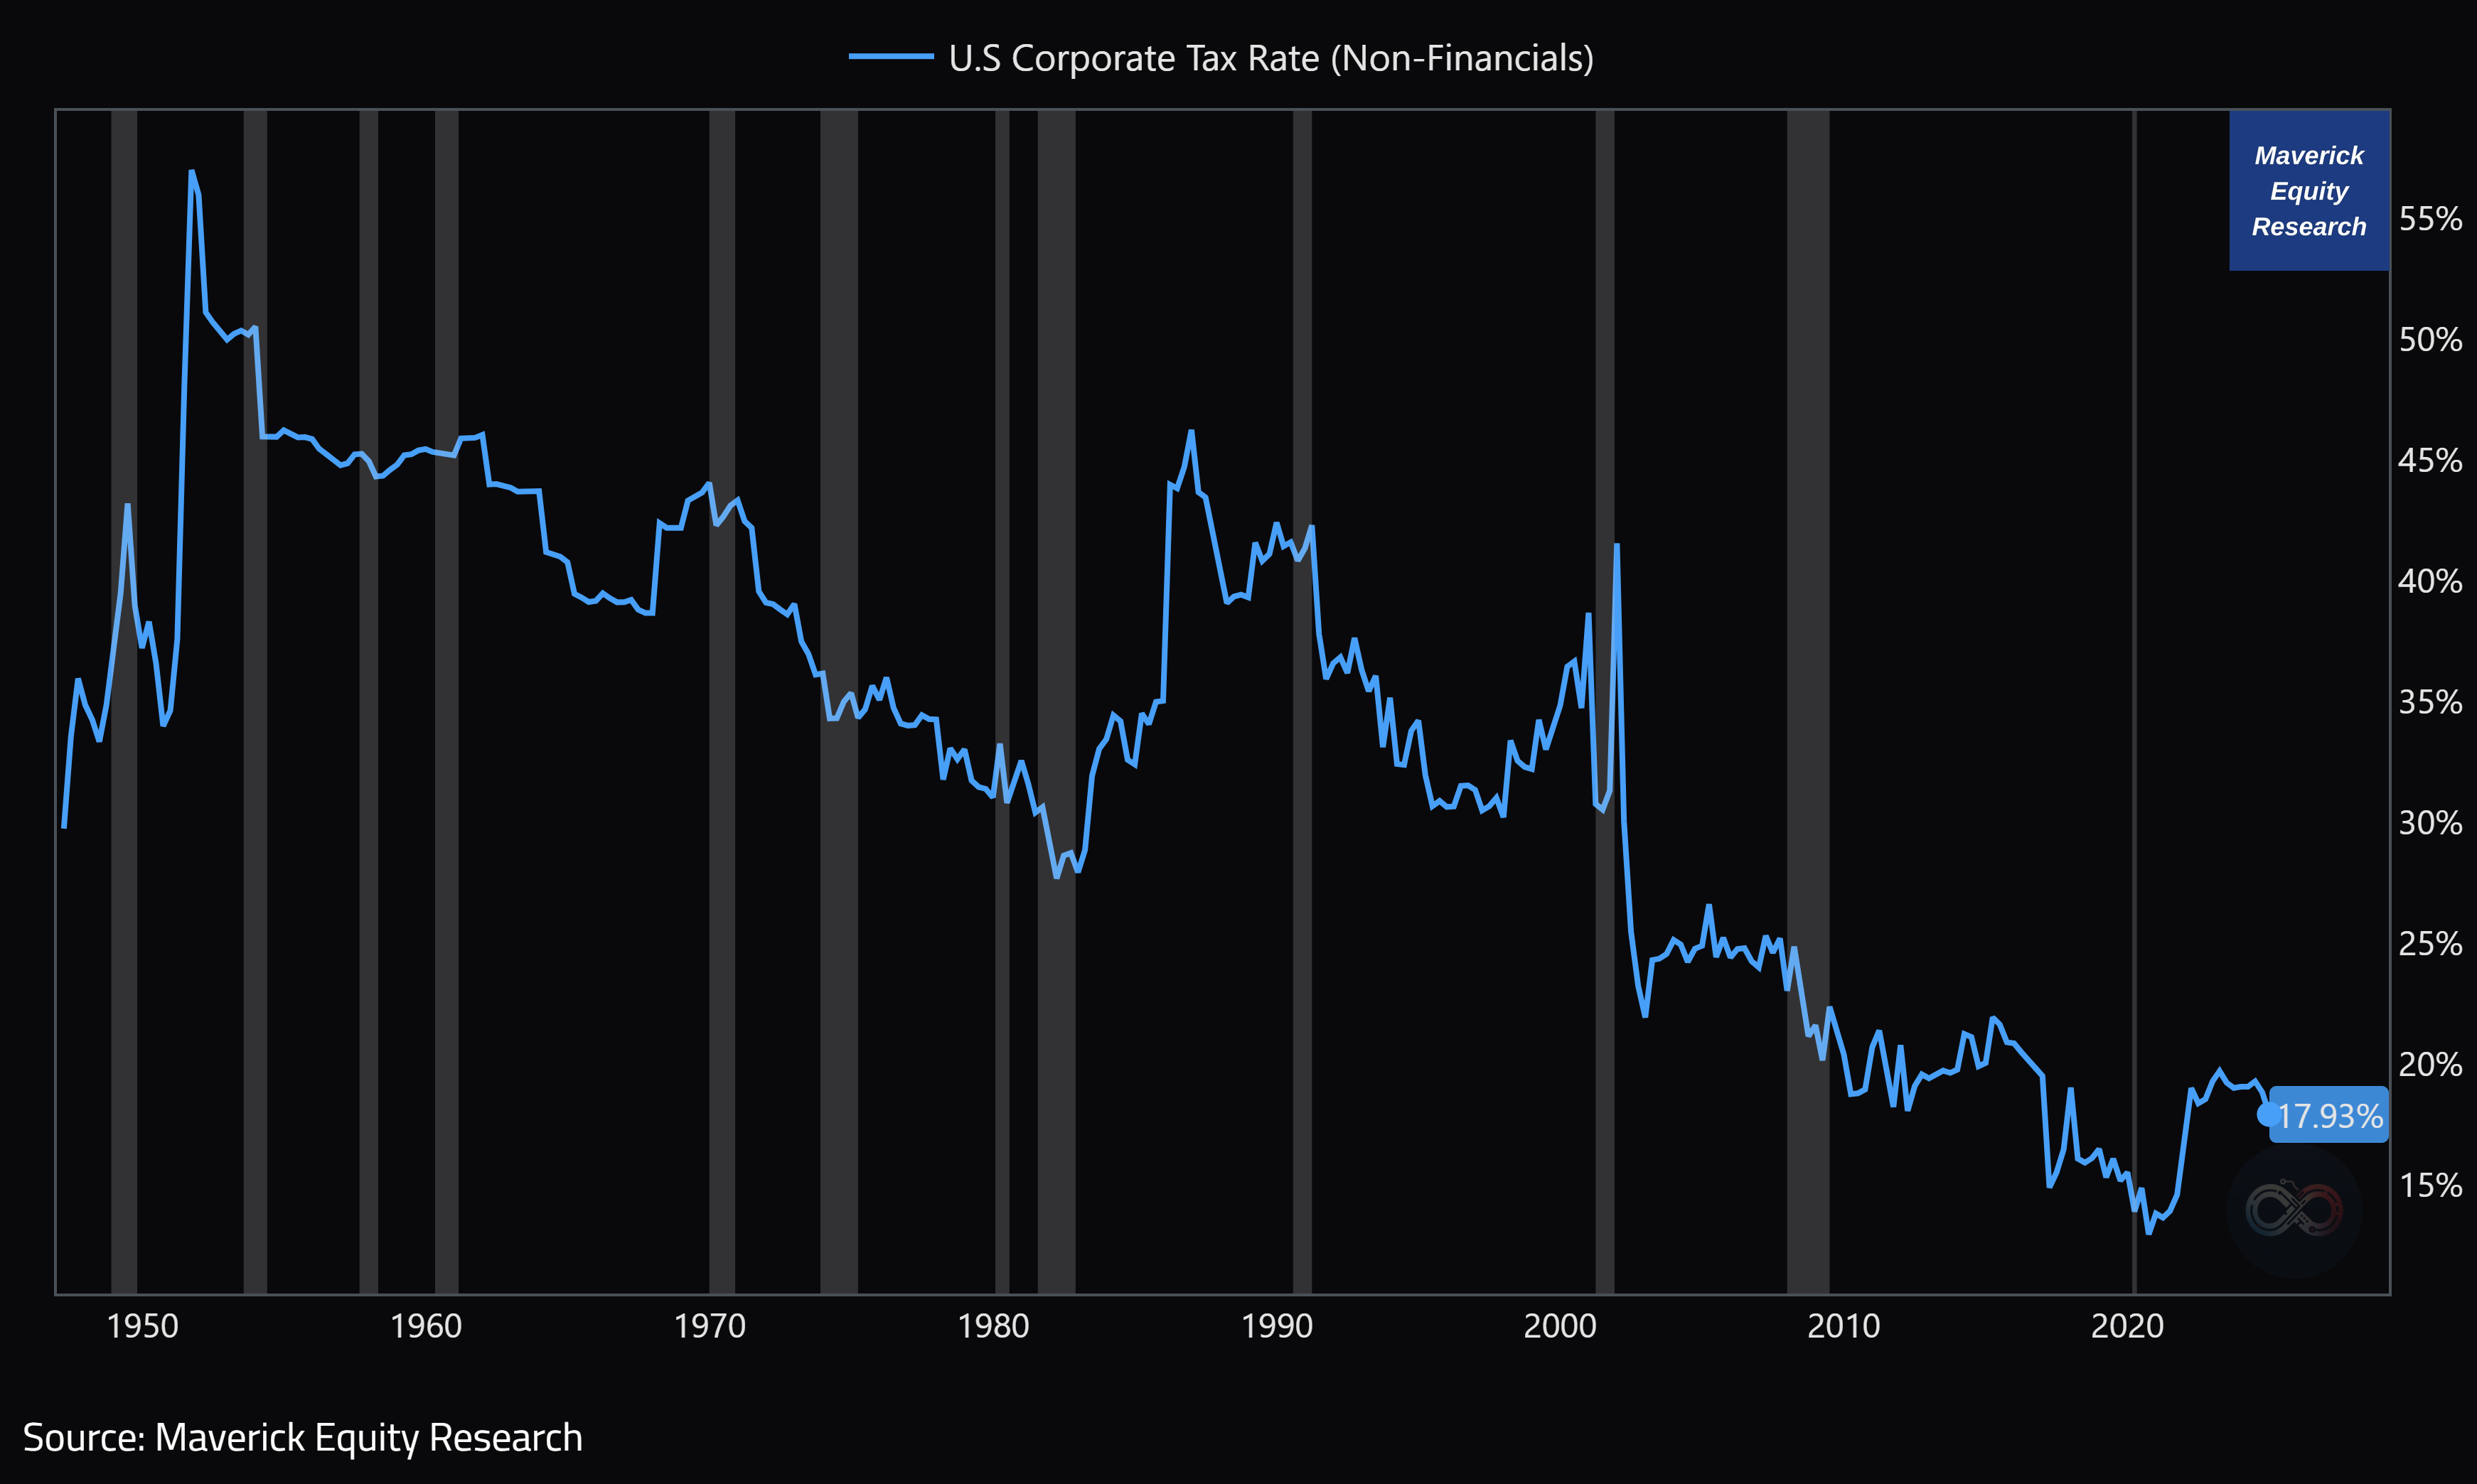
Maverick net take on Margins and Tax Rates: juicy operating margins + low tax rates explain quite a lot the U.S. outsized stocks returns, aka the U.S Exceptionalism
N.B. these 2 key charts and way more will be part of my future U.S. economy coverage via my dedicated & extensive macro research - the 4th edition is work in progress!
✍️ The State of the U.S. Economy in 75 Charts, Edition #4
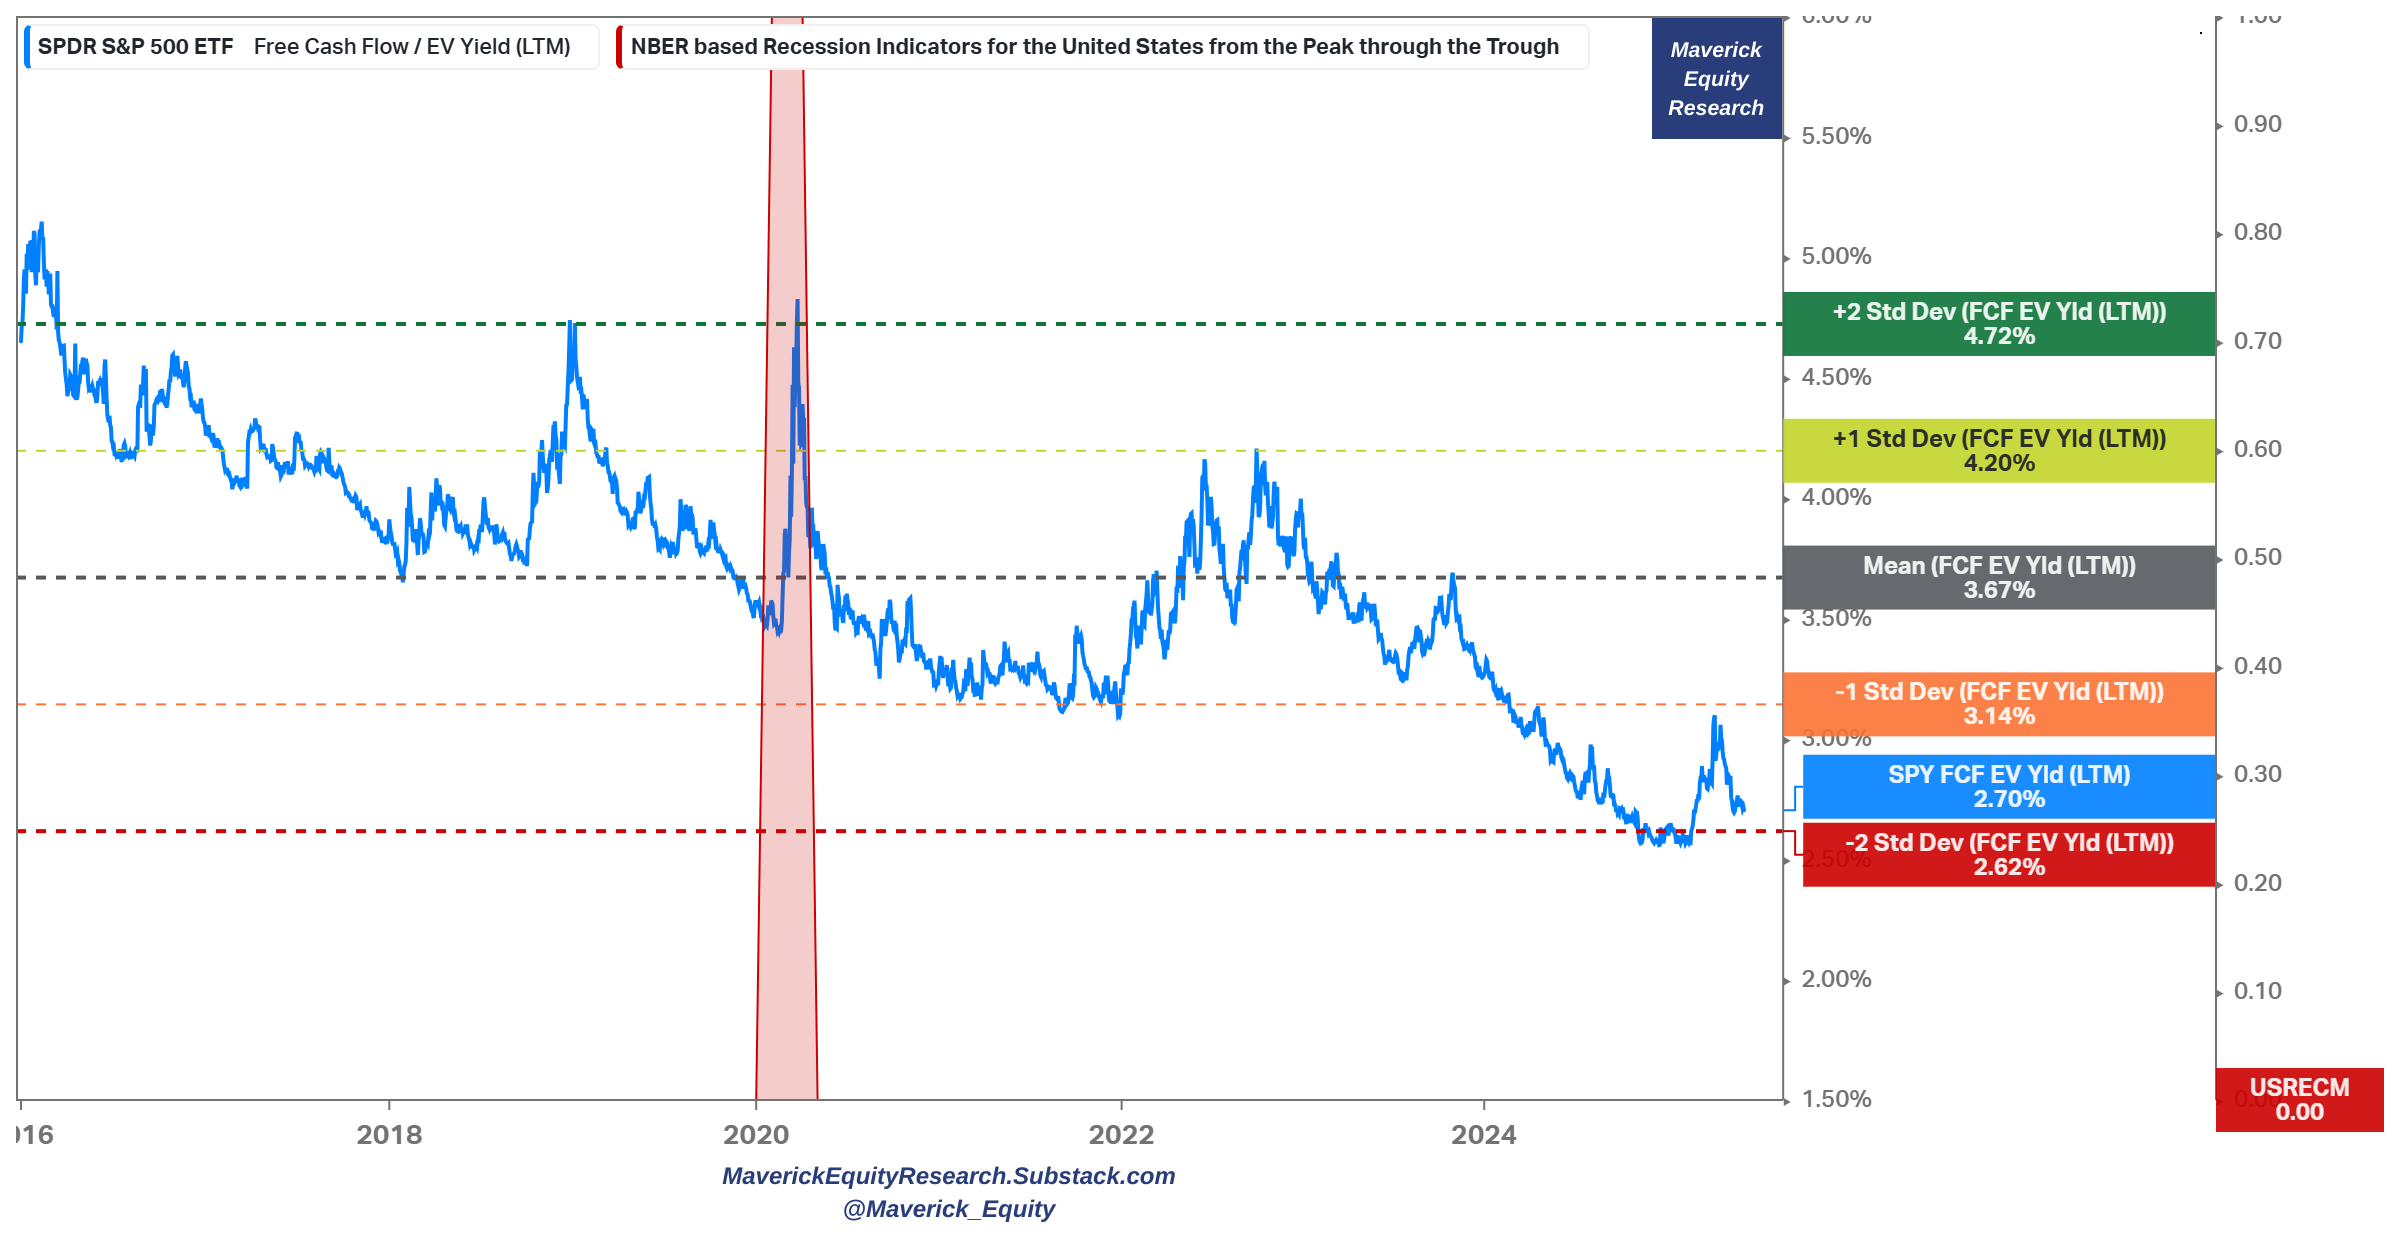
S&P 500 valuation via Free Cash Flow (FCF) yield - 2 more Maverick-esque charts for 10,000 words that you rarely see elsewhere! Framework = 'Buy High, Sell Low'!
FCF yield at 2.70% (Enterprise Value basis/denominator)
👉 given the recent rally and very close to the all-time highs, back very close to the -2 Standard Deviation (SD) at 2.62%
👉 quite some to reach the -1 SD at 3.14%, let alone the 10-year average of 3.67%
Maverick’s approach:
I am never a buyer when below 3% FCF Yield and when very close to the -2 SD, let alone when it goes even below the -2 SD, the latter actually quite a strong signal to sell or hedge
I am a solid buyer when above 4% FCF yield, close or above the +1 SD, and even more solid when above +2 SD which occasionally happens: +1 SD in the 2022 bear market, +2 SD in 2020 Covid, 2018, 2016 …
context matters: it’s key to realise anytime what is moving the ratio - is it free cash flow (numerator) or the EV (denominator), and which is the stronger force
As always, patience + discipline are both the difficult parts, and the key in this ‘game’!
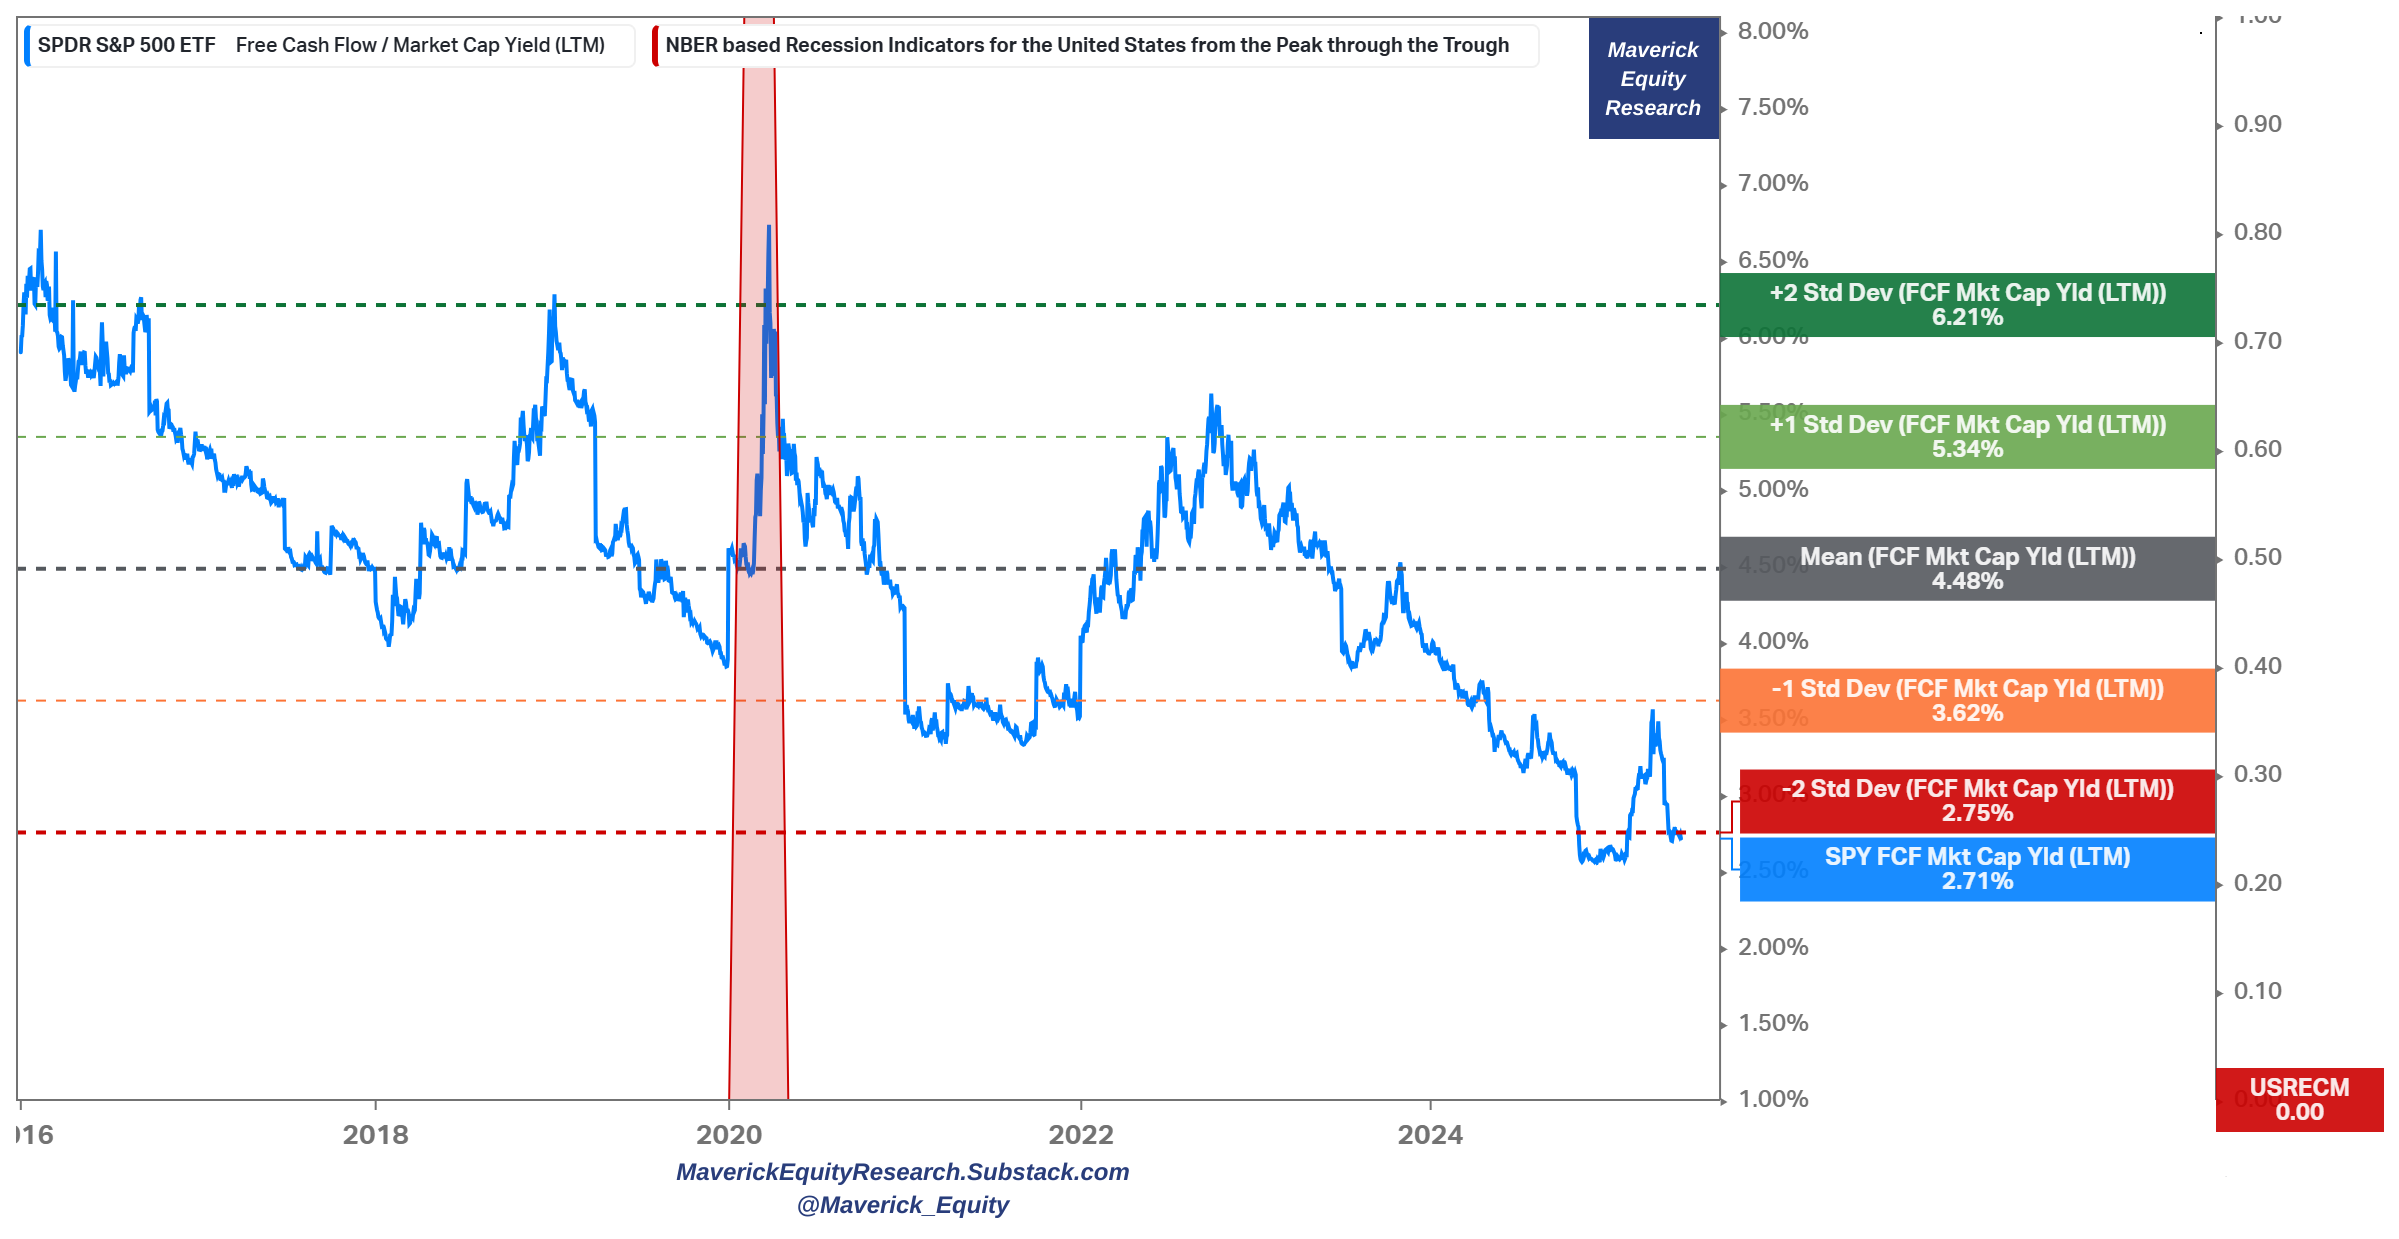
FCF yield at 2.71% (Market Capitalisation basis/denominator)
👉 given the recent rally and very close to the all-time highs, it dipped even below the -2 Standard Deviation (SD) at 2.75%
👉 quite some to reach the -1 SD at 3.62%, let alone the 10-year average of 4.48%
Maverick’s approach:
I am never a buyer when below 4% FCF Yield and when very close to the -2 SD, let alone when it goes even below the -2 SD like now, the latter actually quite a strong signal to sell or hedge
I am a solid buyer when above 5% FCF yield, close or above to the +1 SD, and even more solid when above the +2 SD which occasionally happens: +1 SD in the 2022 bear market, +2 SD in 2020 Covid, 2018, 2016 …
context matters: key to realise anytime what is moving the ratio - is it free cash flow (numerator) or market cap (denominator), which one is the stronger force
As always, patience + discipline are both the difficult parts, and the key in this ‘game’!
N.B. in 2025 my distinct S&P 500 comprehensive reports will get further improved, and this time materially with some special metrics you rarely see … stay tuned!
✍️ S&P 500 Report #6: Valuation, Fundamentals & Special Metrics
✍️ S&P 500 Report #6: Performance, Profitability, Sentiment & More
N.B. one can start to look at things similarly also for individual stocks and an overall portfolio made out of stocks - I will start covering single stocks going forward as well:
✍️ Full Equity Research - starting in 2015
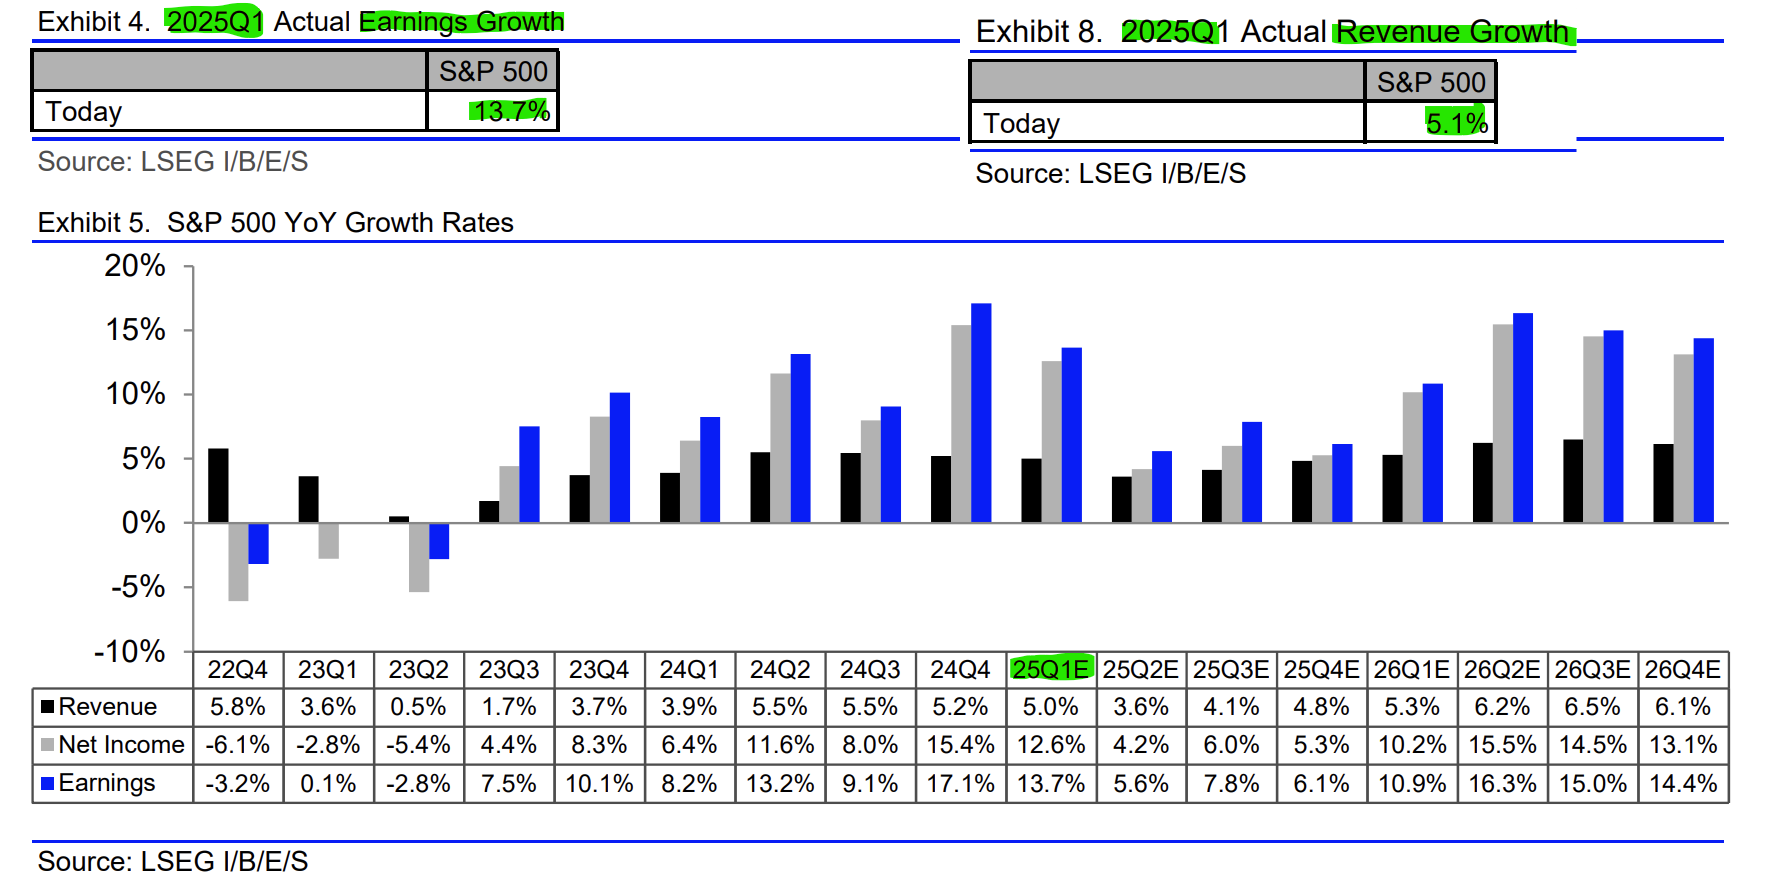
S&P 500 Q1 Earnings & Revenue growth scorecard (freshly updated, June 6th):
👉 earnings growth +13.7% (not bad ... at all ...)
👉 revenue growth +5.1% (not bad ... at all either ...)
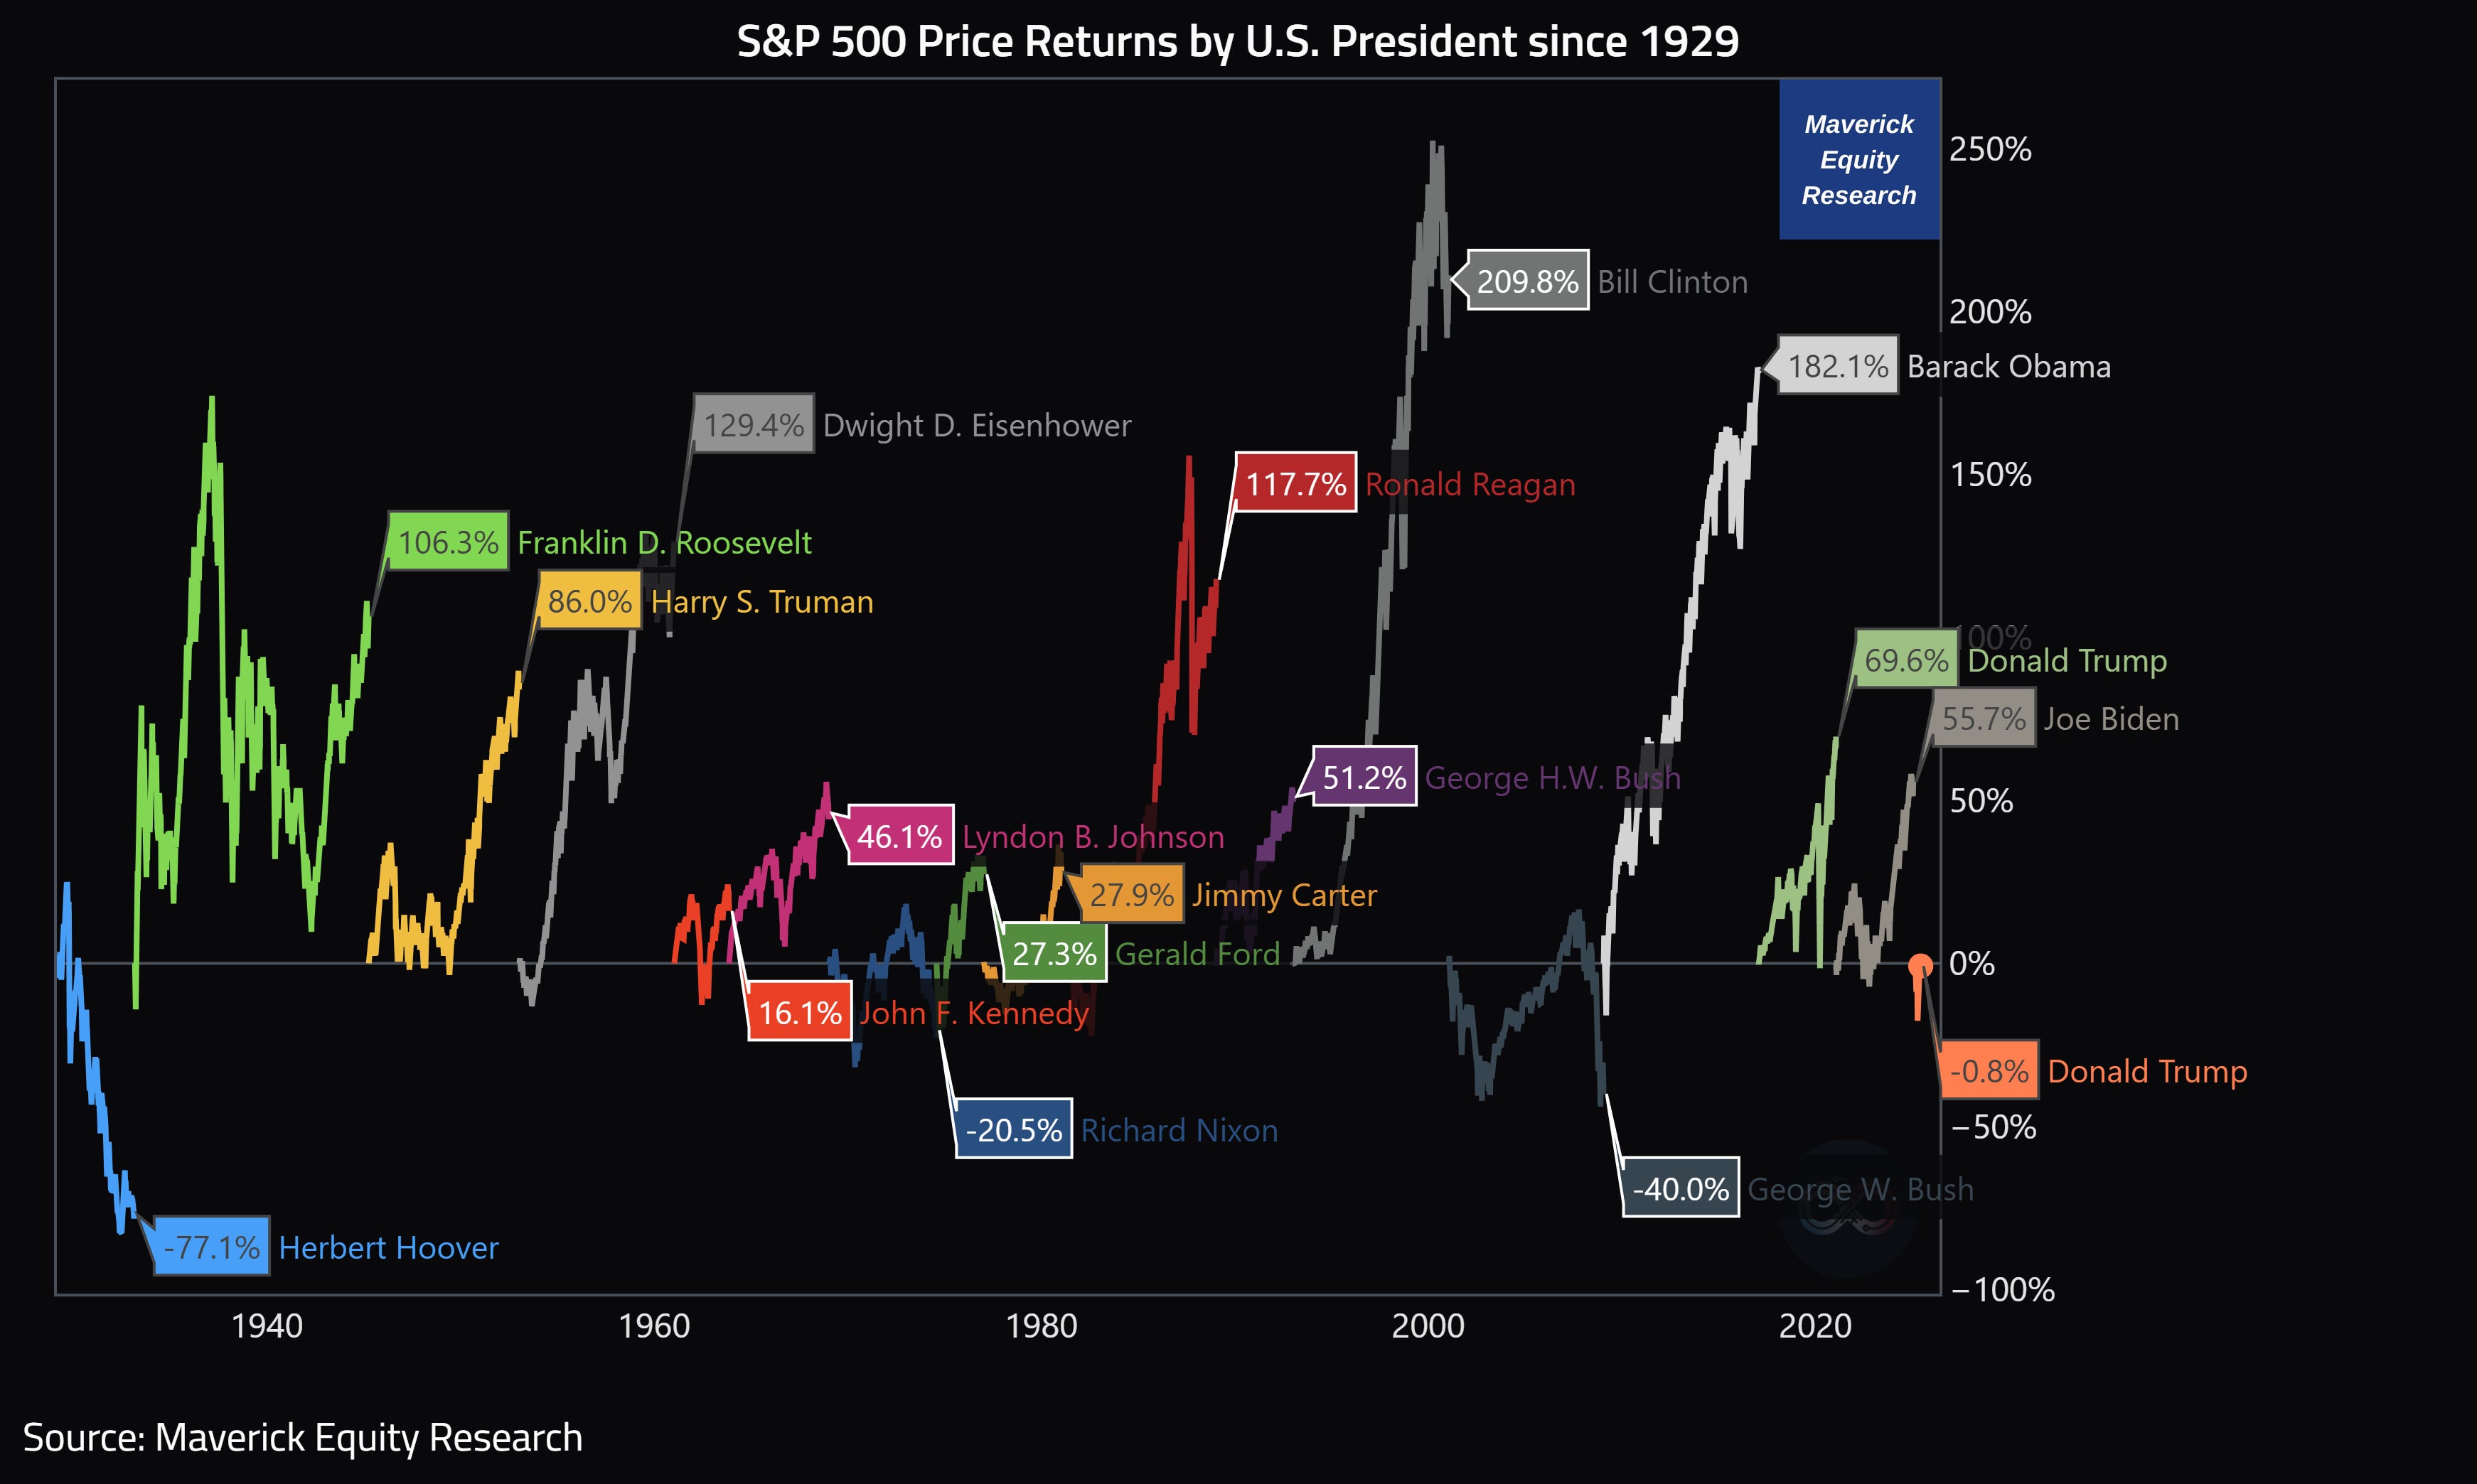
S&P 500 Price Returns by U.S. President since 1929:
👉 current POTUS with -0.8% recovering after a double digit fall once Trade War 2.0 started on the 5th of April via ‘Liberation Day’
Thoughts? In case you missed it, way more via my deeper dive on the matter, enjoy!
✍️ Maverick Special Report #3: U.S. Presidency - Does It Really & Deeply Matter?
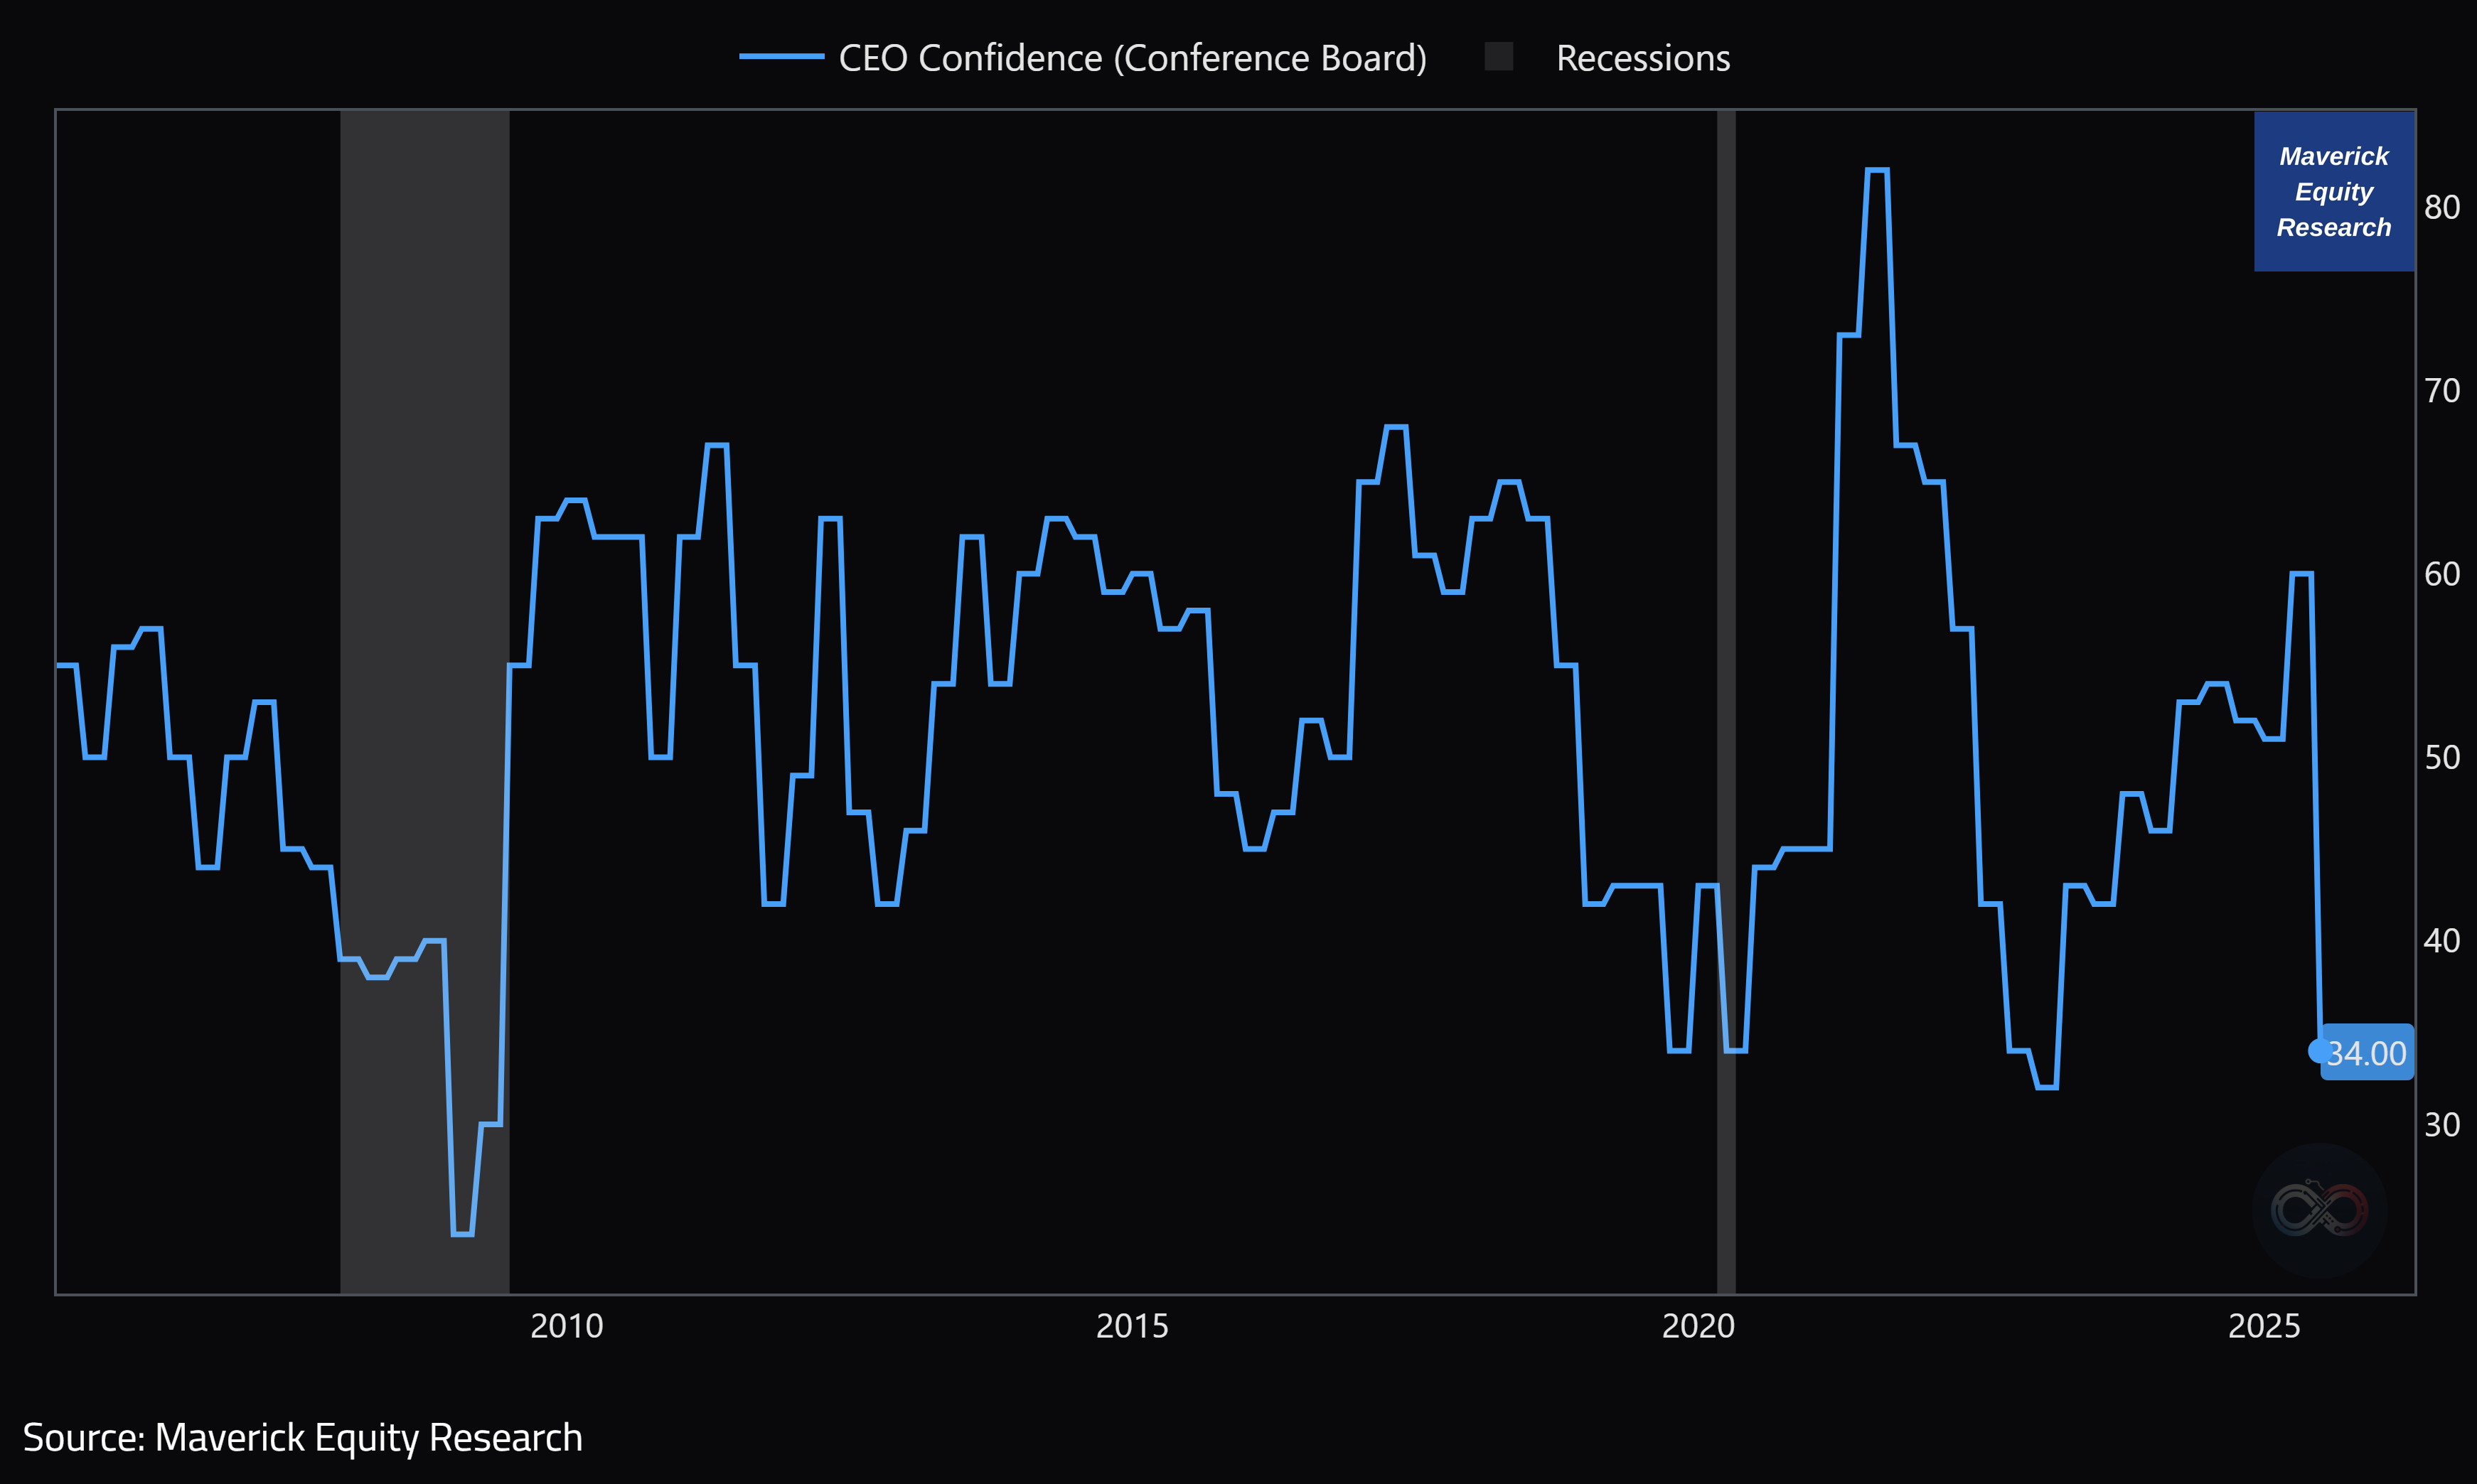
CEO Confidence (Conference Board - broad Corporate America) tanked to 34 which is at the same level as during the 2020 pandemic & in 2007-2009 territory.
Maverick’s take:
👉 they are over-reacting following too much POTUS trade war swings
👉 ‘under-promise, over-deliver’ = ‘lower guidance & achieve’ rarely a bad move for them
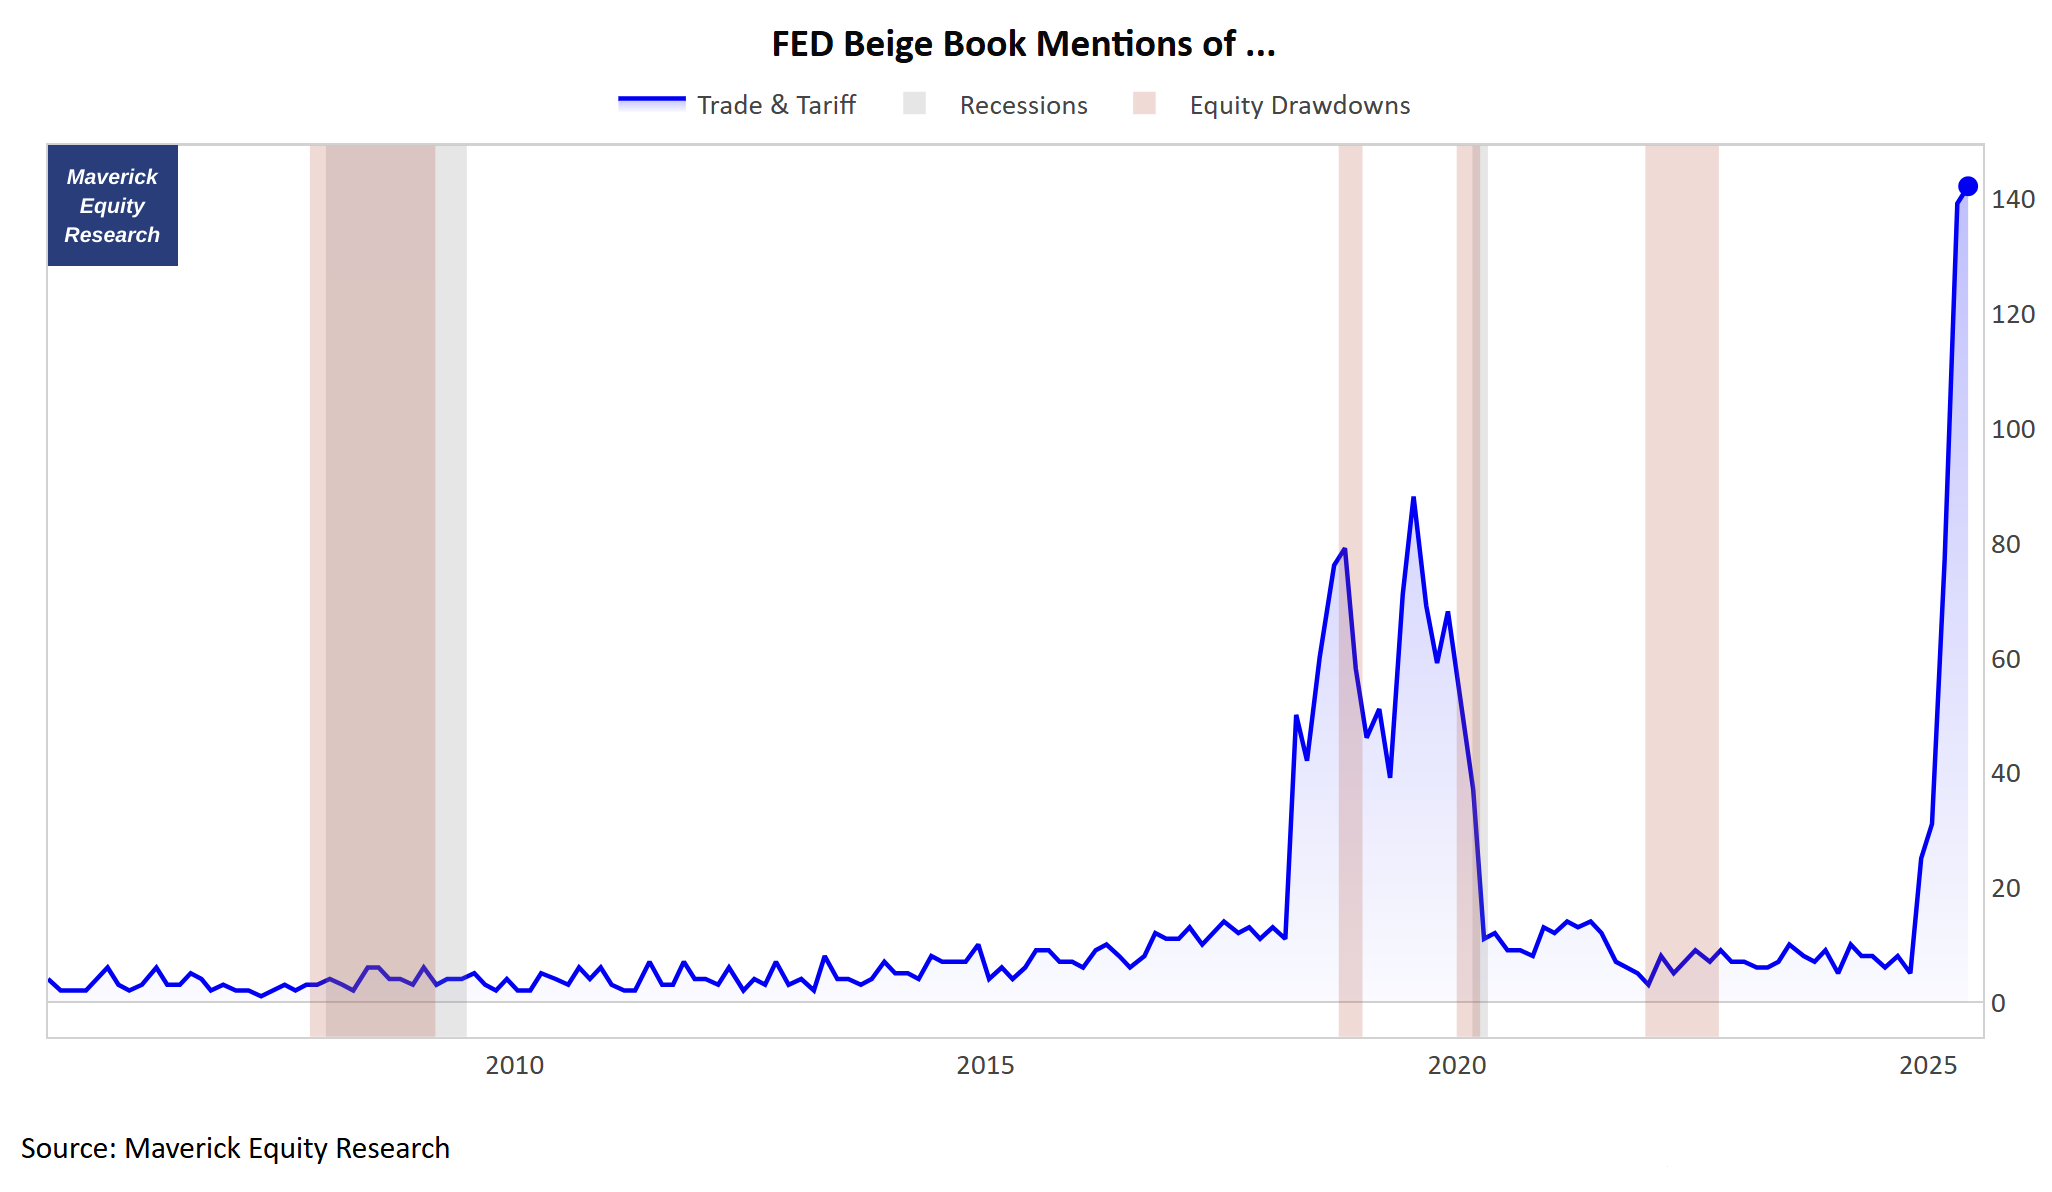
Complementary, FED Beige Book Mentions of ... “Trade“ & “Tariff“:
👉 through the roof with a record of 142, way more than the 79 & 88 from 2018-2019
S&P 500 earnings calls chatter sending the same vibes:
“tariffs” the main talk as expected - highest number of S&P 500 companies citing “tariffs” on earnings calls over past 10 years
2018 Trade War 1.0 looks small in comparison with 2025 Trade War 2.0, and that is because in 2018 it was mostly POTUS chatter unlike now

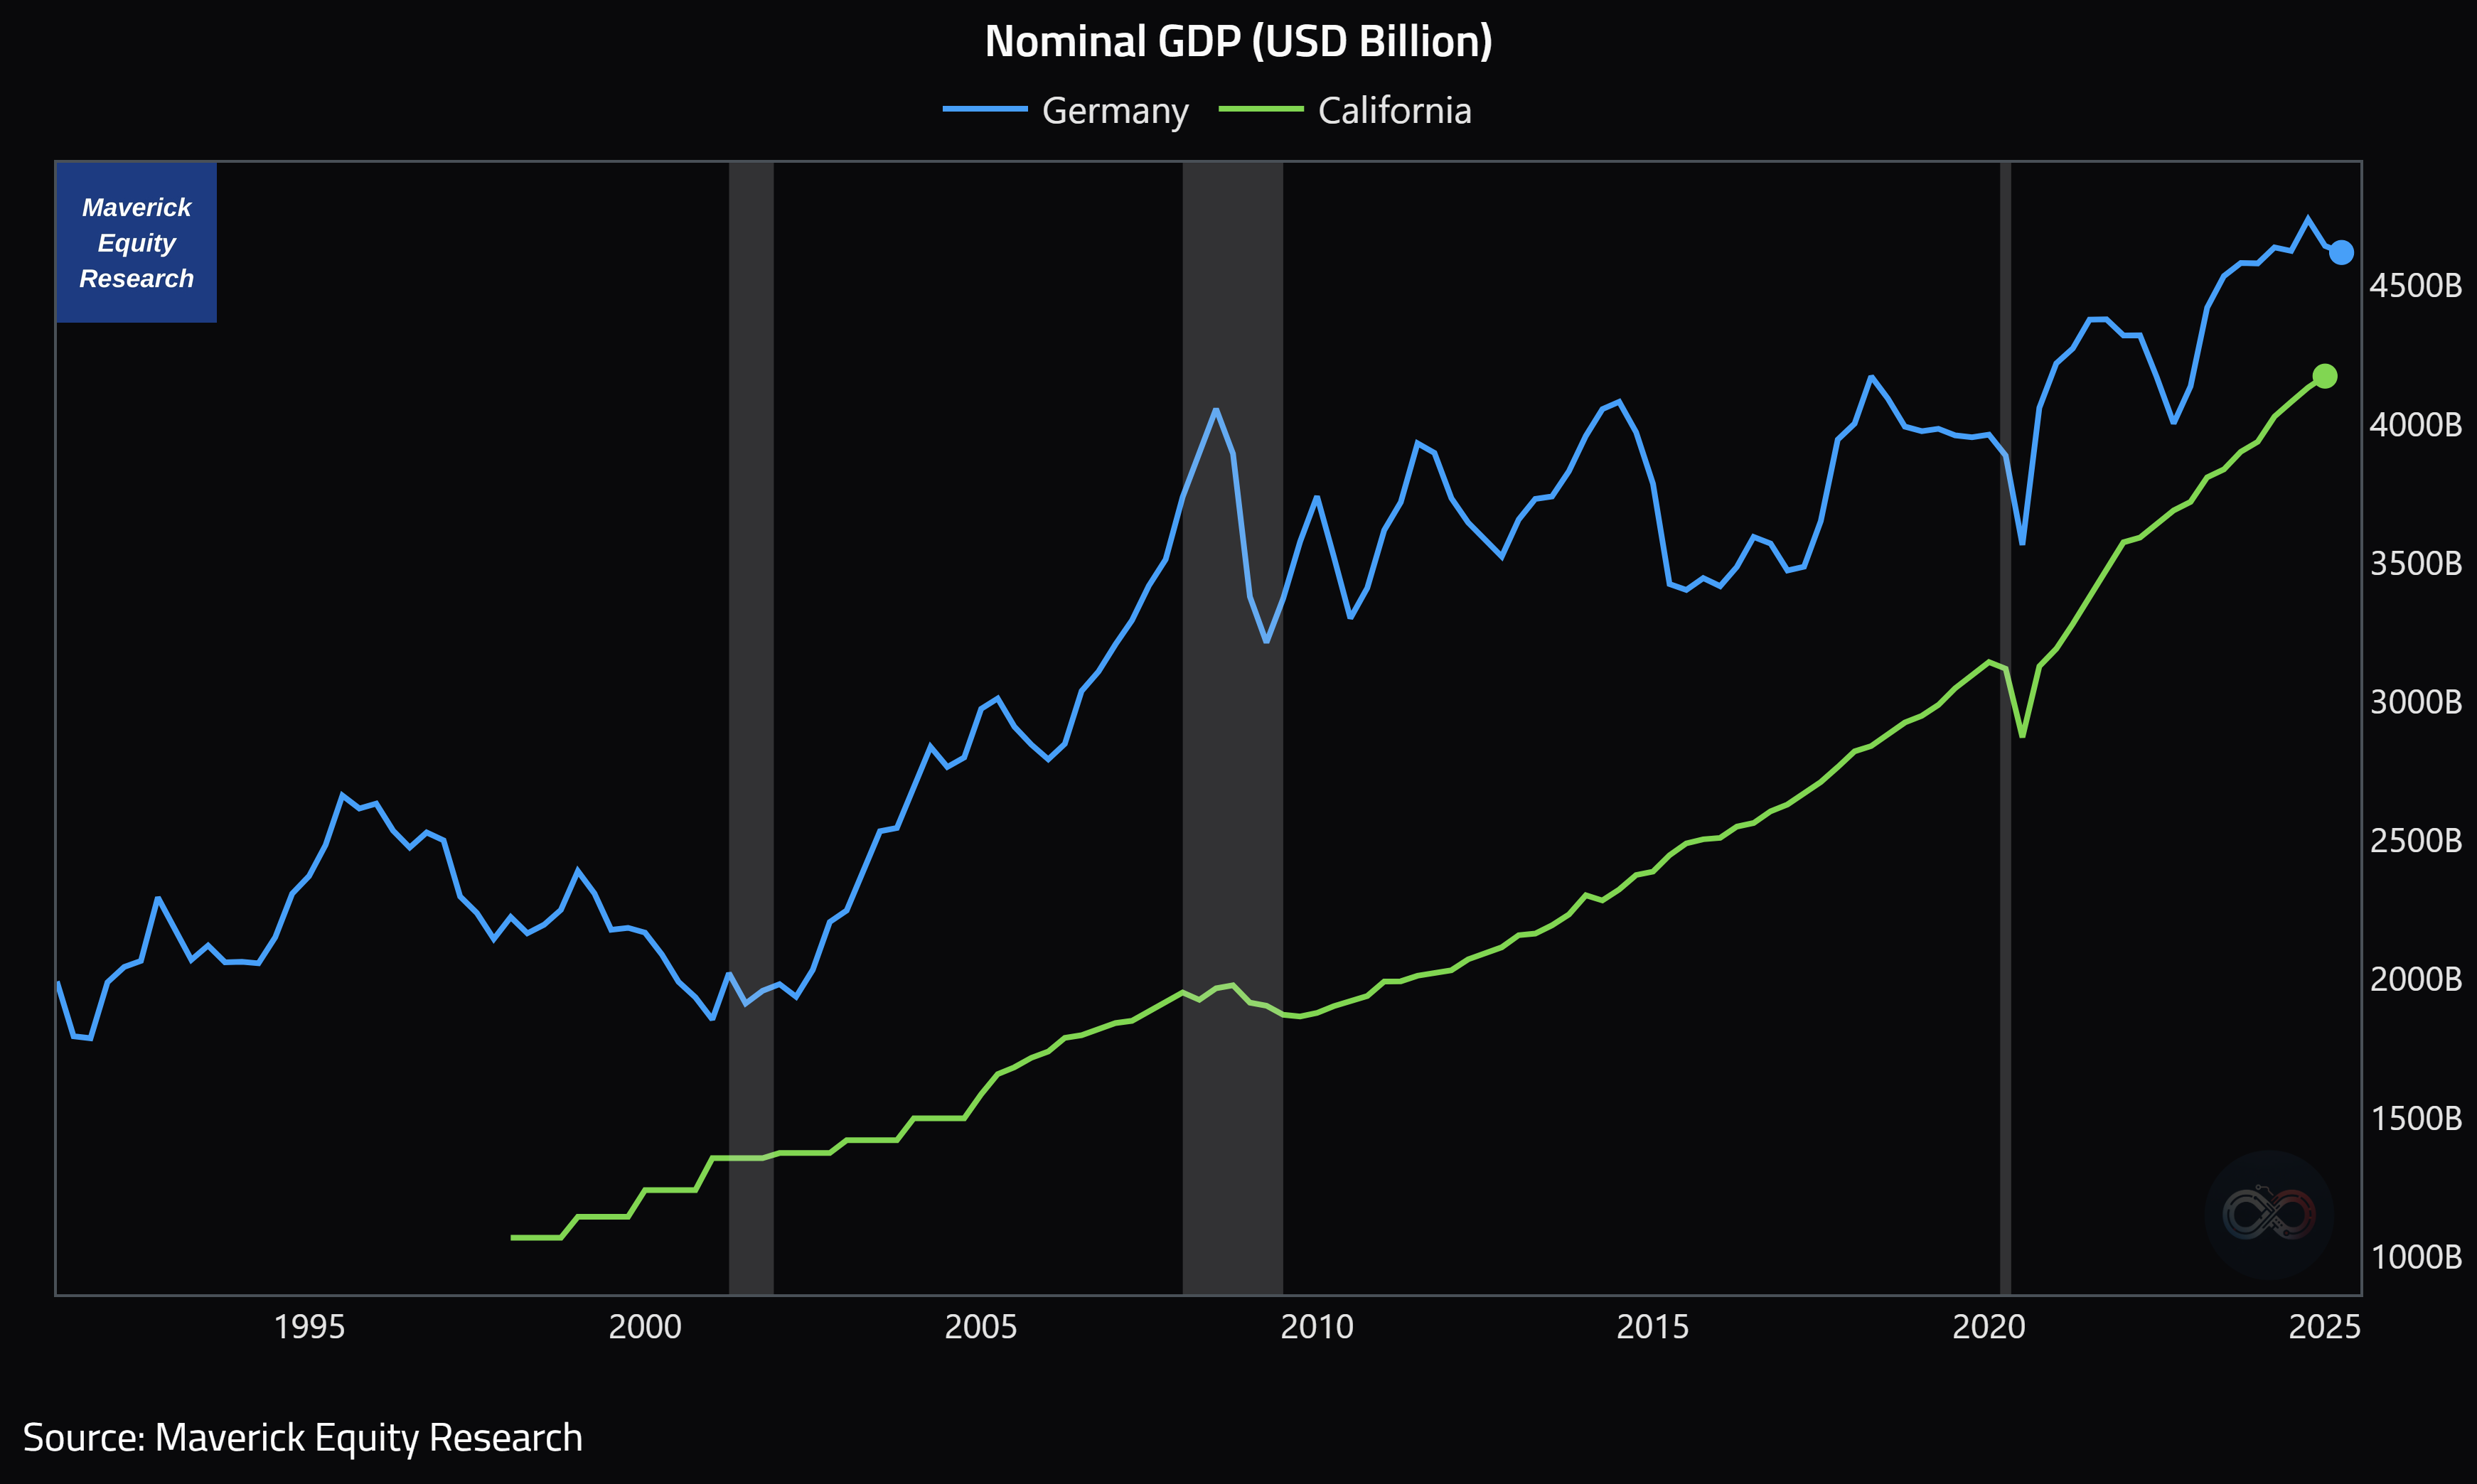
Fun Fact for a Fun Chart = Germany and California GDP (nominal):
👉 both trending up & up, yet notice that California soon matching Germany’s GDP which is the largest economy in Europe
📊 Bonus charts: The world’s most educated countries, Top 25 countries with the highest life expectancy, Global defense industry, Shadow economies & Robo-taxis 📊
The World’s Most Educated Countries:

Top 25 Countries With the Highest Life Expectancy:

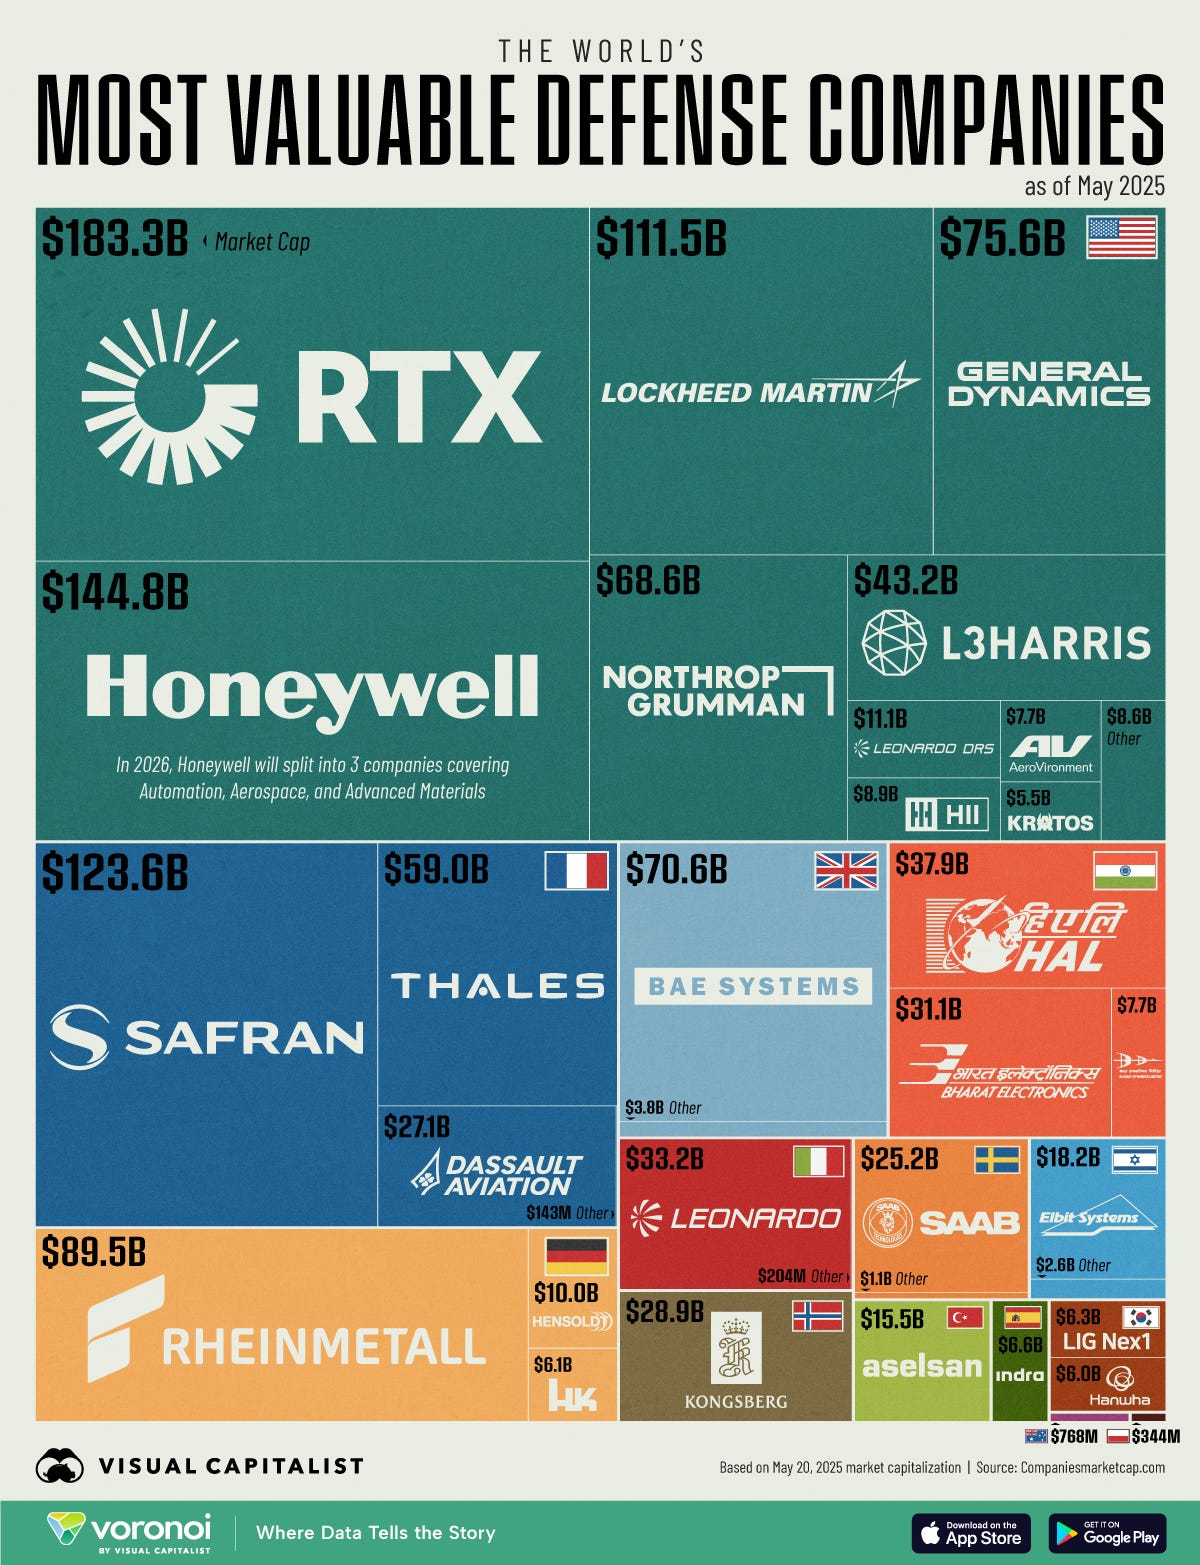
Global Defense Industry in One Chart (public defense companies by market cap):
👉 16 are located in the U.S., while 17 are based in Europe
👉 U.S. companies account for over half of the total market cap: $743 billion vs. $1.3 trillion, a byproduct of having the world’s largest military budget
👉 Top 3: RTX (RTHX) #1, Honeywell (HON) #2, Safran (EPA: SAF) #3
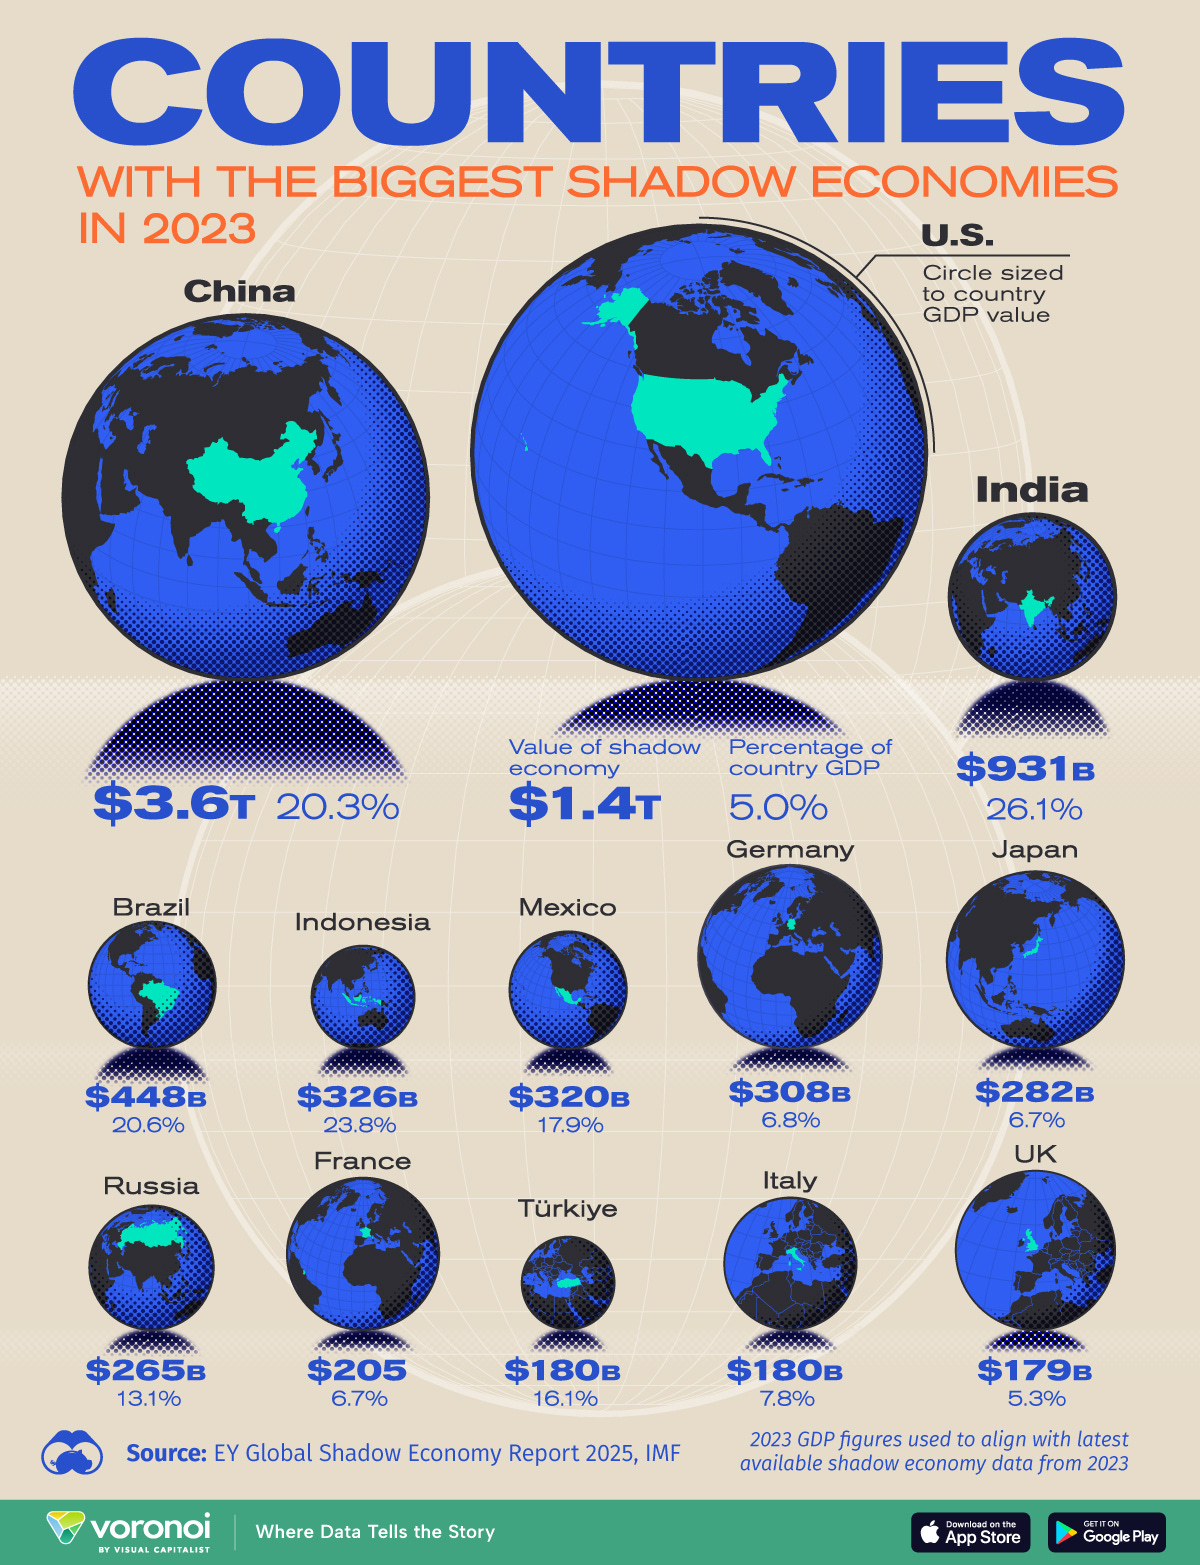
The World’s Biggest Shadow Economies - $12.5 trillion informal economy covers nearly every corner of the world (highest concentration in emerging economies):
👉 China #1: estimated to have the largest informal economy in the world, $3.6 trillion
👉 U.S. #2: although it represents just 5% of GDP, the U.S. has the world’s second-largest shadow economy, estimated at $1.4 trillion
👉 India #3: a shadow economy valued at $931 billion
Robotaxis are incoming strongly in China:
👉 expected to soar to almost 2 million within the next decade - a massive increase from the current 4,100 according to Goldman Sachs: “We see robotaxis as one of the earliest and most visible avenues to commercialization of the autonomous technology”
👉 by 2035, Robotaxis could make up a quarter of China's shared mobility fleet, with ride-hailing comprising 58% and regular taxis another 17%
👉 technological advancements likely to improve riding experience & decrease cost: each Robotaxi could generate an estimated $69 per day by 2035, compared to an average of $28 to $56 a day for each ride-hailing vehicle driven by humans

Research is NOT behind a paywall and NO pesky ads here unlike most other places!
Did you enjoy this by finding it interesting, saving you time and getting valuable insights? What would be appreciated?
Just sharing this around with like-minded people, and hitting the 🔄 & ❤️ buttons! That’ll definitely support bringing in more & more independent investment research: from a single individual … not a corporate, bank, fund, click-baity media or so … !
Like this, the big positive externalities become the name of the game! Thank you!
Have a great day! And never forget, keep compounding: family, friends, hobbies, community, work, independence, capital, knowledge, research and mindset!
With respect,
Mav 👋 🤝

Loving the deep dive into margins and valuations—definitely some food for thought for my next move. Thanks for sharing the insights
Thank you!