


✍️ Maverick Charts of the Week #7: U.S. Economy, Tariffs, Households, Sentiment, Interest Rate Cuts, S&P 500 + Gold
10 Maverick charts that say 10,000 words + incoming Maverick-esque research

Dear all,
10 charts of the week with both data-driven insights + food for thought!
Table of contents:
📊 U.S. Economy, Tariffs, Households, Sentiment, Interest Rate Cuts, S&P 500, Gold
📊 Incoming Maverick-esque research!
Enjoy!
📊 U.S. Economy, Tariffs, Households, Sentiment, Interest Rate Cuts, S&P 500, Gold
U.S. Recessions by Year of the Presidential Election Cycle (1926 To Date):
👉 0 recessions pre-election
👉 5 election
👉 3 mid-term
👉 8 post-election ... food for thought ...

Key question: will 2025 as the post election bring in a recession? For detailed insights:
✍️ The State of the US Economy in 75 Charts, Edition #4 is work in progress currently
my comprehensive U.S. economy breakdown, and coming up with further improved coverage charts + recession probability metrics & models
data driven insights delivered via Maverick sleek visuals that say 10,000 words ...
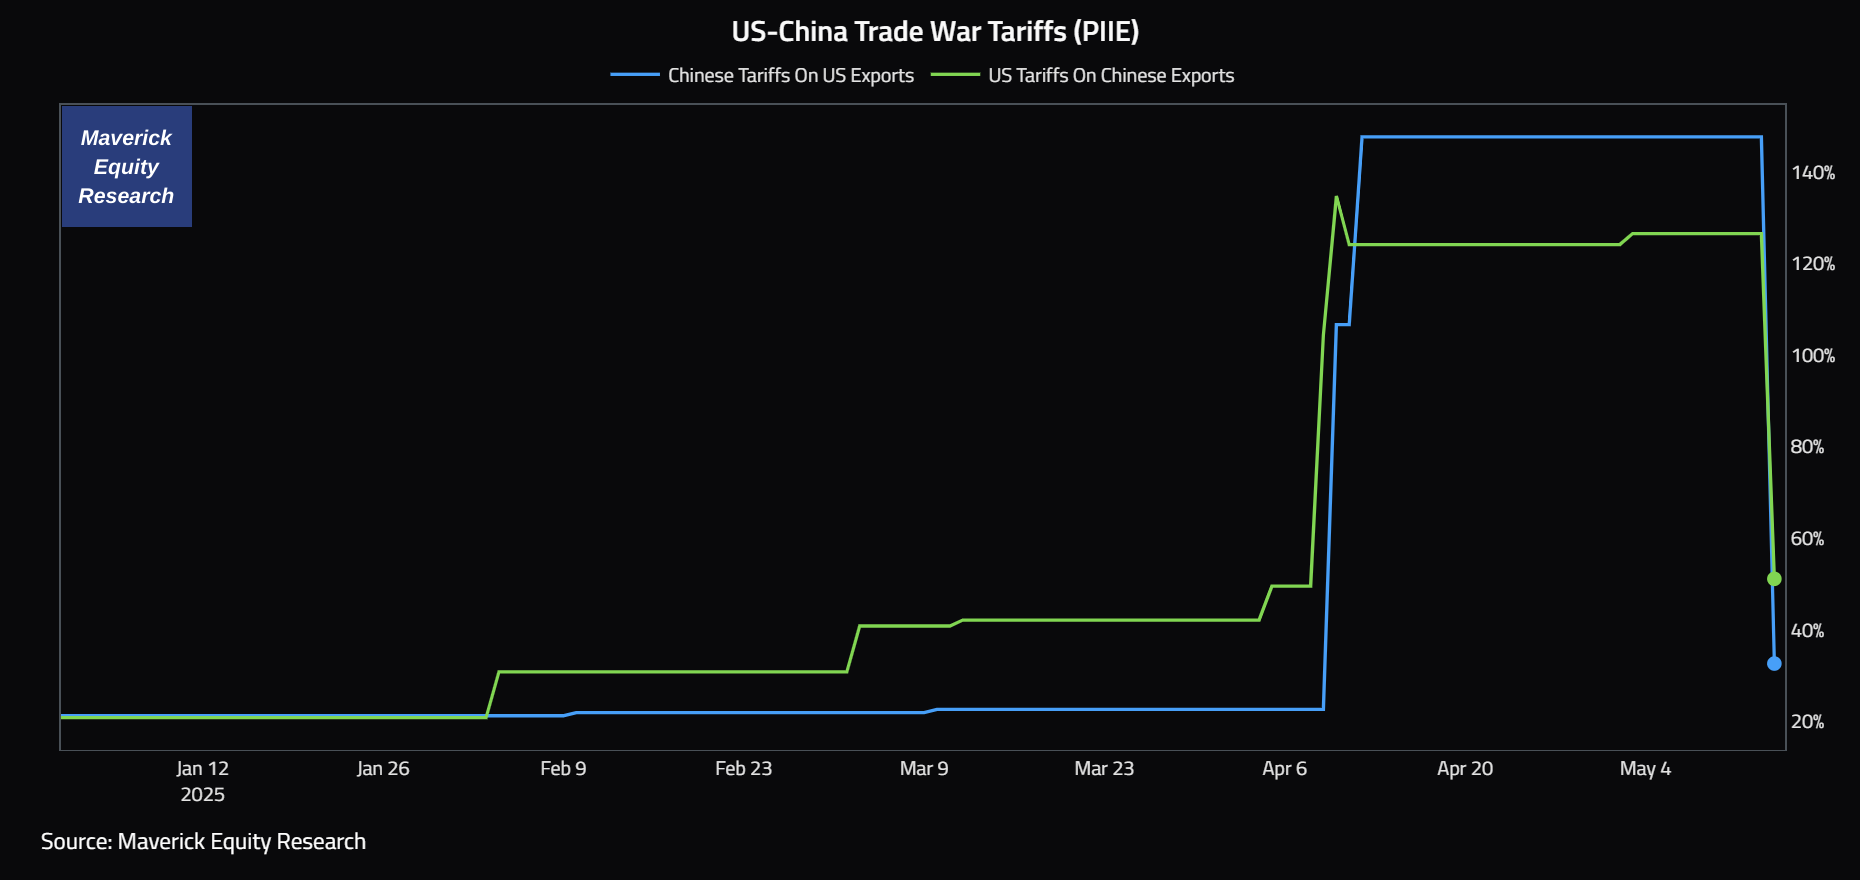
US-China Trade War Tariffs (PIIE):
👉 parabolic up, parabolic down … as I foresaw and tweeted about on April 5th (just 3 days after Liberation Tariff day)
👉 ‘I mean at some point Trump will have to negotiate…’ … ‘…In any case, for me a good period to collect / harvest geopolitical risk premium’ which is basically a great way to improve medium-long term returns …
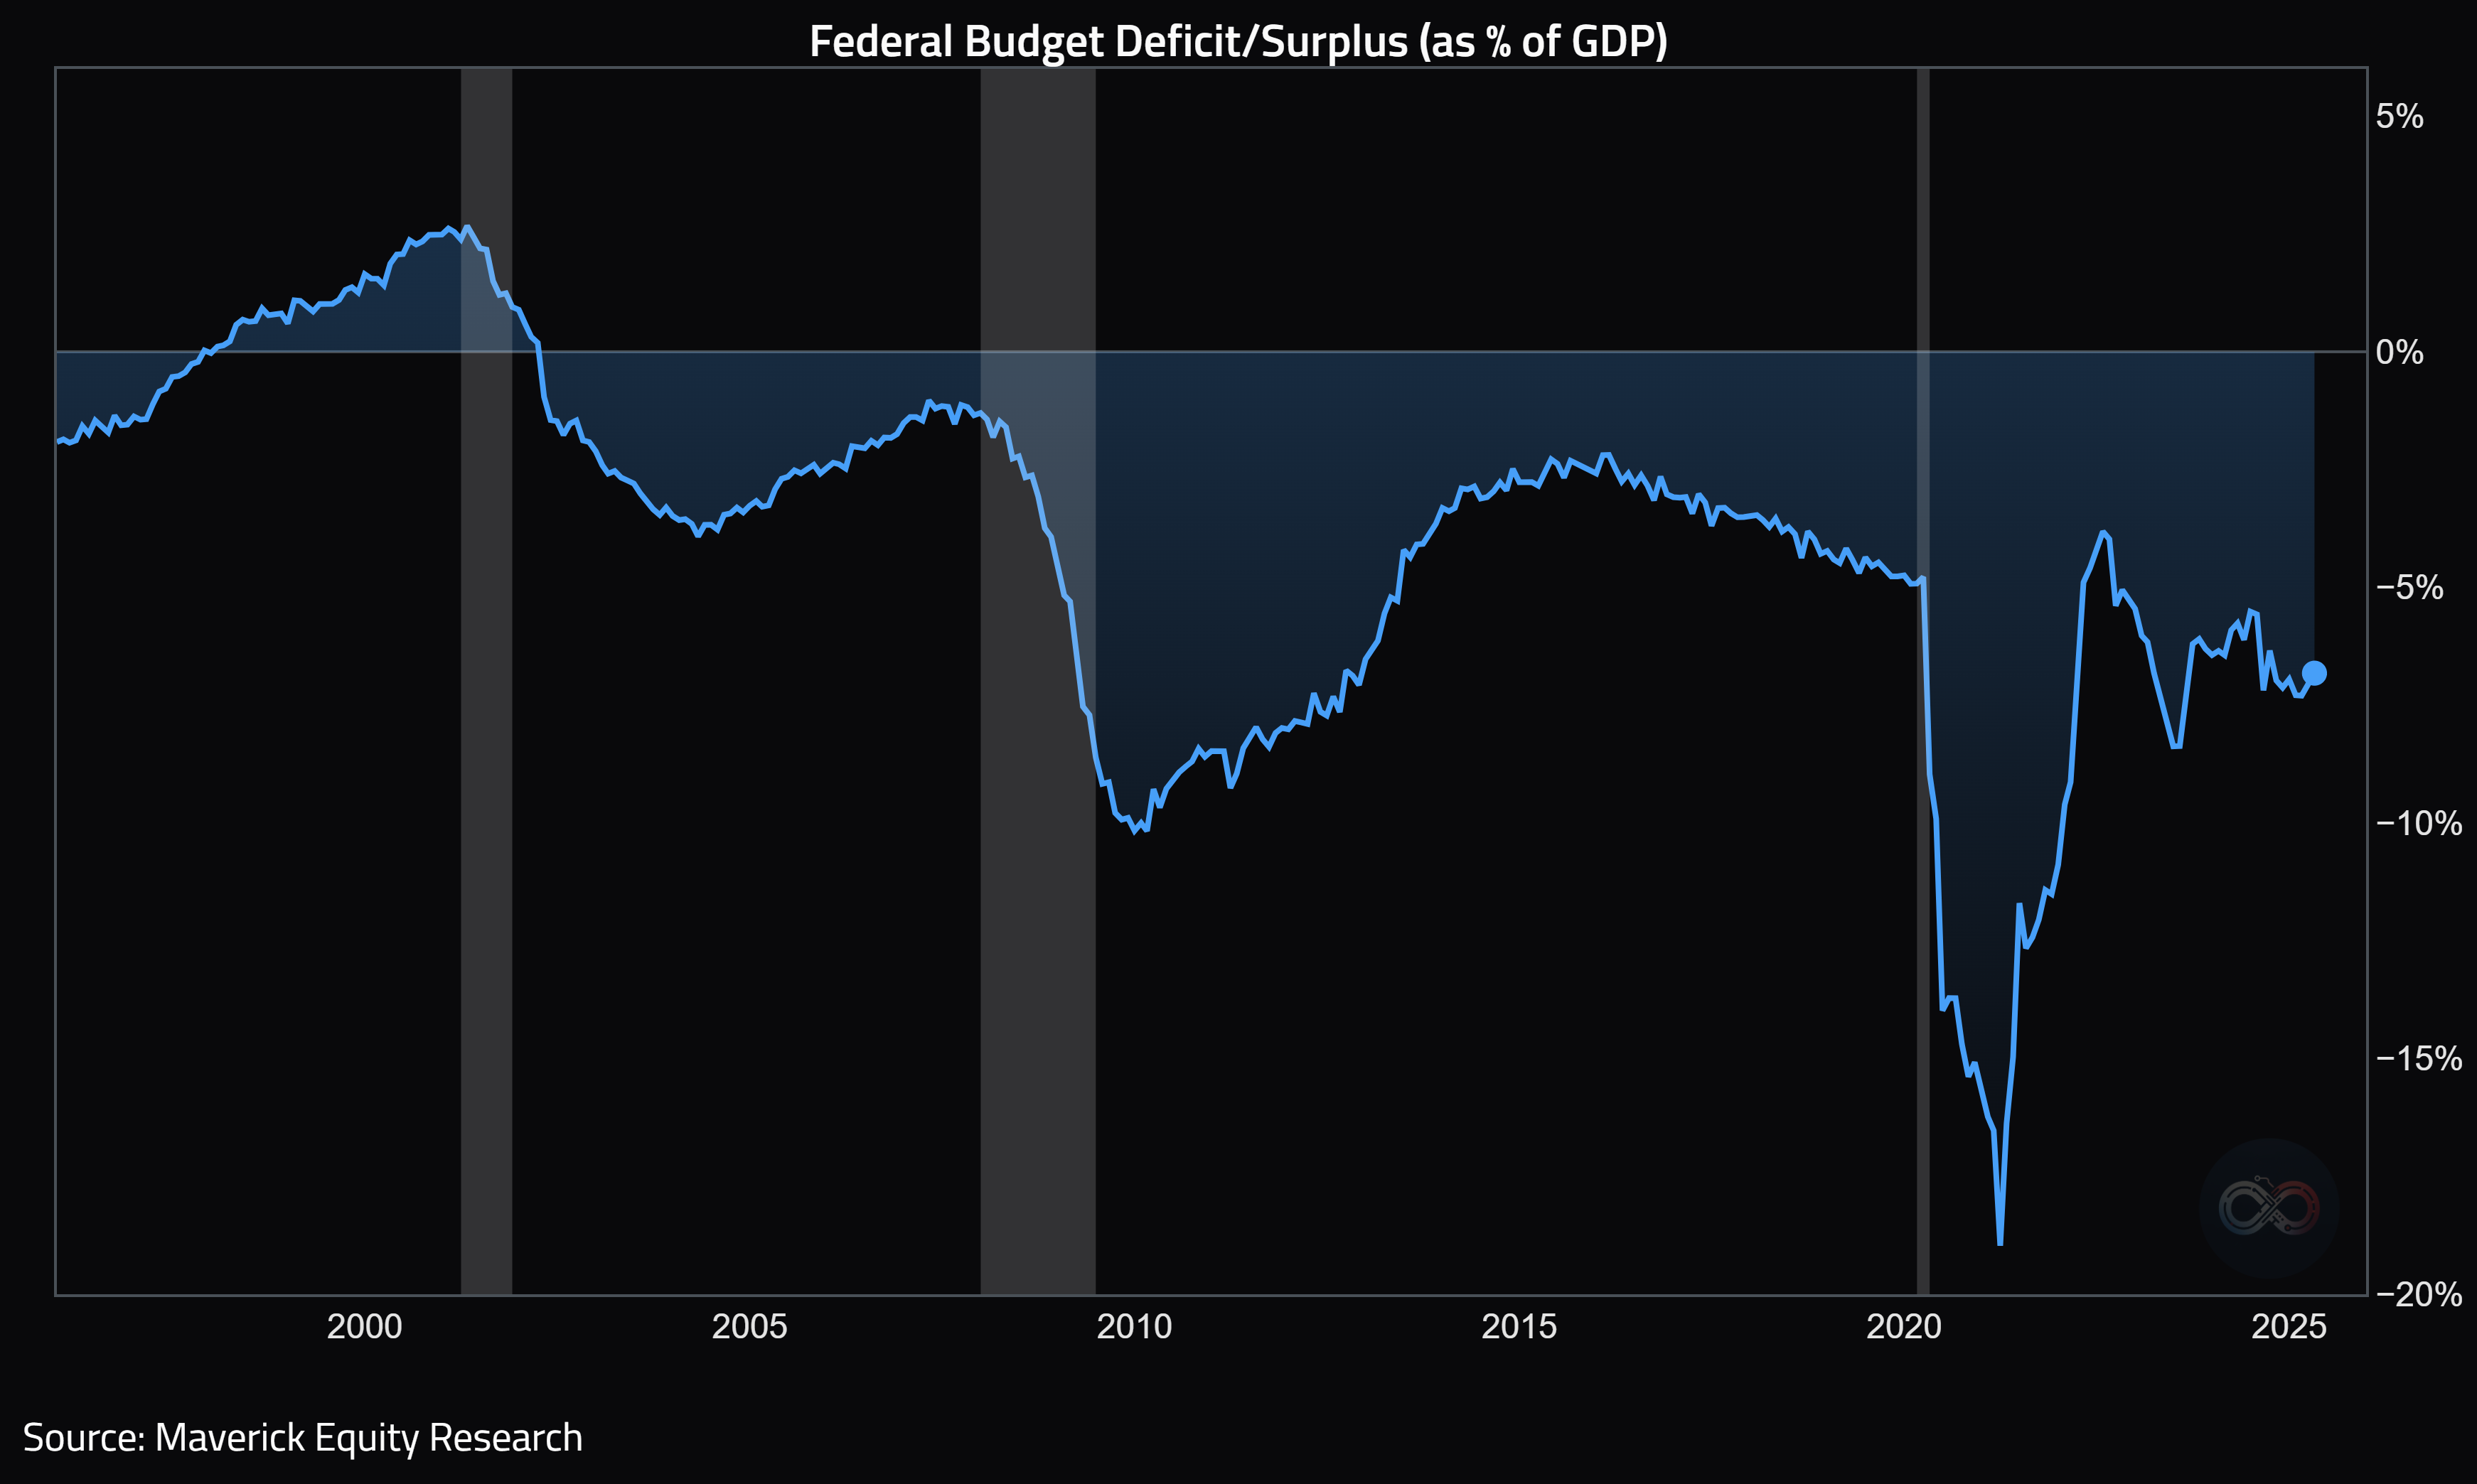
U.S. budget deficit/surplus as % of GDP since 1995:
👉 at -6.8% currently, quite a value … context: the Covid fiscal stimulus made the end of 2021 at -19%, while getting out of 2007-2009 GFC we had it at -10%
👉 last time when U.S. had a budget surplus was in 2002 … quite a long time ago …
In case you missed my recent and very complementary related research:
✍️ Maverick Special Report #6: U.S. Public Debt Reduction = Hard but Feasible
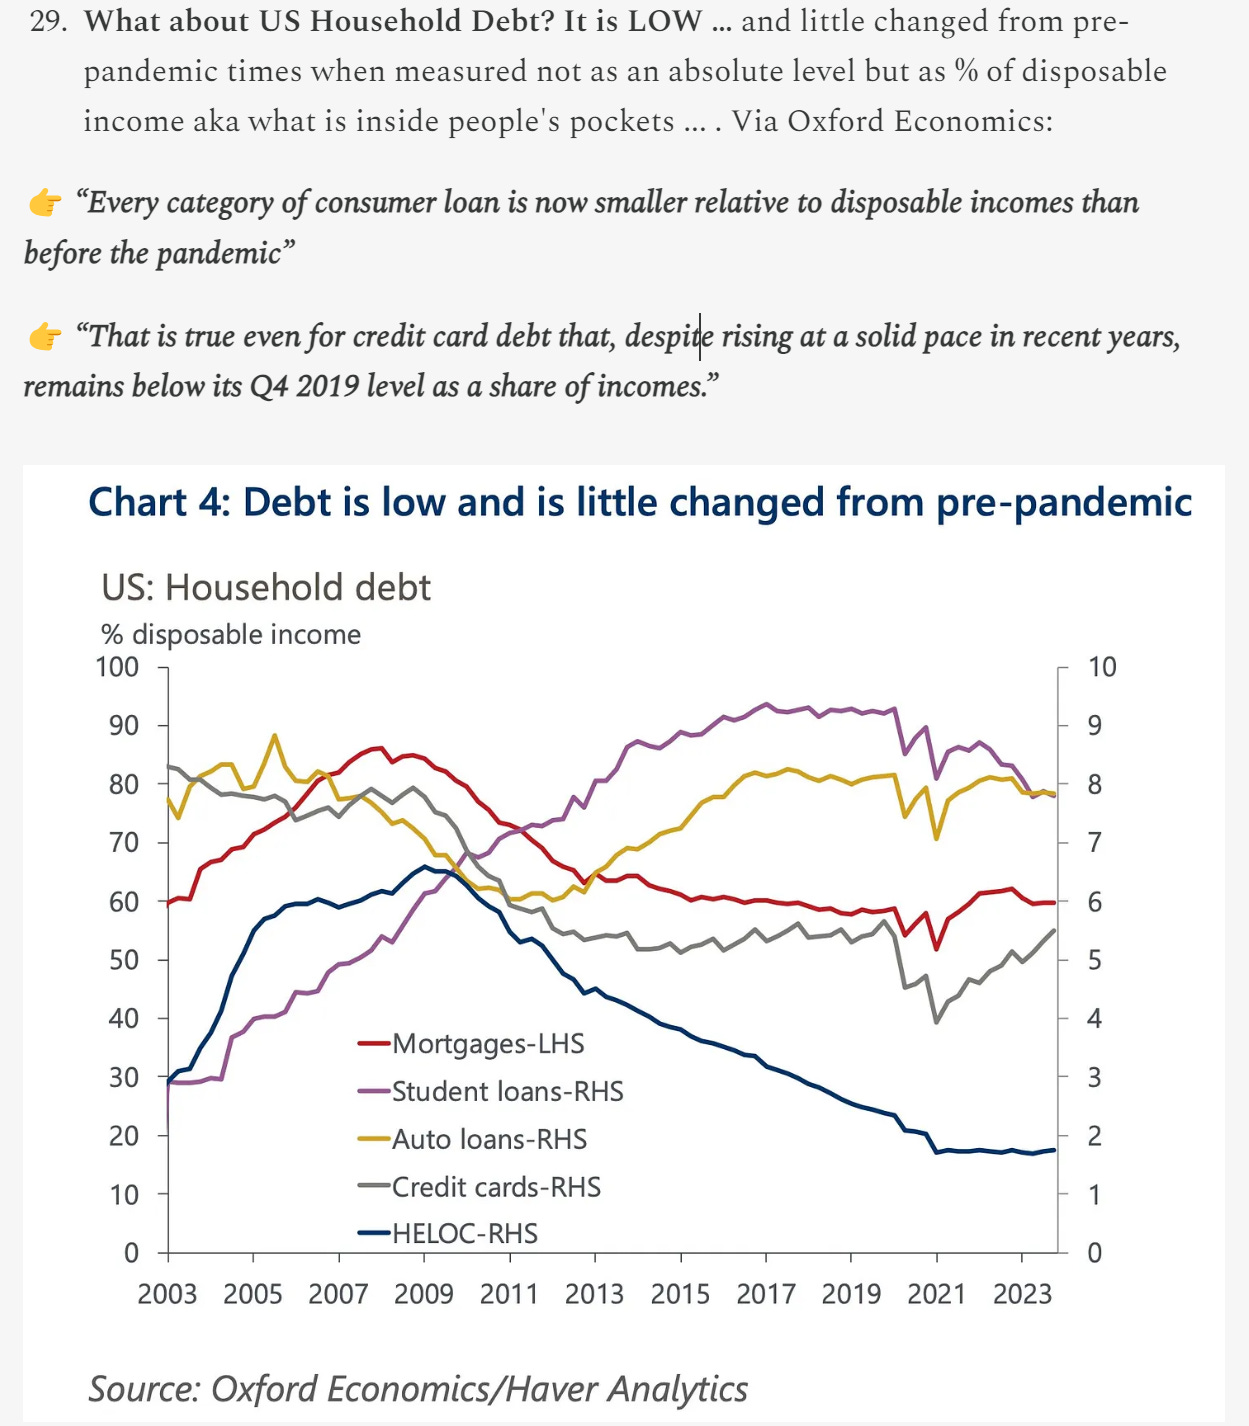
4 & 5. U.S. Household Debt since 2003:
👉 Total household debt trending up: $167 billion more to $18.2 trillion in Q1 2025

👉 but when we do that chart as % of disposable income, it is way way less worrisome
👉 via my U.S. economy report ✍️ The State of the US Economy in 75 Charts, Edition #3, check the chart & take from below (I’ll update the chart/numbers with the next report)
U.S. Consumer Sentiment via the University of Michigan monthly survey: 50.8 in May 2025, down from 52.2 in April & well below market expectations of 53.4
👉 Maverick’s take = this is not rather overblown but rather way overblown given:
at 50.8 we are BELOW 2007-2009 Global Financial Crisis levels, 1980 recession, 1981-1982 recession and 2022 when consensus was for a recession, and inflation came to town and started to bite strongly into the consumer’s pockets
as always: gloomy, polarisation & clickbait headlines, an over-negative influence
👉 Maverick’s takeaway = current fundamentals (GDP growth, earnings, unemployment, wage growth etc) are nowhere near those previous very hard and challenging environments

Interest Rate Cuts in 2025:
👉 both the FED and the market pricing are currently aligned: 2 rate cuts in 2025

8 & 9. S&P 500 earnings calls chatter:
👉 “Uncertainty” - the mighty word with the highest number of S&P 500 companies citing it since 2020 Covid times
👉 Maverick’s take = rather overblown as from my experience working with high level folks, also a way for management to lower expectations, lower bonus levels … so that they reach the bonus targets … ‘in such a difficult environment … we managed to …’
👉 under-promise and over-deliver is rarely a bad approach …

👉 as expected with high uncertainty chatter, also recession chatter is up big time: highest “recession” citations on earnings calls since 2022 …

Gold (yellow) and Real Yields (green, inverted) with their longstanding inverse relationship disconnected materially since 2022
higher real yields made gold less attractive since gold pays no interest, leading to lower gold prices, and the other way around
however, since 2022, gold prices have remained resilient and even reached record highs despite rising real yields
‘What’s the rationale Maverick?’ A confluence of factors buddy:
👉 geopolitical, both real ongoing issues & uncertainty: Russia-Ukraine war, related freezing of Russia's foreign assets by Western countries ... and more
👉 central banks with record purchases for diversification and safe-haven demand
👉 inflation came to town after many decades: gold as a hedge thesis
👉 currency debasement and fiscal policy (debt & deficits): gold as a hedge thesis
👉 China demand: both consumer and institutional demand surged with Chinese gold market premiums soaring, hence reflecting strong local appetite

Bonus gold chart:
👉 central bank and institutional demand for gold: their purchases have been the primary factor driving up gold prices in recent years

📊 Incoming Maverick-esque research! 📊
What is coming next through the independent investment & economic research here? Many drafts are work in progress - below a few selected ones:
✍️ Full Equity Research
section start where I will cover in details single businesses/stocks aka deep dives
✍️ Why Independent Investment and Economic Research = Paramount Nowadays!
common sense is not so common, independent research for the win!
✍️ The State of the US Economy in 75 Charts, Edition #4
coming up with further improved coverage charts + recession probability metrics
✍️ Maverick Special Situation #7
how to hedge, lock in the gain or speculate on a very popular stock nowadays
✍️ S&P 500 Report #6: Valuation, Fundamentals & Special Metrics
coming up with further improved metrics via sleek Maverick charts as always
✍️ Maverick Special Report #7: Big Volatility & Drawdowns = Juicy Returns
the price for high returns = digesting and taking advantage of volatility
✍️ Maverick Special Report #8: U.S. Manufacturing = A Bad Wet & Fake Dream
manufacturing is romantic, but not realistic for good reasons for the U.S.
✍️ Maverick Special Report #7: Harvesting Geopolitical Risk Premium Through The 2025 Trade War
taking advantage of the ‘Trade War 2.0’ which drives volatility these days
✍️ Top 50 Maverick Charts to Watch in 2025 and Beyond
sleek Maverick charts with many insights & food for thought for now & the future
Research is NOT behind a paywall and NO pesky ads here unlike most other places!
Did you enjoy this by finding it interesting, saving you time and getting valuable insights? What would be appreciated?
Just sharing this around with like-minded people, and hitting the 🔄 & ❤️ buttons! That’ll definitely support bringing in more & more independent investment research: from a single individual … not a corporate, bank, fund, click-baity media or so … !
Like this, the big positive externalities become the name of the game! Thank you!
Have a great day! And never forget, keep compounding: family, friends, hobbies, community, work, independence, capital, knowledge, research and mindset!
Mav 👋 🤝

Absolutely love your work! On Gold/Real Yields I think it’s no coincidence that you can trace back the divergence to Russia sanctions and reserve confiscation. And then see acceleration at Miran’s Mar a Lago accord and Hudson speech. If central banker think reserve investment vehicle could be garnished or termed out to zero coupons at will, why would I hold? All other reasons you cite are factors for sure, but at end of day Trust is a large component of value!