✍️Maverick Charts - Stocks & Bonds - June 2023 Edition #8
Apple, Tesla, Big Tech, S&P500 & Interest Rates & Volatility, Buybacks, Liquidity, Stocks & Bonds 2023 performance, SaaS, Small Caps, Stoxx 600 Europe Valuation
Dear all,
first of all, Happy 4th of July to all US folks, hope you had a good one! Cheers to that!
Maverick Equity Research is read across 46 US states & 103 countries worldwide! More independent research coming out ... just got started not a long time ago and almost 2,000 people enjoy & read the publication!
In case you did not subscribe yet for delivery straight to your inbox, it’s just 1-click. And the same goes to share this around with whom might be interested as well. Enjoy!
Here we go with Top 15 Stocks & Bonds charts from around the world + 5 Bonus!
Apple crossed for the first time the $3 trillion market capitalisation mark! Let that sink in! In case you missed it, my latest Apple dive with great charts is here: Apple (AAPL) - The Big Apple = The Most Valuable Company on Planet Earth
Apple is the 1st company to reach in value the following milestones:
$1 trillion in 2018
$2 trillion in 2020
$3 trillion in 2023 now
is $4 trillion possible? Your thoughts?
N.B. Microsoft, Google, Amazon & Nvidia the other trillion 5 club members ...
The Big 7 US Tech stocks via Price/Sales multiple: the big outlier is the mighty Nvidia … let that sink in!
Fun fact on stocks via the S&P 500 (green) and the US FED interest rates (red):
FED embarked last year in the fastest interest rates hiking cycle in 4 decades, yet stocks are + 6.64% since then
we went from 0% to 5%+ interest rates, stocks had a max 17% correction in 2022
Main take-away: stocks as a (natural) hedge to interest rates! Not the first time!
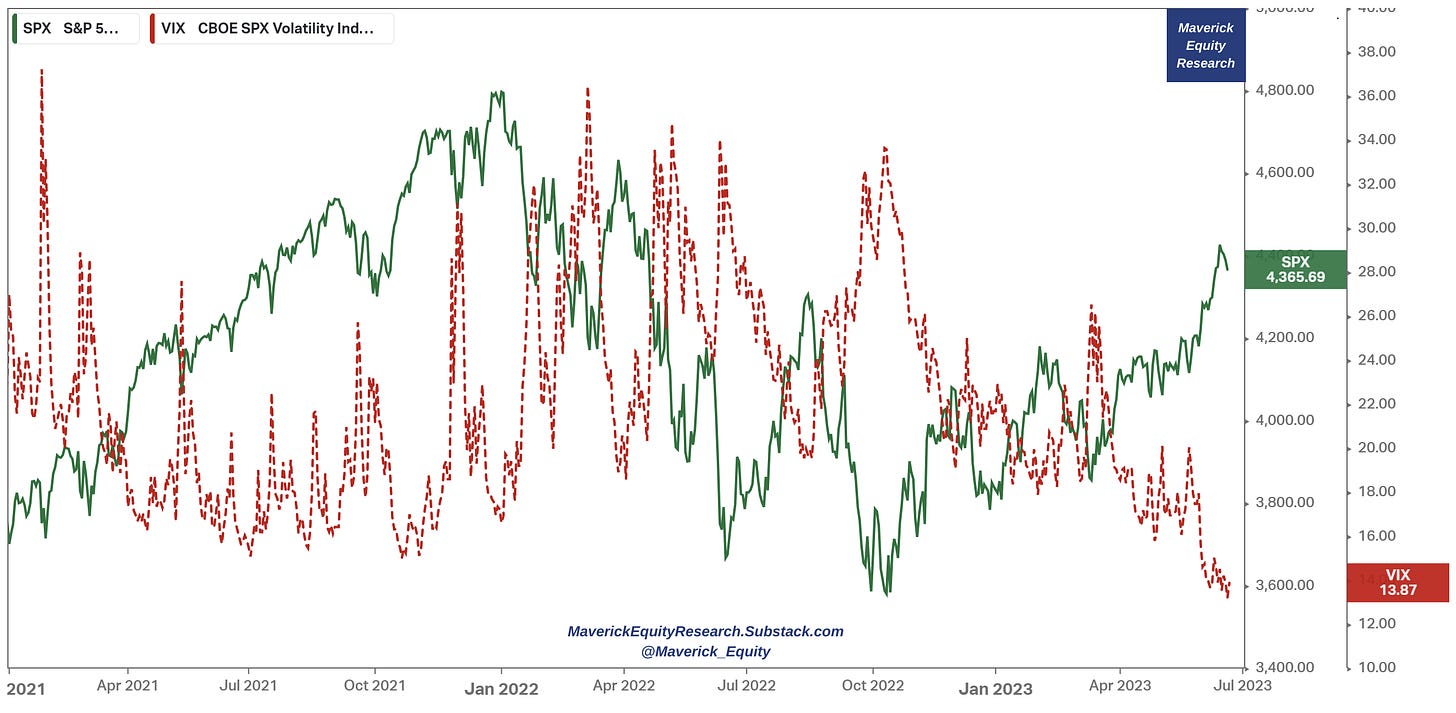
Note also S&P 500 index (green) and Volatility via the VIX index (red):
stock market resilience caused the VIX (major indicator of market uncertainty) to fall to its lowest level in more than 3 years (since January 2020) & well below its 19.6 average since 1990
it’s not just the US stocks riding the rally and low volatility, but market momentum is felt also also by the French & German ones that hit record highs in 2023 are while Japanese ones reached a 33-year pean in June
Stocks & Bonds 2023 performance:
👉 S&P 500 (SPY) with a new bull market, +17% in 2023 alone
👉 TLT (US long term gov bonds 20-year+ maturities) +4.13%
👉 AGG (US investment grade: treasuries, corporate, MBS, ABS, munis) +2.14%
👉 SHV (1-year or less maturities, cash proxy) +2.25%
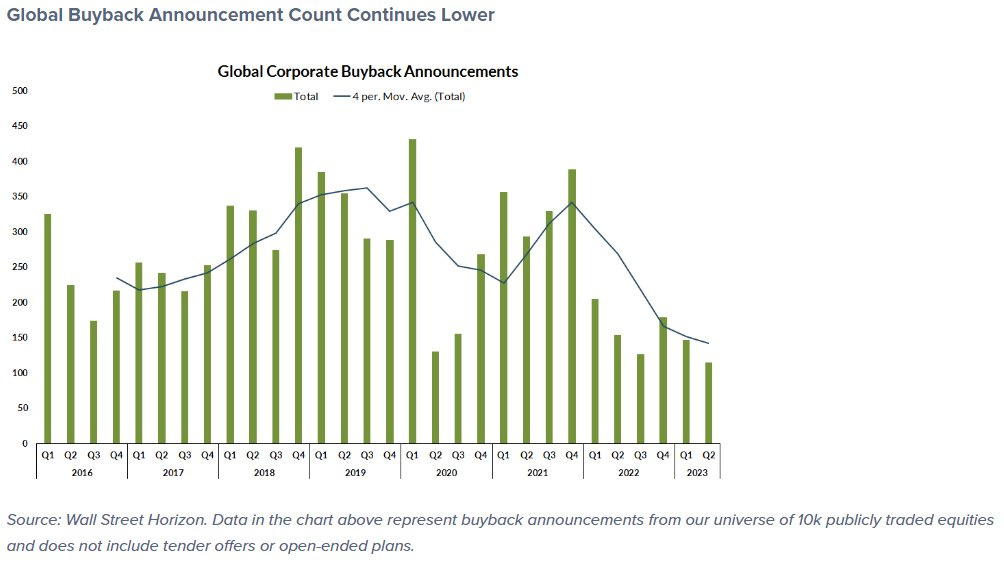
Stock buybacks, global view:
First quarter of 2020 was the all-time high, Covid crash was a great opportunity to buy cheap basically
Currently, share repurchase plans are modest
USA: among the 11 S&P 500 sectors, just two are responsible for the bulk of notional buybacks: Communication Services $XLC and Information Technology dominate $KLK
Background: Fed’s zero-interest rate policy drew many corporate executives to reduce equity financing in lieu of relatively cheap deb ... during such times, shifting the capital structure more towards debt can actually increase total firm value ... while these days the opposite given high rates ...
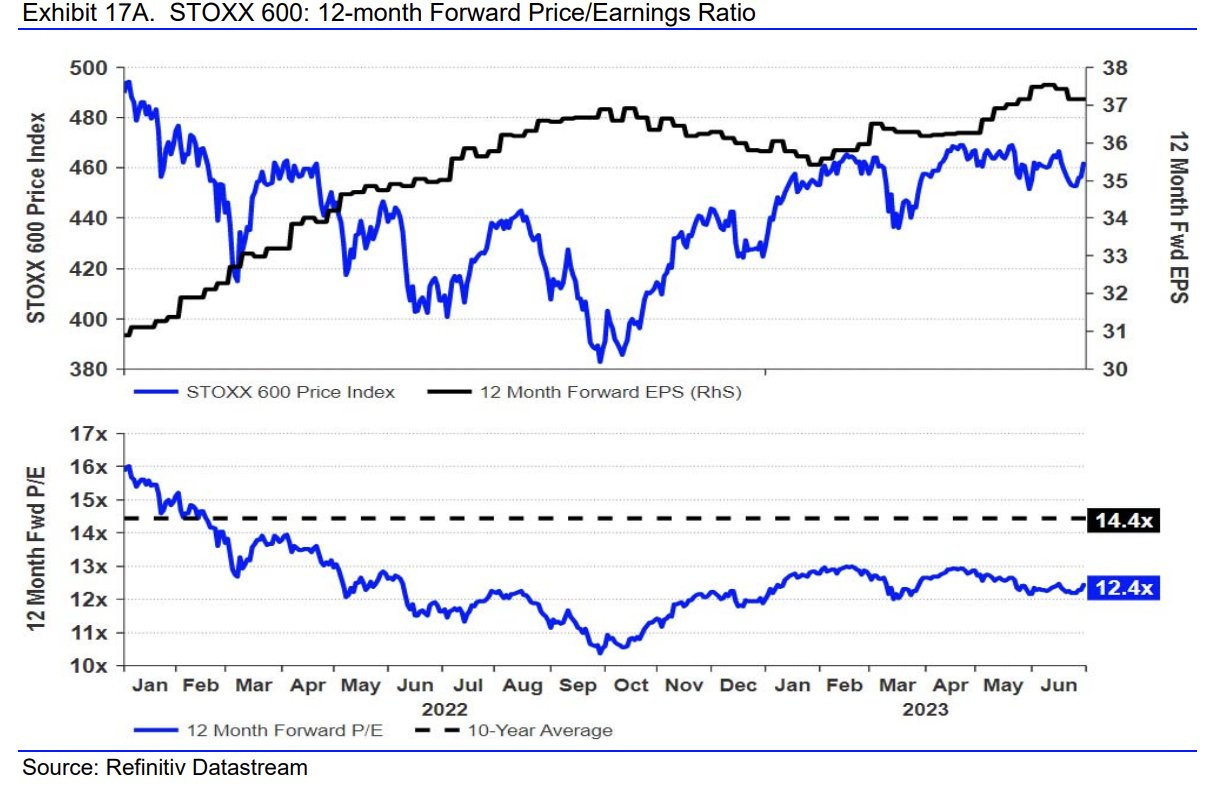
STOXX 600 Europe (S&P 500 US equivalent):
Price/Earnings (forward) at 12.4x = materially below the 14.4x, the 10-year average
Europe (still) cheap after the material rally since October 2022?
Amazon revenue per employee peaked in 2010:
What about free cash flow / share though?
Liquidity is key for stocks (risk-on), right?
Is there something which can top liquidity?
Yes, hype ... AI edition here in this chart with $QQQ Nasdaq 100 and FED reserves ... Nasdaq disconnected
Nasdaq-100 $QQQ and the FED's balance sheet (black dotted line) & Nasdaq-100 (green) for a complementary view:
as FED balance reduction happened (lower liquidity), so did QQQ ... FED reducing again lately materially, but QQQ decoupled materially
For how long can it go on?
Interest rates (10-year treasury yields) & cloud multiples:
previously overcooked valuations with a 25x EV/NTM Revenue multiple, while now maybe undercooking them at 6.4x? ...
Have you ever wondered the evolution of Software SaaS IPOs pricing multiples?
2020 & especially 2021 with a 14.5x EV/Revenue was quite bonkers ....
N.B. just 8% of 2021 Software IPOs are trading above IPO valuation
Interest Rates, overall financing conditions & risk appetite matter a lot ...
SaaS valuation ordinality: remember that progression ... funny we have an 'SBC-Adjusted EV/FCF multiple' in the middle ;)) ...
Bonus charts
Tesla with a whooping 127% return in 2023 and eyeing to cross again the $1 trillion market capitalisation mark …
When the S&P 500 has a good first half of the year, more gains follow usually: when 10% or more, the broad index has moved higher 82% of the time
Cross asset volatility lower & lower = when an indicator that shows that macro uncertainty is very low, that’s usually a good tailwind for stocks ...
Commodities vs Equity Valuations (1970–2023):
In recent years, commodity prices have reached a 50-year low relative to overall equity markets (S&P 500). Historically, lows in the ratio of commodities to equities have corresponded with the beginning of new commodity super-cycles
While no two super-cycles look the same, they all have three indicators in common: a surge in supply, a surge in demand, and a surge in price
US Small caps via P/E valuations look quite cheap
Should you have found this cherry-picking endeavour interesting and valuable, subscribe and share it around with people that might also be interested! Thank you!
Have a great day!
Maverick Equity Research


Great stuff!
Thanks!