✍️ S&P 500 Report: Performance, Profitability, Sentiment & More - #Ed 5
Breaking down the S&P 500 & the 11 Sectors via Sleek Charts - Edition #5
Dear all,
welcome to the 5th edition of the S&P 500 Report: Performance, Profitability, Sentiment & More = a unique report via data driven research and visually appealing charts that simply tell … 10,000 words!
A quarterly report given it’s comprehensive nature & fits well with both Bottom-Up & Top-Down approaches. Delivers a great overview via many angles for many use cases.
If you know a better and comprehensive S&P 500 coverage (free or paid), let me know!
N.B. this S&P 500 report focuses on Performance, Earnings, Profitability, Sentiment, Seasonality, Technical Analysis & More. The focus and deep dive dedicated to Valuation + Special & Alternative Metrics will be covered after separately.
Work in progress:✍️ The State of the US Economy in 45 Charts, Edition #3 live soon also! You can read the 2nd edition: ✍️ The State of the US Economy in 45 Charts, Edition #2.
And now, a perfect time for another S&P 500 deep dive as Q4 2023 earnings are over, and we are heading deep into Q1 2024 earnings.
Structured in 7 parts + bonus charts & designed to have a natural flow:
📊 Performance Ins & Outs
📊 Earnings, Profitability, Flows & Breadth
📊 Sentiment & Chatter
📊 Seasonality, Volatility & Short Interest
📊 Technical Analysis: Short Term & Long Term
📊 The 11 Sectors Performance Breakdown
👍 Bonus Charts 👍
📊 Performance Ins & Outs
Zooming out first for a big picture perspective - helpful away from the news & chatter:
Bears Make Headlines & Lose Money, Bulls Make Money! As always … !
The bear case sounds very smart very often, only problem is, it’s quite rarely right … !
The world moves forward thanks to DO-ers and optimists, not by talkers, doom-scrollers and fear-mongerers… people that act, take initiative, try, fail, try again … !
👉 S&P 500 last 30 years: +1,907% return for a 10.52% CAGR (compounded annual growth rate) = compounding surely works
👉 Last 10 years, more than tripled at 234% and 12.81% CAGR …
👉 Last 4 rather peculiar years with many events - since 2020 we had many outliers:
the 2020 Covid pandemic
ramping inflation & interest rates (from 0% to 5.5%)
an energy crisis
some banks that went bust (Credit Suisse in Europe, SVB & FRC in USA)
a worldwide bottled supply chain
a war in Europe between Russia and Ukraine
now lately the Israel-Hamas war …
But, a key question: how did the S&P 500 do despite all that? Let this one sink in:
+71.58% = 13.46% CAGR to investors = very good … relative to long-term averages, and especially given the recent context!
👉 2024 performance with a great start of the year:
+9.10% for the SPY (weighted) while note the RSP (unweighted) +6.16%
👉 which makes us check for market concentration vs distribution - for that let’s chop the SPY and look inside of it via 2D: 2023 % returns & the holdings weightings:
Super Micro Computer (SMCI) the big outlier in 2024 with a 215% return, though with a very small weight in the S&P 500, it barely contributes to the index return
the big names with the heavy weights (boxers) carrying the index are: Nvidia, Microsoft, Meta/Facebook, Amazon + Elli Lilly, Berkshire, Google & JP Morgan
👉 now let’s make that visual into raw numbers via a return attribution analysis to see both leaders and laggards
4.97% (497 b.p. basis points) are coming from 7 stocks: Nvidia, Microsoft, Meta, Amazon + Elli Lilly, Berkshire, Google
which is a 54.61% of the 2024 total performance (4.97/9.10), hence returns are concentrated, though way less than last year when the Magnificent 7 stocks drove even 68% of the returns: Apple, Microsoft, Google, Amazon, Nvidia, Meta & Tesla
overall the rally has been broadening across the S&P 500 11 sectors relative to 2023
check also the individual % returns which are positive from +12.28% for Google to a whooping +70.89% for Nvidia in 2024
Who are the leaders, clear! Who are the 7 laggards?
surprise surprise: Apple and Tesla the biggest laggards in 2024
check also the individual % returns which are negative from -11.91% for Apple to -31.64% for Boeing
👉 now let’s ignore weighting and switch to the S&P 500 unweighted components via the following 2D chart: 2023 % returns & Above 52-Week Low %:
SMCI with an +868% return from the 52-week low … let that sink in !
Nvidia following with a +223%, +Uber 155%, Constellation Energy Corporation +153%, Meta +147%, NRG Energy 137%
👉 continuing smoothly with the S&P 500 stocks above their 52-week lows & below their 52-week highs as my quick way to see both positive & negative momentum
if you see some of your names in one of the extremes, it’s interesting to relate to the other close clusters, peers or market overall and derive insight from there
interesting view for momentum traders/investor, and as always outliers are very interesting and can showcase some special situation going on there
👉 Complementary: filtering 2024 by single names in the 11 sectors and 24 industries, and where size = market cap
Which one jumps to you and which one you own or find interesting?
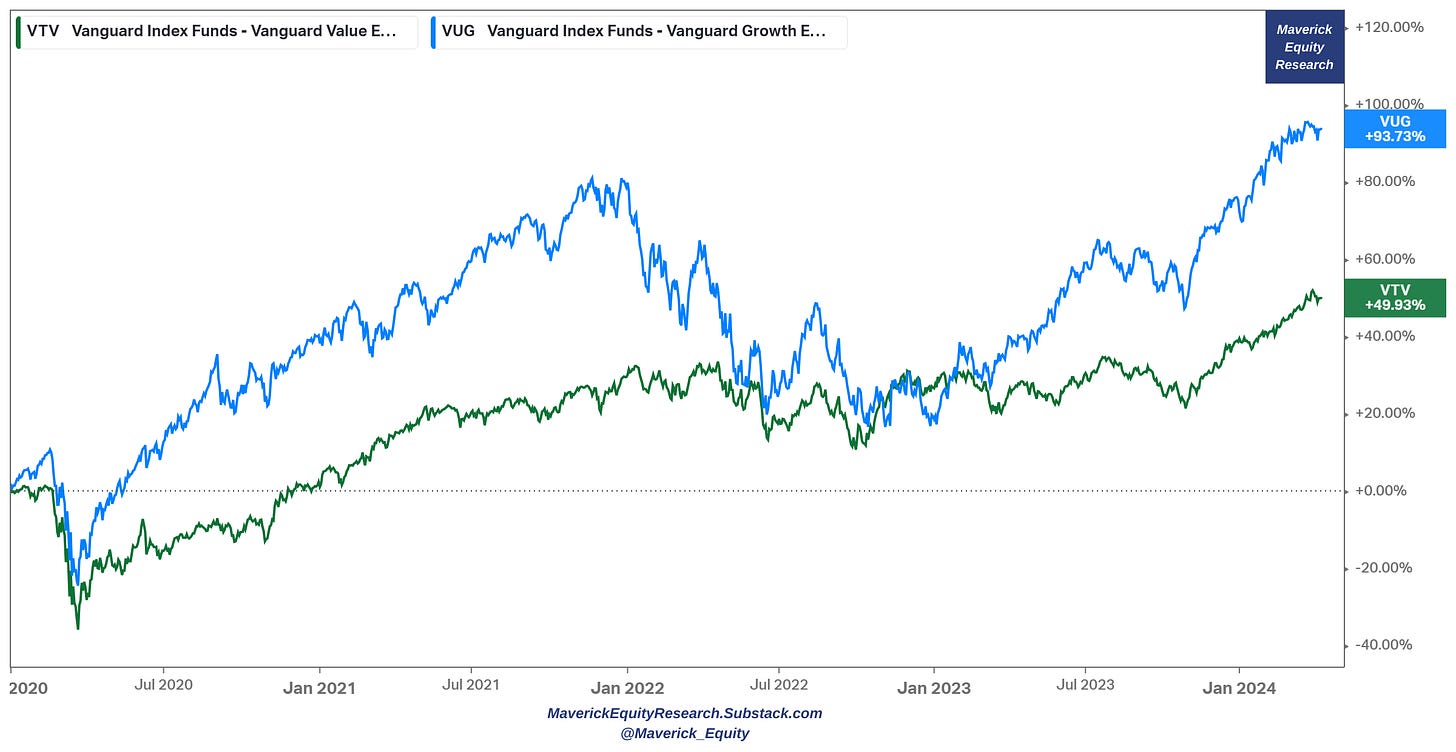
👉 Value & Growth in 2024 for a styles view - growth leading like in 2023, but value also doing well this time around … sign also of a broadening rally …
VUG growth (blue) +10.52% rally while VTV value (green) with just +8.18%
Since 2020: growth (VUG) stepped in and helped a lot via it’s techie nature during the pandemic, while in the 2022 bear market value (VTV) came back and matched growth
since 2023, growth is back big time the AI driven mega run, value doing fine also
Overall since 2020: growth (VUG) +93.73% & value (VTV) +49.93%, both very good!
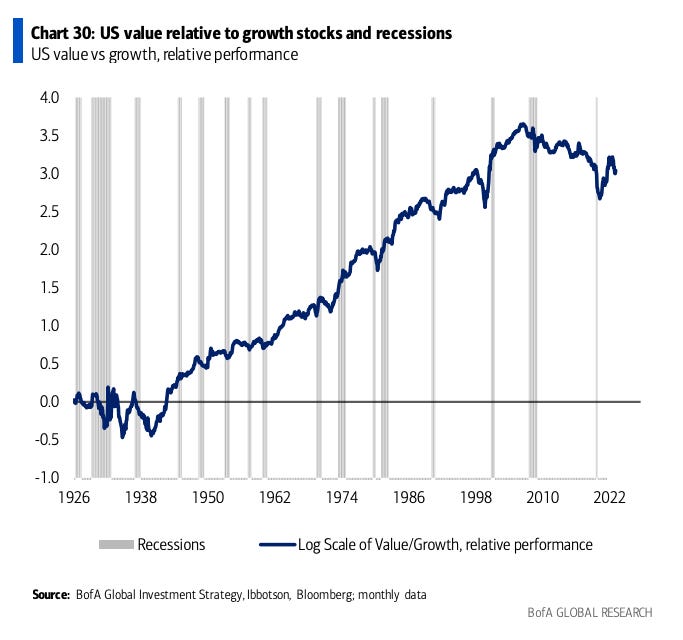
Key note now on Value and Growth investing, relative performance:
since 1926, there have been only 3 decades during which value stocks have underperformed growth stocks: 1930s, 2010s, and 2020s …
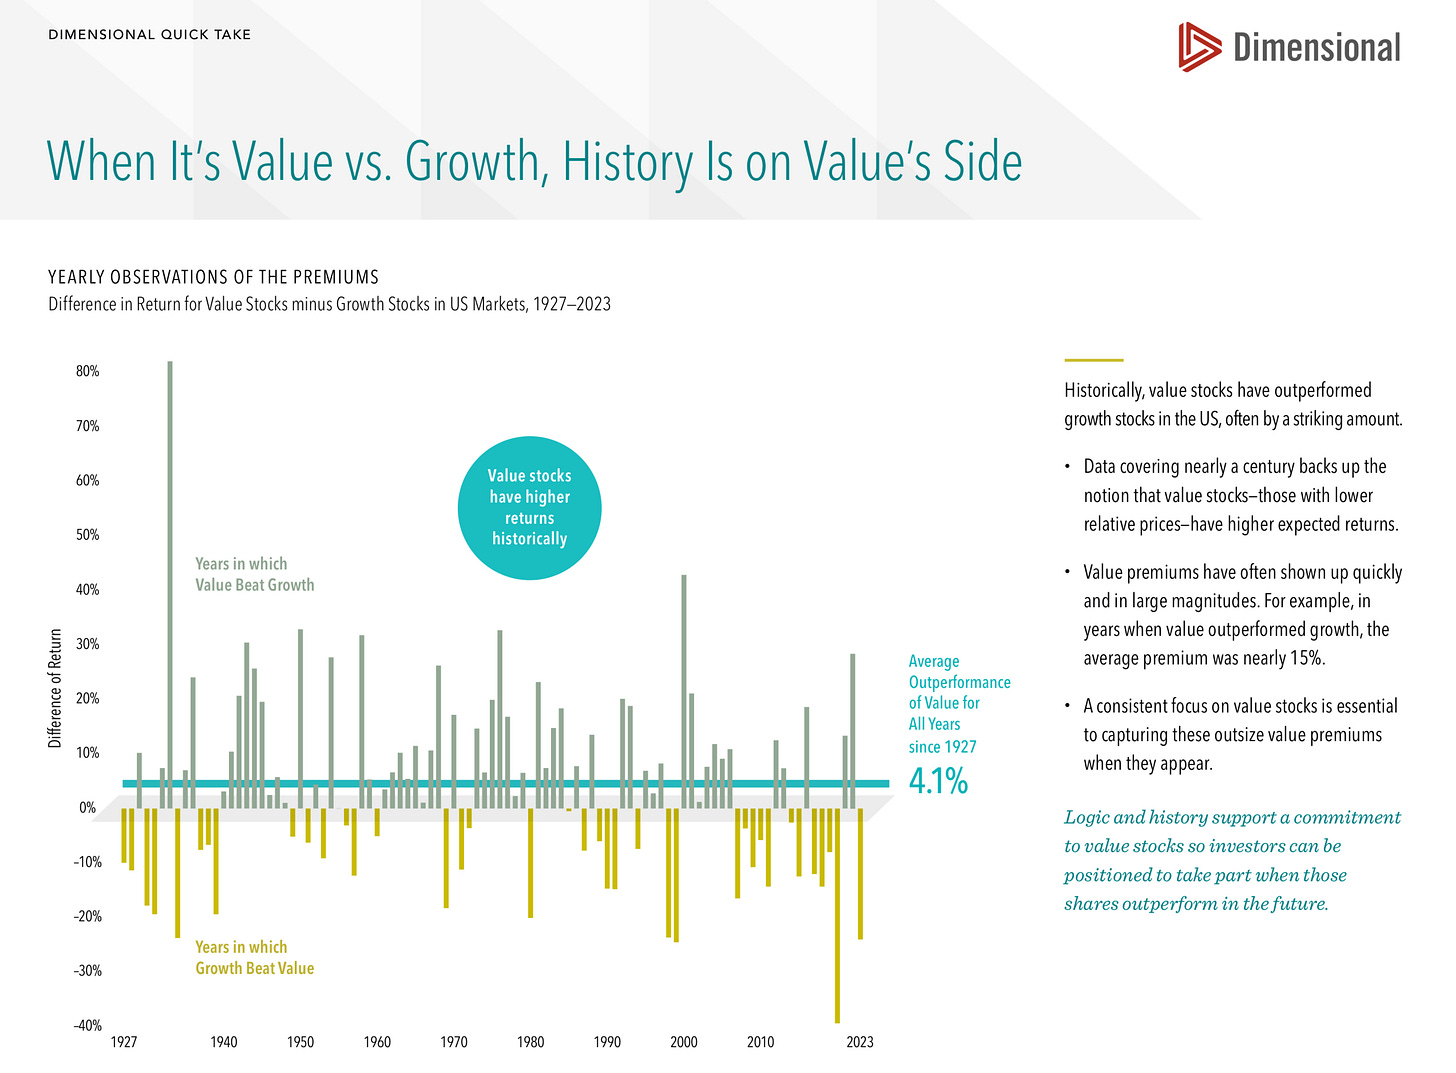
From my side, diversified across value and growth is a good idea at any given time, and I prefer a more value tilt at any given point in time - Dimensional makes the case:
data covering nearly 100 years of the value and growth premiums: value outperforms by 4.1% and in years when it does, the average premium is nearly 15%
More nuance via factors:
momentum (MTUM) with the big lead in 2024, followed by growth (IWF)
small cap (IJR) and low volatility (USMV) the laggard in the start of the year
📊 Earnings, Profitability, Flows & Breadth
👉 Q4 2023 earnings season … good and surprising many
revenue growth +3.7% = good
earnings growth +10% = very good
👉 Profitability: actuals and estimates
S&P 500 EPS (earnings per share) forward 12-month & price:
price action has been really good lately … quite some decoupling from EPS, hence markets pricing in solid earnings growth and a good economy
one would have to follow this: material negative earnings surprises will likely impact price on the downside … in the end of the day, as I heard it on the street, it is all about earnings …
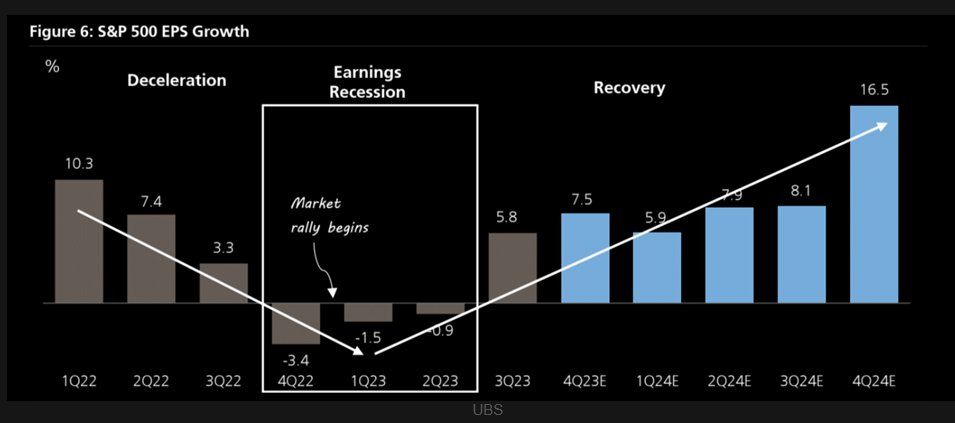
Can you show me how it’s all about the earnings? Yes, there you go:
2022-2023 earnings recession started to get revised higher with EPS growth from negative back to positive, so did the stock market rally started & came to town
Complementary, the S&P 500 EPS Actuals & Estimates via consensus:
Quarterly bottom-up: 54.85 for Q1 2024, 59.30 for Q2 2024, then pace to pick up
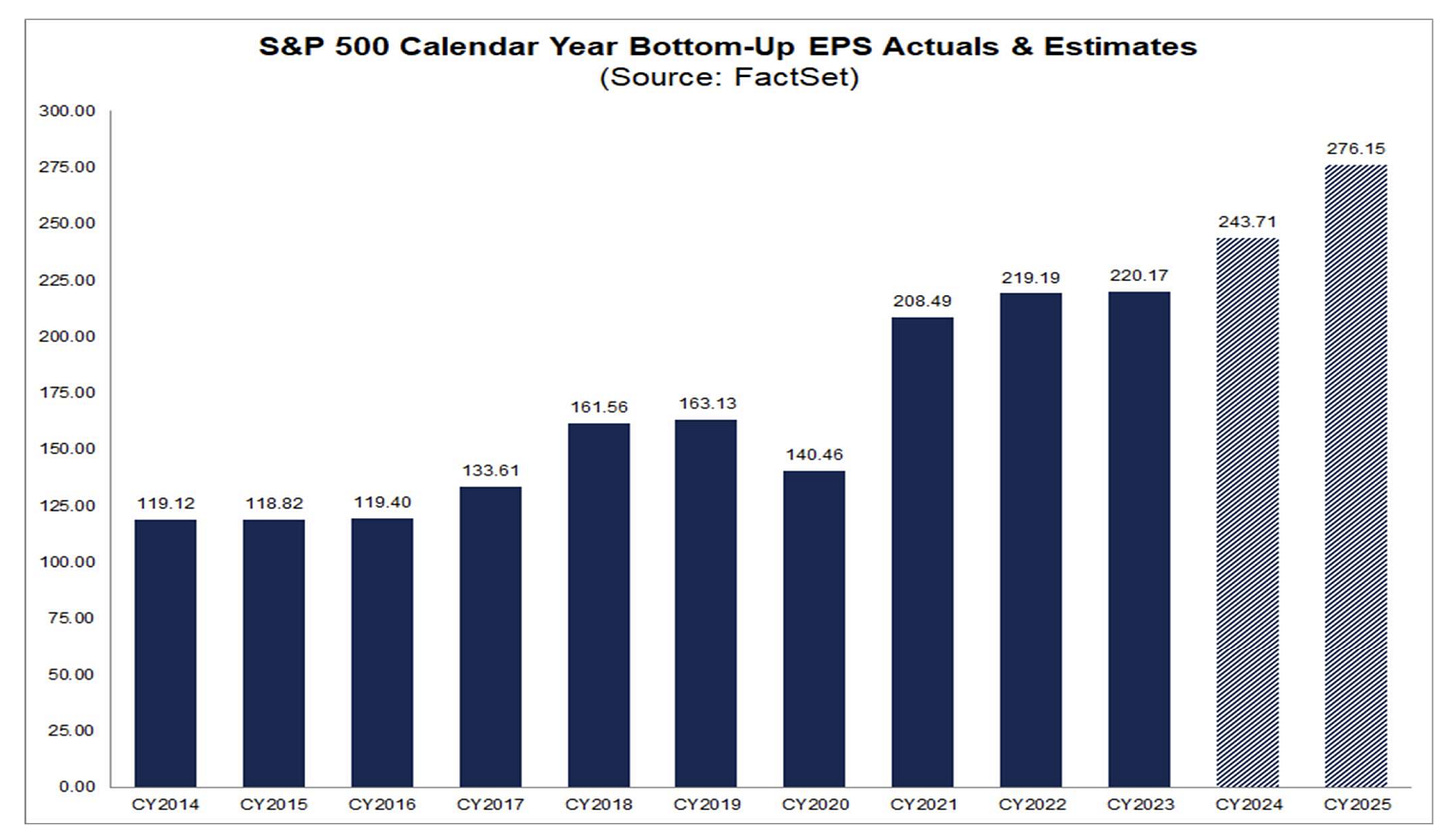
Yearly bottom-up EPS actuals & estimates:
243 for 2024 and 276 for 2025 … no earnings recession on the horizon …
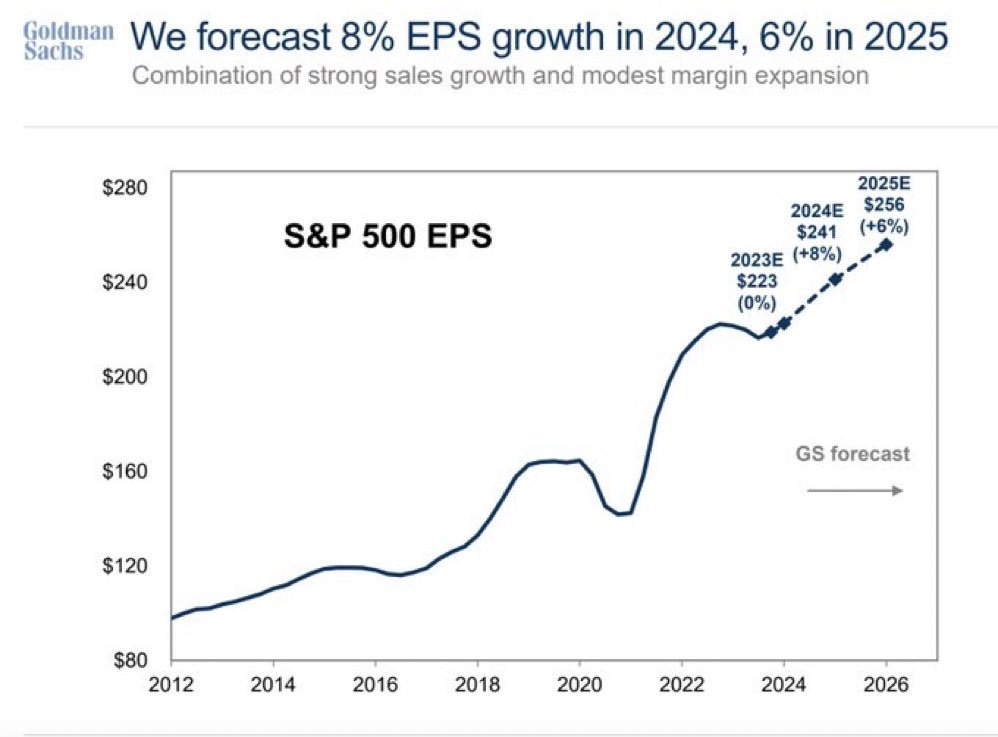
Goldman Sachs with an 8% EPS forecast for 2024 and 6% for 2025
S&P 500 Profit Margins:
Ebit margin, Net margin are high, way above their averages … despite the high interest rates environment and macro-geopolitical issues
👉 Flows
S&P 500 (SPY) monthly financial flows (green/red) & total return (blue) since 2020:
2020 Covid crash: -$28.5bn in February, +$13.3bn with the March sharp rebound
2022 bear market: +$25.6bn in Dec 2021 right at the top, -$30.5bn in Jan 2022 to start the bear market and even bigger than the Covid crash, hence big outflows outliers are a good metric to watch for
2023 December was huge with almost $40bn, rally took another big step higher
2024 with January and February outflows, yet March with the rebound
👉 Breadth
breadth used to stinky (words play) in 2023, not anymore
we have a broader rally with over 80% of stocks above their 200-day moving average … suggesting further upside potential
📊 Sentiment & Chatter
👉 Sentiment:
The Fear & Greed index shows slight GREED at 56, not far from the same situation last week, last month or during the past year as the rally was rolling
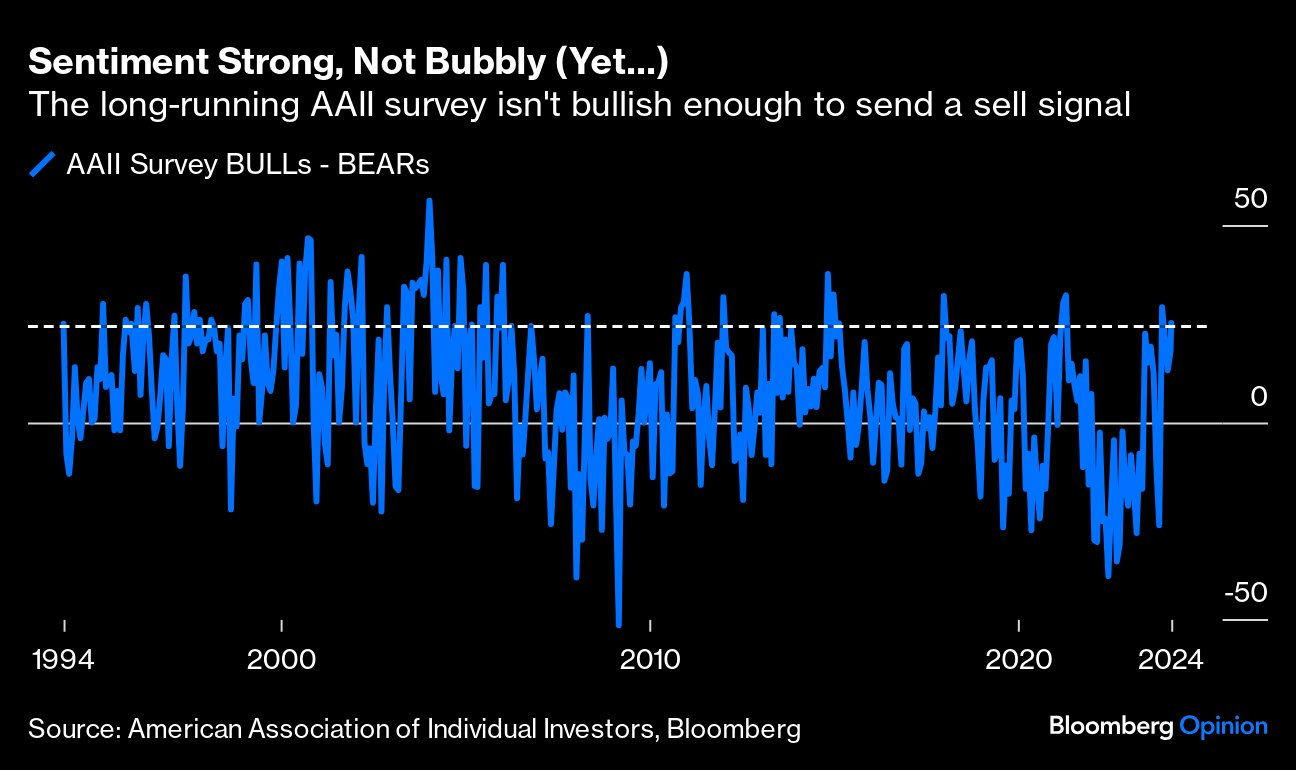
American Association of Individual Investors’ (AAII) weekly survey of members
Sentiment is strong, though not bubbly currently
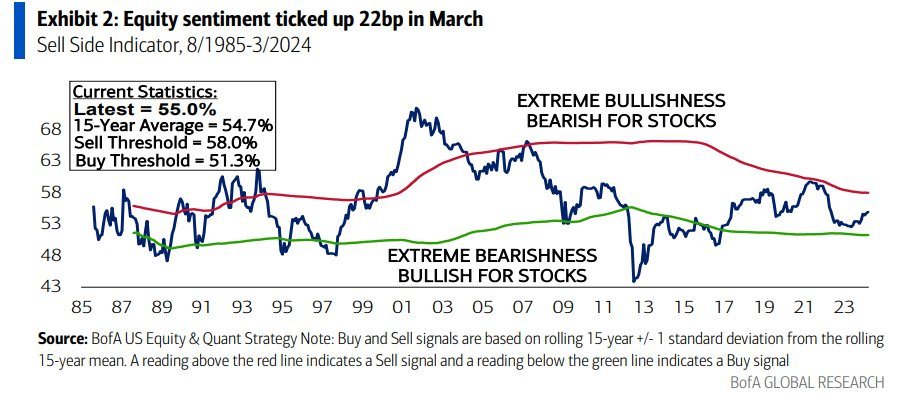
BofA’s sell side indicator:
equity sentiment ticked up 22 bp in March, no euphoria levels
latest reading is 55% which is right there with the 15-year average, and far from both Sell and Buy thresholds (58% / 51.3%)
BofA’s Global FMS sentiment:
most bullish since January 2022
though no extreme levels to indicate extreme bullishness or bearishness
👉 Chatter
AI, to begin with:
179 cited the term “AI” during their Q4 20203 earnings call = 2nd-highest number going back to at least 2014
current record is 181, which occurred in Q2 2023
the term “AI” was mentioned more than 50 times on the earnings calls of nine S&P 500 companies, led by … you guessed it, NVIDIA at 114!
Supply chains:
in earnings calls from the fourth quarter of 2023, fewer firms discussed supply chains than at the peak of congestion in late 2021 and 2022
much of the commentary centered around how companies have improved supply chains following pandemic-era bottlenecks
The ‘R’ rated chatter, namely Recession!
cooling off more and more: lowest number of S&P 500 companies citing “recession” on earnings calls for a quarter since Q4 2021
interesting also to note that the term “soft landing” was cited on the Q4 earnings calls of 37 S&P 500 companies = highest number of S&P 500 companies citing the term “soft landing” on quarterly earnings calls going back at least three years
Schwab Trading Activity Index (STAX):
investment exposure increased during the four-week period ending March 28, 2024, ending with a STAX score of 51.65. This ranks "middle" compared to historical averages
More Schwab clients bought equities than sold, which contributed to the increase in the STAX score during the March STAX period
Clients were also net buyers on a dollar basis. Buying was most pronounced within the information technology, health care, and consumer staples sectors
📊 Seasonality, Volatility & Short Interest
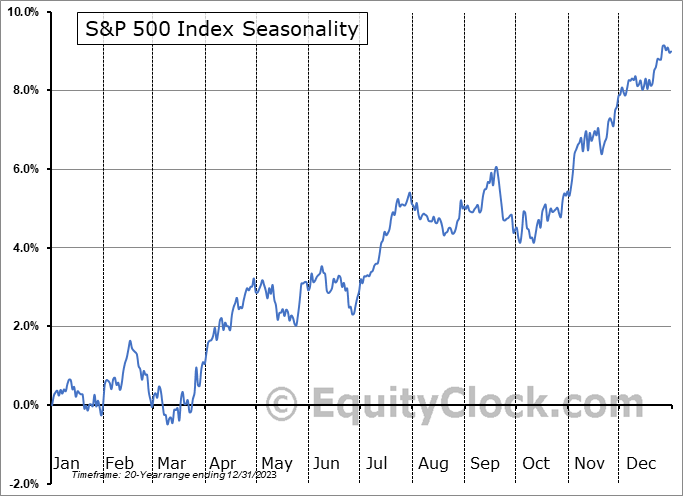
👉 Seasonality
Presidential and non-presidential election years
S&P 500 is now quite ahead (green) to where it normally tends to be in both non-presidential & presidential election years going back to 1976. Once election day is over, equities typically rally as uncertainty is resolved.
US Presidential Cycle year 4 is supportive of higher S&P 500 (same for the USD, rather supportive for Oil and about 50/50 for the US 10-year yields)
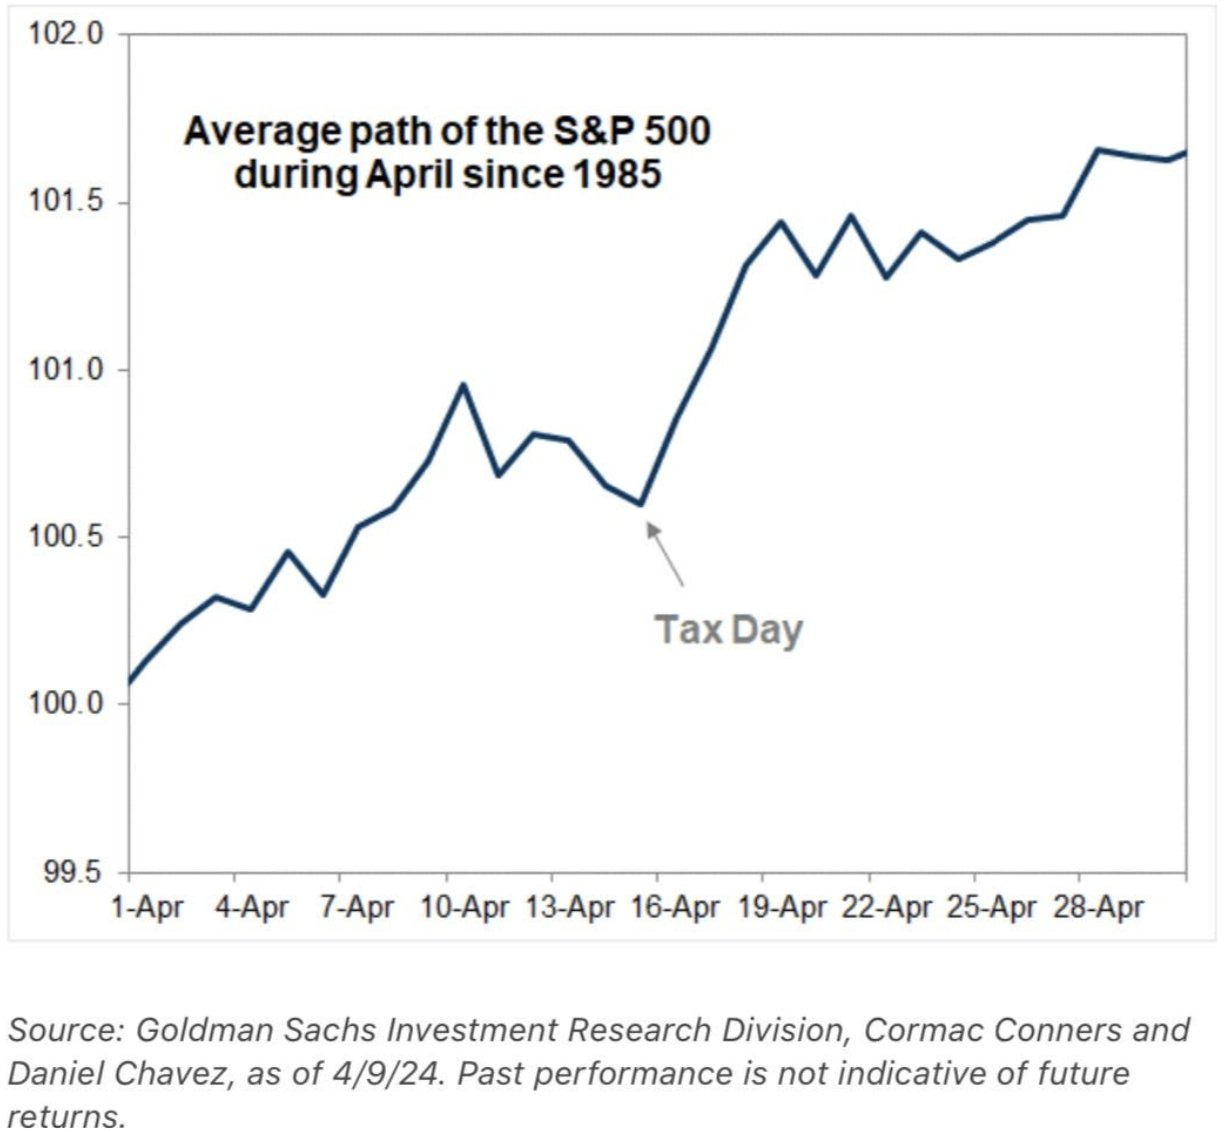
Taxes seasonality via the S&P 500 average path during April since 1985 = selling into tax day, but don’t go away (like in May), as the bounce is incoming to town
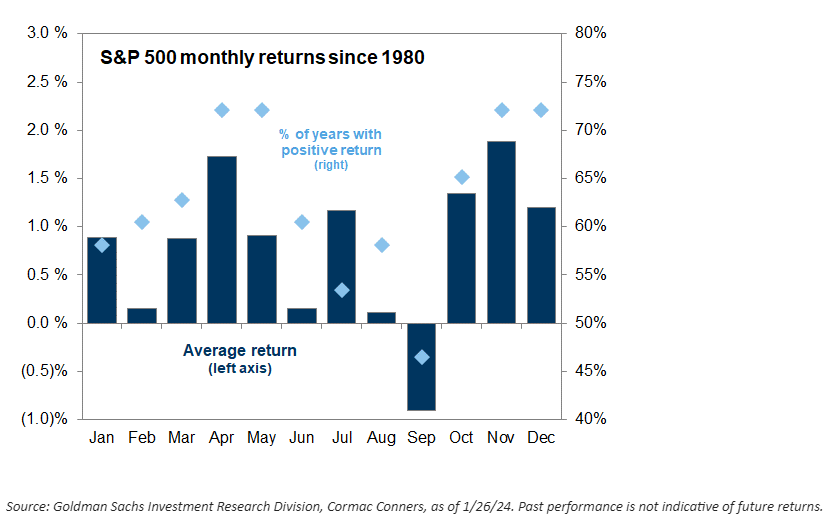
Monthly seasonality: April a good month historically
👉 Volatility
VIX (blue) at 15.22 is well above the 20-year average 19.13 - in an election year we should see volatility picking up a few times
until then: stocks hovering at all-time highs, portfolios high, confidence, sentiment, spending, investing
makes it cheap to hedge these days = hedge / protect gains when you can and cheap, not when you must and expensive
👉 Short Interest
S&P 500 short interest has been dropping more and more, the more the stock market rally started to be strong and stronger since 2023
at the sector level: Industrials, Materials and Utilities the most shorted sectors, while Tech and Communication the least (as expected)
📊 Technical Analysis: Short Term & Long Term
👉 Short Term:
trending nicely in an upward channel once we left the 2022 bear market
50-day moving average as a first support level at 508, while the 200-day moving average as a second support level at 463
the RSI at 47 showing neither oversold nor overbought territory
👉 Long Term:
since Q4 2023, we have been going basically straight up, hence departing from the 50-week and 100-week moving average, which are support levels at 458 and 426
keep in mind big inflections points when long term moving averages are crossed
📊 The 11 Sectors Performance Breakdown
👉 2024 performance of the 11 Sectors that shape the S&P 500 - you would not guess which sector is leading in 2024 … as I did not see it mentioned out there …
no, it's not tech, it's not communication services
it is ... drum rollllsss ... Energy (XLE)! Yes, energy is back +15.59% ... followed by Communications (XLC) +12.24% and Industrials (XLI) with +8.15 ...
Real Estate (XLRE) -6.41% and Consumer Discretionary (XLY) -0.73% = the laggards and the only 2 sectors out of the 11 that are negative so far
the spread between the Top (XLE) and Bottom (XLRE) sectors is 22% which is not big, especially compared to 2023 when it was even 57% (Tech vs Utilities)
Hence, the main take-away is simple: 'the rally is broadening bro …!'
Energy (XLE) relative to Tech (XLK): energy with an outperformance over the mighty tech … it will be very interesting if the leadership shift stays in 2024
Another sign of a broader rally? not just tech (XLK), but also Industrials (XLI) with multi all-time-highs as industrials are a key sign from the real economy side
👉 Let’s go 2D: 2023 % returns & Above 52-Week Low % for the 11 Sectors + S&P500
Check also those big bounces from the 52-week lows % ... all sectors rebounded
👉 before we go into each of the 11 sectors, let’s see an overarching theme since a while, specifically zooming out to check the ‘techie’ trend since more than a decade:
‘Tech is taking over the world baby!’ - Tech relative to S&P 500 since 1985:
during Covid it broke the +1 standard deviation while in 2023 with the AI run even the +2 SD
while tech today is real, integrated into the economy big time, works and brings a lot of value (2001 dot-com empty concepts many) ... it's hard to ignore the parabolic run lately
note: I compare it not to some empty/unprofitable/volatile sector, but to the mighty S&P 500 ... which is not a shabby construct at all, it's the 11 sectors of corporate America which also derives 40% of revenues from outside the US ... and has performed very well since many many decades …
note: ratio has been falling in 2024, which is another sign of a broadening rally
Your feedback? Food for thoughts …
👉 have you ever wondered on Sector dominance historically (since 1960) ?
Energy and Materials (Industrial Revolution vibes), then
Consumer Staples and Discretionary
Financials and Real Estate (bubble and excesses of 2007-2009
currently the 2-tech heavy sectors dominates big big time and for quite a while …
And now let’s zoom into the Price/Performance of the 11 sectors via scatterplots: 2023 % returns & above 52-week low % returns. General use cases for this visuals? Check for outliers, market leaders & laggards, positive/negative momentum, relative strength and/or likely un/warranted cheap /expensive stocks:
👉 XLY - Consumer Discretionary:
Amazon (AMZN), Deckers (DECK), Domino’s Pizza (DPZ), Chipotle (CMG), GM (GM) rolling in the green sweet spot
LULU (LULU) is LULU in 2024, Tesla (TSLA), Etsy (ETSY), Starbucks (SBUX), McDonalds (MCD) down in 2024 and not a lot above their 52-week low
👉 XLP - Consumer Staples:
Kroger (KR), Dollar General (DG), Costco (COST), Target (TGT) rolling …
Walgreens (WBA), Philip Morris (PM), less so …
👉 XLE - Energy:
sector is leading in 2024, and quite a broad rally across the entire sector
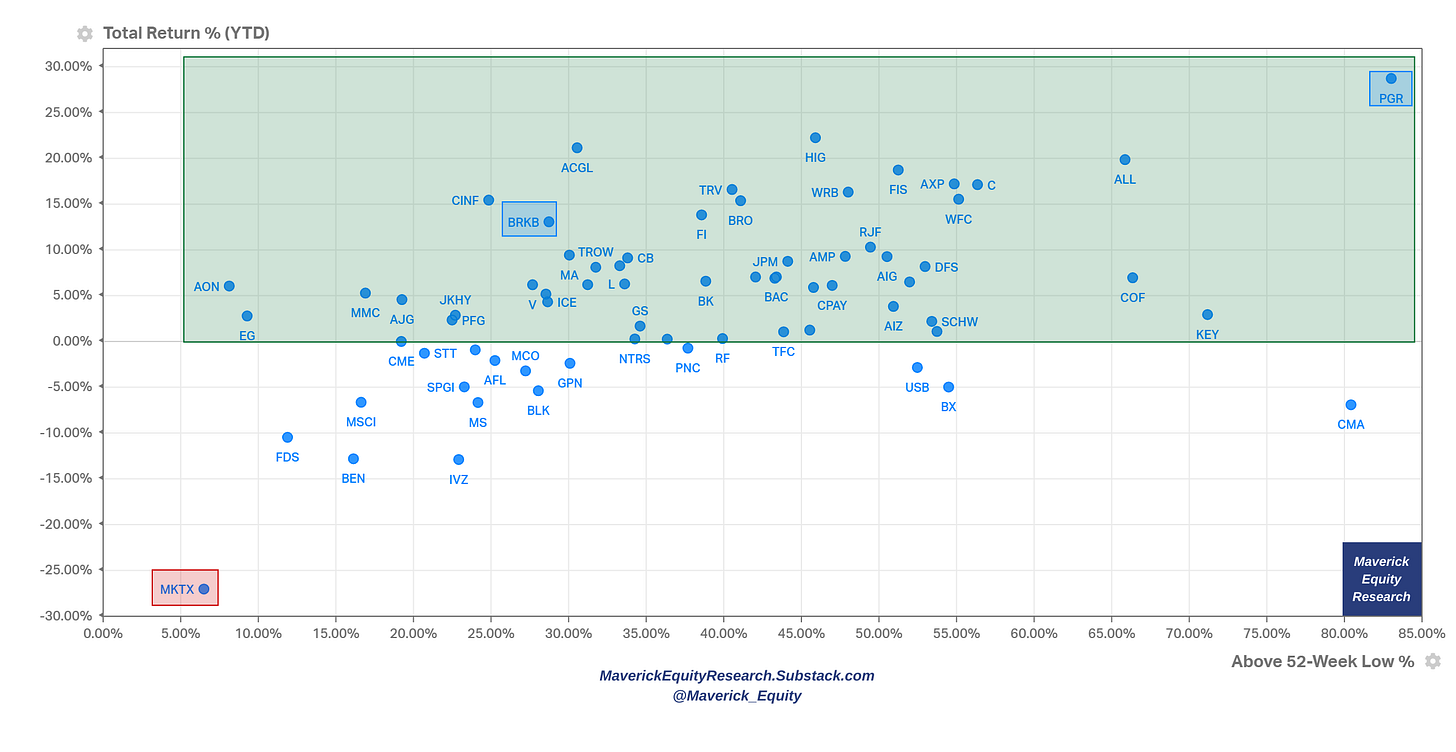
👉 XLF - Financials:
many names positive in 2024 and with big rebounds from the 52-week low
Progressive Corporation (PGR) and MarketAxess Holdings (MKTX) the outliers
Berkshire (BRK) +13% in 2024, and a great 28.73% from the 52-week low
👉 XLV - Health Care:
Eli Lilly (LLY) the big outlier on the positive side, Moderna (MRNA) to be noted as positive in 2024 and with a big bounce from the 52-week low
👉 XLI - Industrials:
Industrials are doing fine in 2024 and with nice rebounds from the 52-week lows
GE (GE) a top performer in 2024, check also Uber (UBER) with the rebound
Boeing (BA) on its worst losing streak since 2018 on safety & CEO issues
👉 XLB - Basic Materials:
most names doing fine in 2024 and also rebounding nicely from the 52-week low
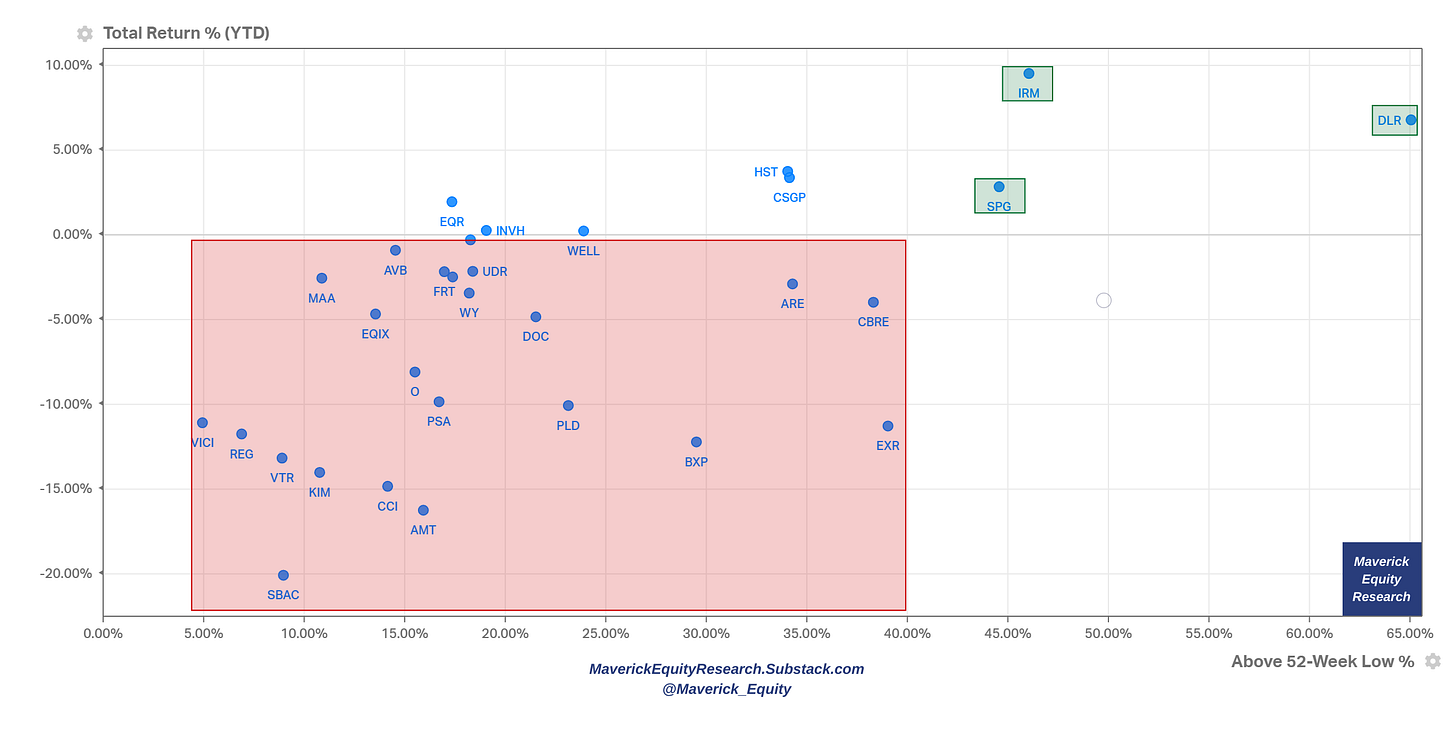
👉 XLRE - Real Estate:
sector down overall in 2024, hence also most names
notice though the Digital Realty Trust (DLR) as the outlier in this space … along Iron Mountain Incorporated (IRM) Simon Property Group (SPG)
👉 XLK - Technology:
2 big outliers: Nvidia (NVDA) and the new in town, Super Micro Computer (SMCI)
SMCI with +216% in 2024 & 864% from the 52-week low is such an outlier that the other names cannot be seen, hence 2 charts where in the 2nd I exclude/hide SMCI
NVDA (NVDA) very well also in 2024 with 78% and 236% from the 52-week low
Cisco (CSCO), Intel (INTC) and Adobe (ADBE) not doing well in 2024
Bonus chart on Super Micro Computer (SMCI) as it deserves one:
AI driven demand + Operating Leverage + Multiple Expansion = makes it for a very big growth in revenues
👉 XLC - Communications:
Meta (META) the big positive outlier, followed by Netflix (NFLX), Google (GOOGL), Disney (DIS) and Live Nation Entertainment (LIV)
fun note on META/Facebook: a mega rebound, currently in the MetaVerse … all that Mark’s training to fight Musk in the ring helps it seems ;)
👉 XLU - Utilities:
NRG Energy (NRG) & Constellation Energy Corporation (CEG) the two positive outliers while as the sector is down in 2024, many names still negative
👍 Bonus Charts 👍
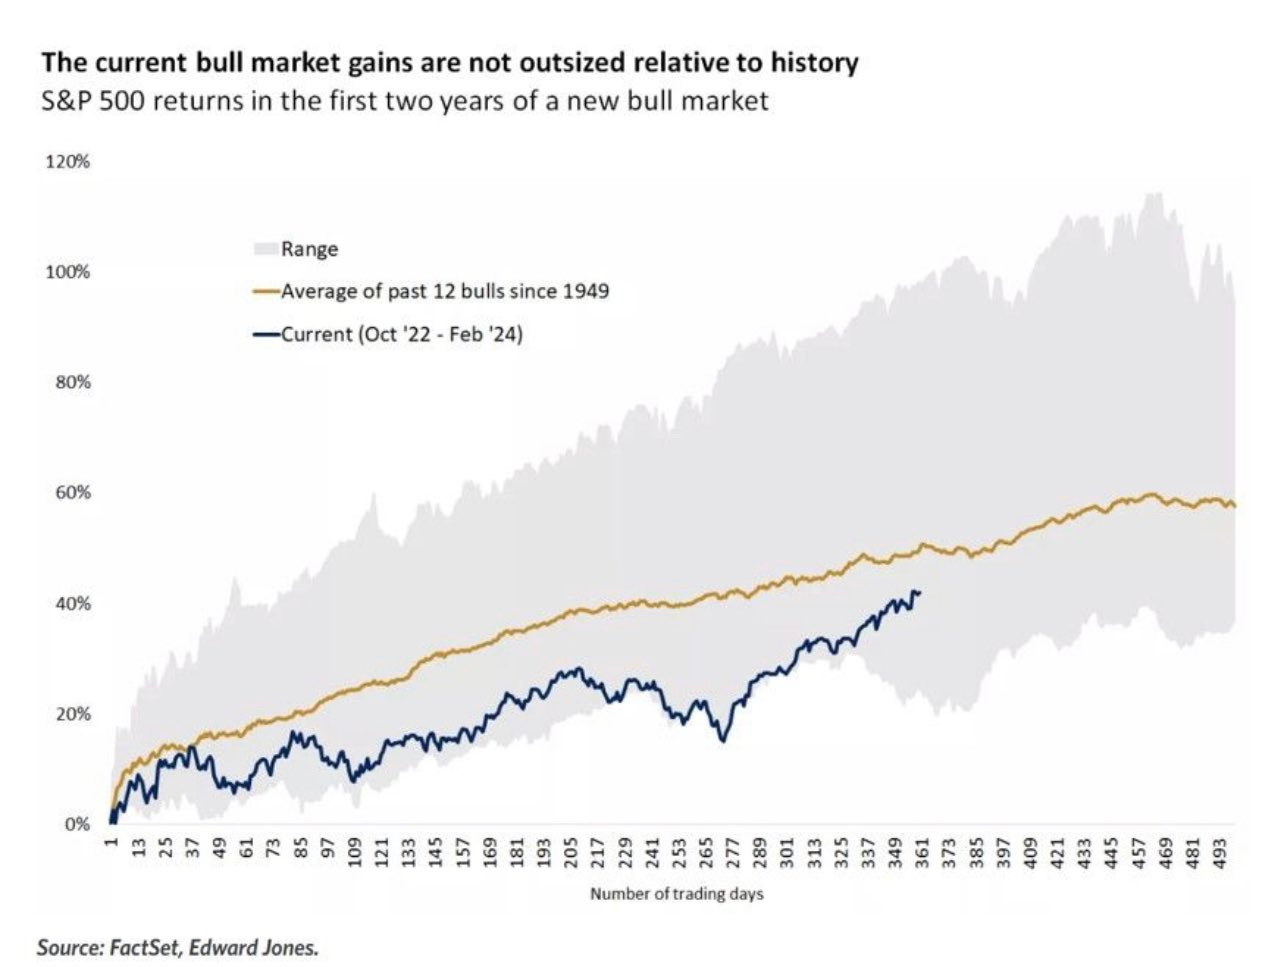
👉 We are in a bull market, is it outsized relative to history (since 1949)? No!
we are in the lower range
specifically, we are even below the average for the past 12 bull markets
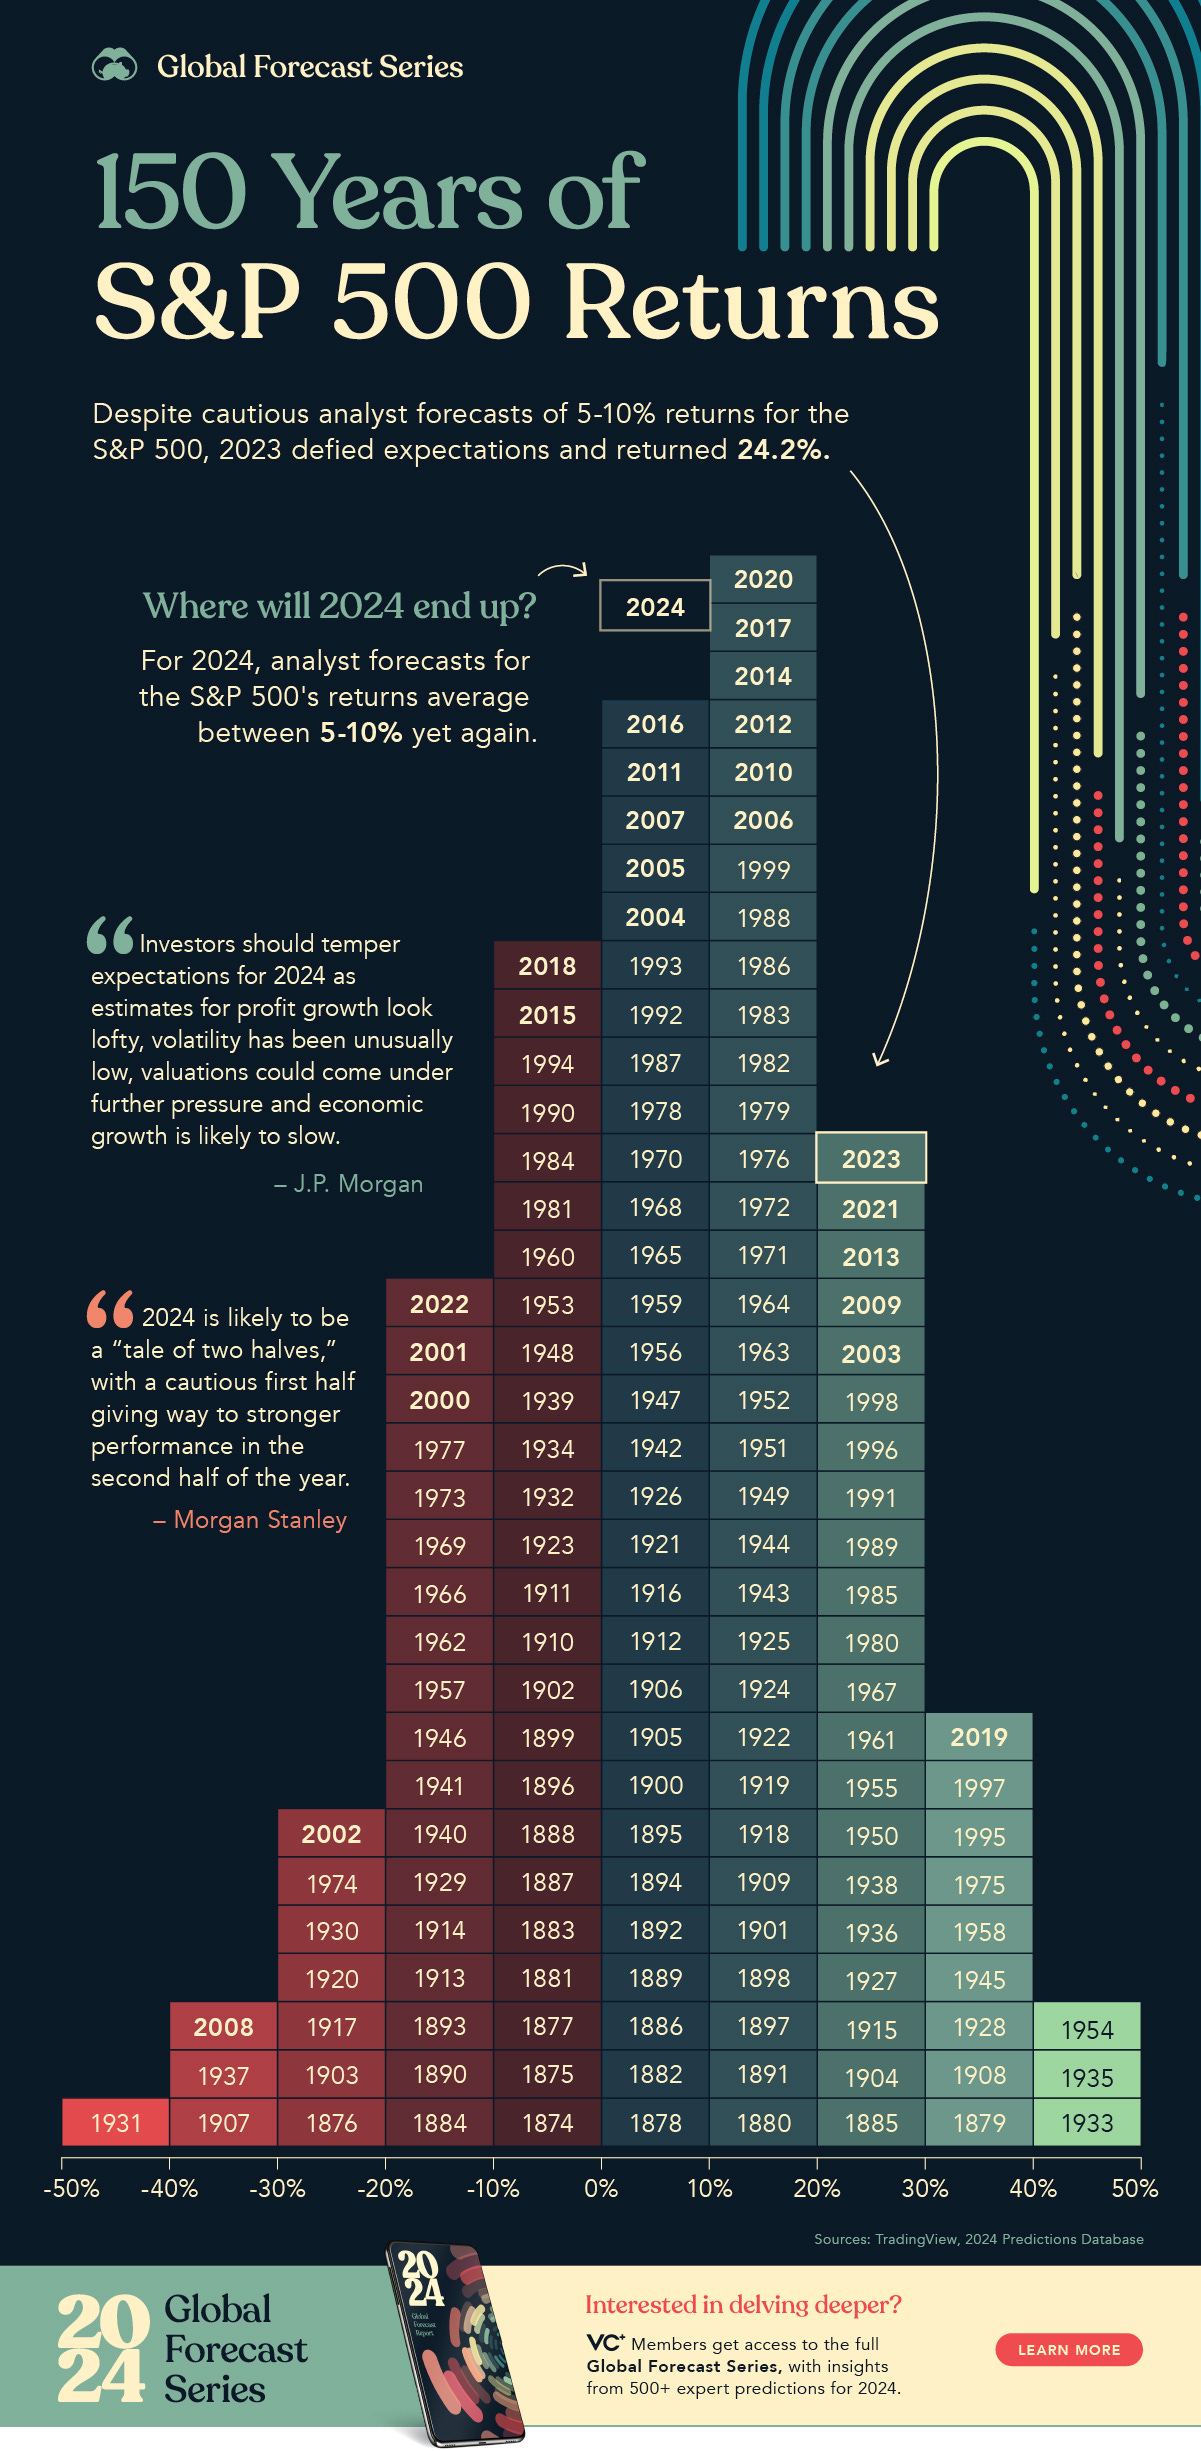
👉 Visualizing 150 Years of S&P 500 Returns
like a bell curve, the majority of returns fall near the middle, with the highest number of returns in the 10% to 20% range.
the best year was in 1933, when the market soared almost 54% during the Great Depression after it faced its worst year just two years earlier, plummeting 43% amid the collapse of the U.S. banking system; the last time stocks tumbled nearly that far was in 2008 when we had the Global Financial Crisis
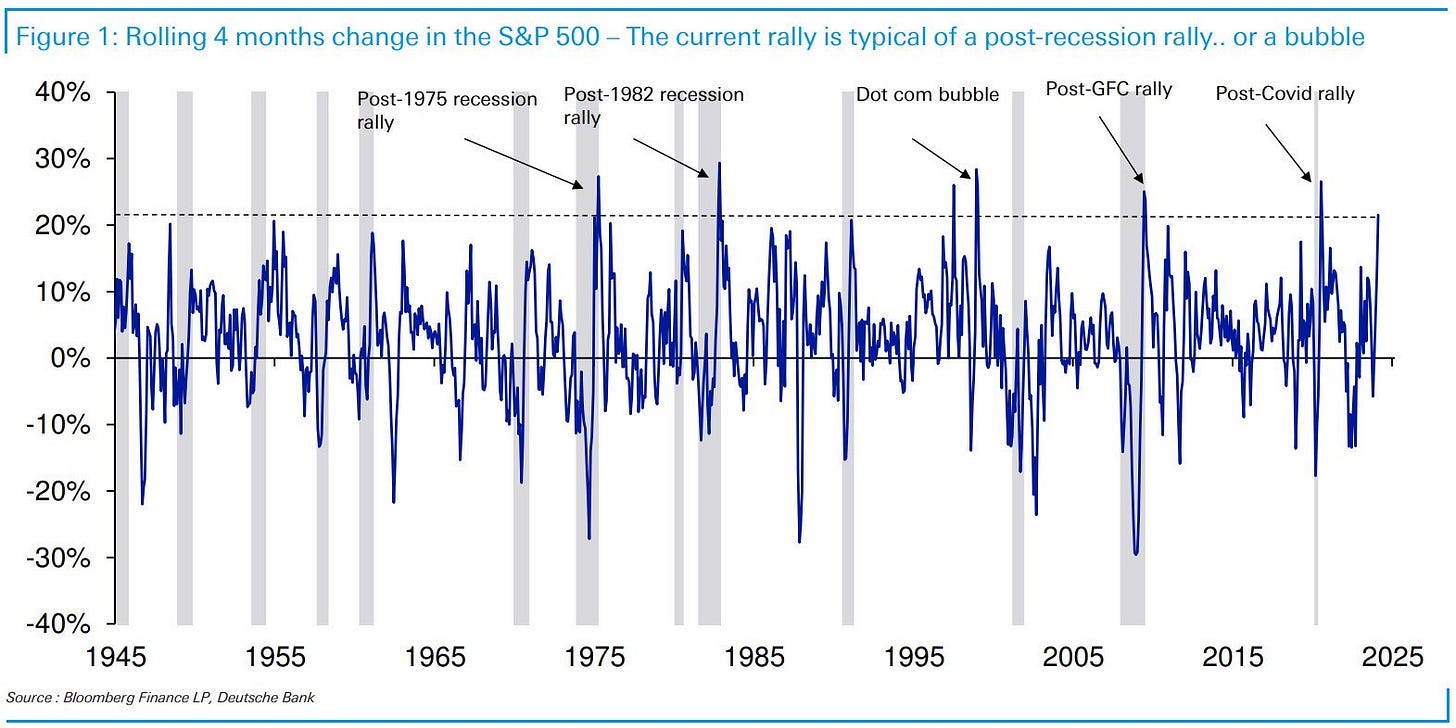
👉 S&P 500 rolling 4 months change
current rally is typical of either a post-recession rally or a bubble, your opinion?
I think rather a post-recession rally … it’ll be hard in 2024 to have a big correction with all the fiscal spending, election year & likely 1-3 interest rate cuts
👉 Investing at all-time highs as we have these days, is it problematic or so?
on average since 1970, the S&P 500 has done better 1, 3, and 5 years after making an all-time high than picking a random day
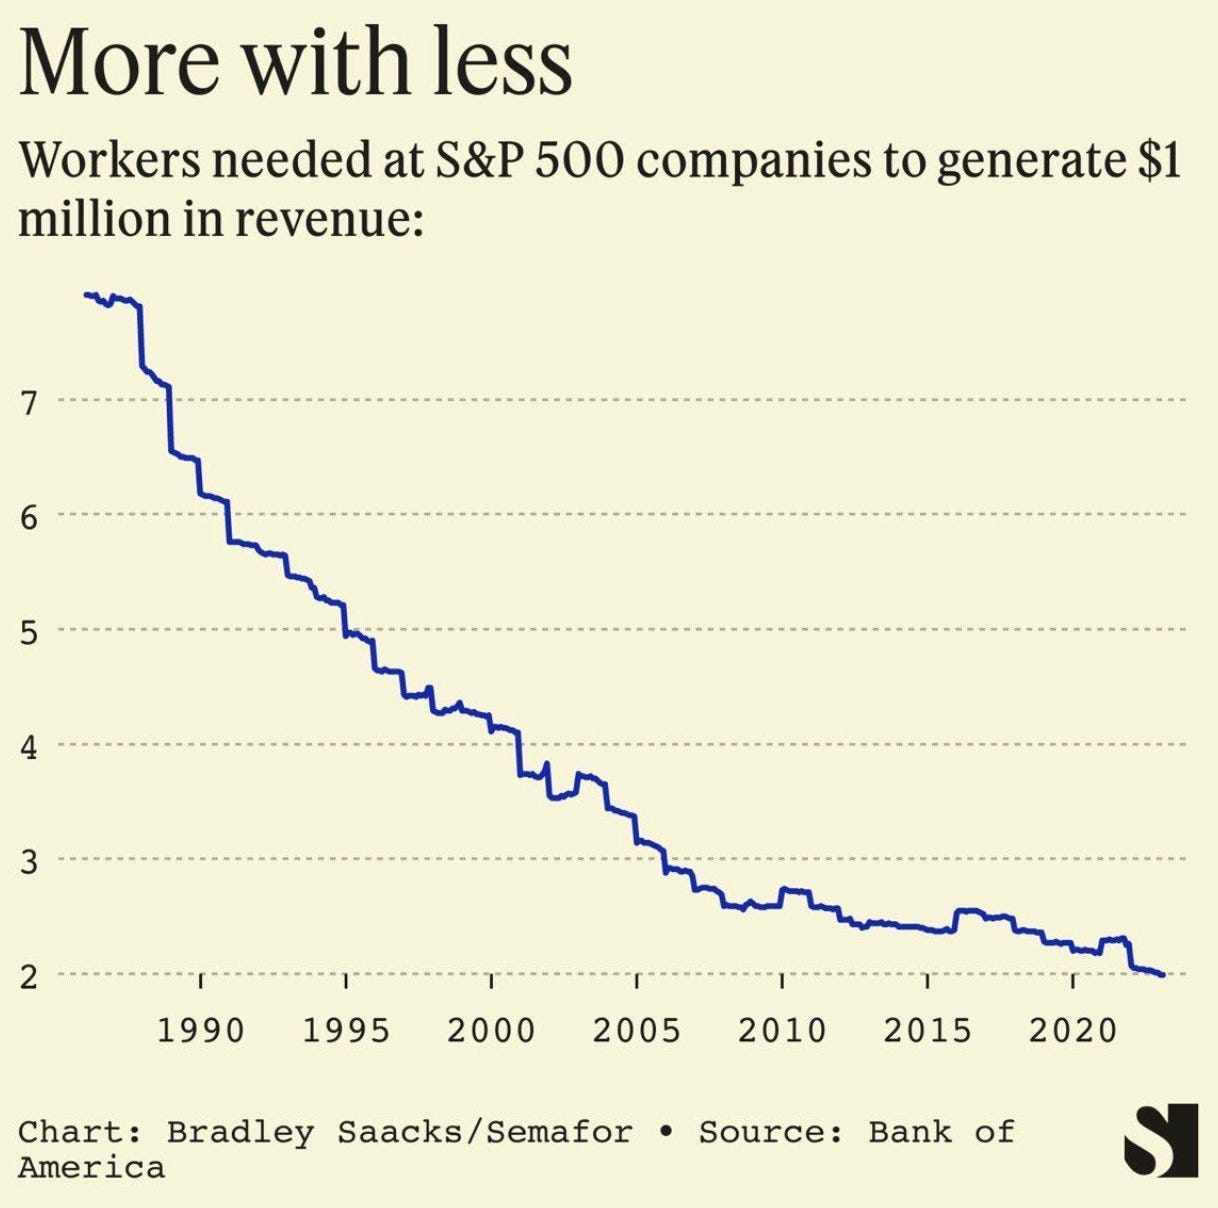
👉 Workers needed at S&P 500 companies to generate $1 million revenue
from almost 8 before 1990 … to only 2 in 2024 …
however, when adjusted for inflation it is almost 6m hence around a 15% decline which is not a lot in 40 years
also note the uptick increase since 2020 which is surprising I would say
Research is NOT behind a paywall and NO pesky ads here unlike most other places!
Did you enjoy this extensive research by finding it interesting, saving you time & getting valuable insights? What would be appreciated?
Just sharing this around with like-minded people, and hitting the 🔄 & ❤️ buttons! That’ll definitely support bringing in more & more independent investment research: from a single individual … not a bank, fund, click-baity media or so … !
Have a great start in the next week!
Mav 👋 🤝

















Nice 2024 S&P 500 index earnings bullishness in detail here from Mav. Thanks! Nice one!!
Thanks man, you and Doomberg are my best reads every time you release the goodies! Thanks! Appreciate it!