✍️ The State of the US Economy in 45 Charts, Edition #2
GDP, Job market, Consumers, Interest rates & yields, Housing, Inflation and Recession probability. Research via sleek charts that say 10,000 words ...
Dear all,
first of all, I wish you a great 2024 filled with health, followed by numerous personal & professional achievements! Day by day, step by step, knowledge & effort compound!
Second of all, greetings from Vienna from the Austrian National Library where I wrote yesterday and today this comprehensive research piece. A fresh picture that I just made so that you maybe get inspired to visit the place if you visit Vienna one day.
Zooming out, besides the library itself, there are often diverse special exhibitions in the State Hall and the museums within. I highly recommend a tour around!
On visiting Vienna, some of you got inspired and wrote me before you got here for business or pleasure and with that occasion we also met in person which was great! Therefore, just feel free to write me anytime and we might have a coffee around! Please remind me also if you are one of the anonymous or not folks that did support my research work by donating/tipping this independent research publication. I would be very glad to get you lunch and a coffee as a form of gratitude 😉👋 🤝!
The State of the US Economy in 45 Charts
Structured in 7 parts and designed to be a very comprehensive report. Given this, 4 editions a year and occasionally special reports on top when the situation requires it is what most people need from the Macroeconomics side.
The media will try to keep you glued to the screen with every weekly economic release or latest hot takes or headlines, but that is mostly for their ad revenue at the expense of your precious time, energy, focus and attention which nowadays are very important! Maybe controversial, but this place is about ‘Maverick-esque’ independent research, hence not a medium to please some view, or sugar coat one side or the other 😉.
The structure with the table of contents and key highlights can be enjoyed already:
📊 GDP growth: 4.9% (quarter/quarter), not bad, not bad at all
📊 The Job Market: just like the summer, less crazy hot, but still hot & strong
📊 The Consumer aka People: out & kicking strongly: holidays, consuming, investing
📊 Interest Rates & Yields: peak rates & yields rather sooner than later
📊 Real Estate: Mortgage rates, Housing: mortgage rates cooling off
📊 Inflation: cooling off, cooling off aka normalising
👍 The (R)ecession talk and 2024 Forecast: low probability, 1-2% growth in the cards
📊 GDP 📊
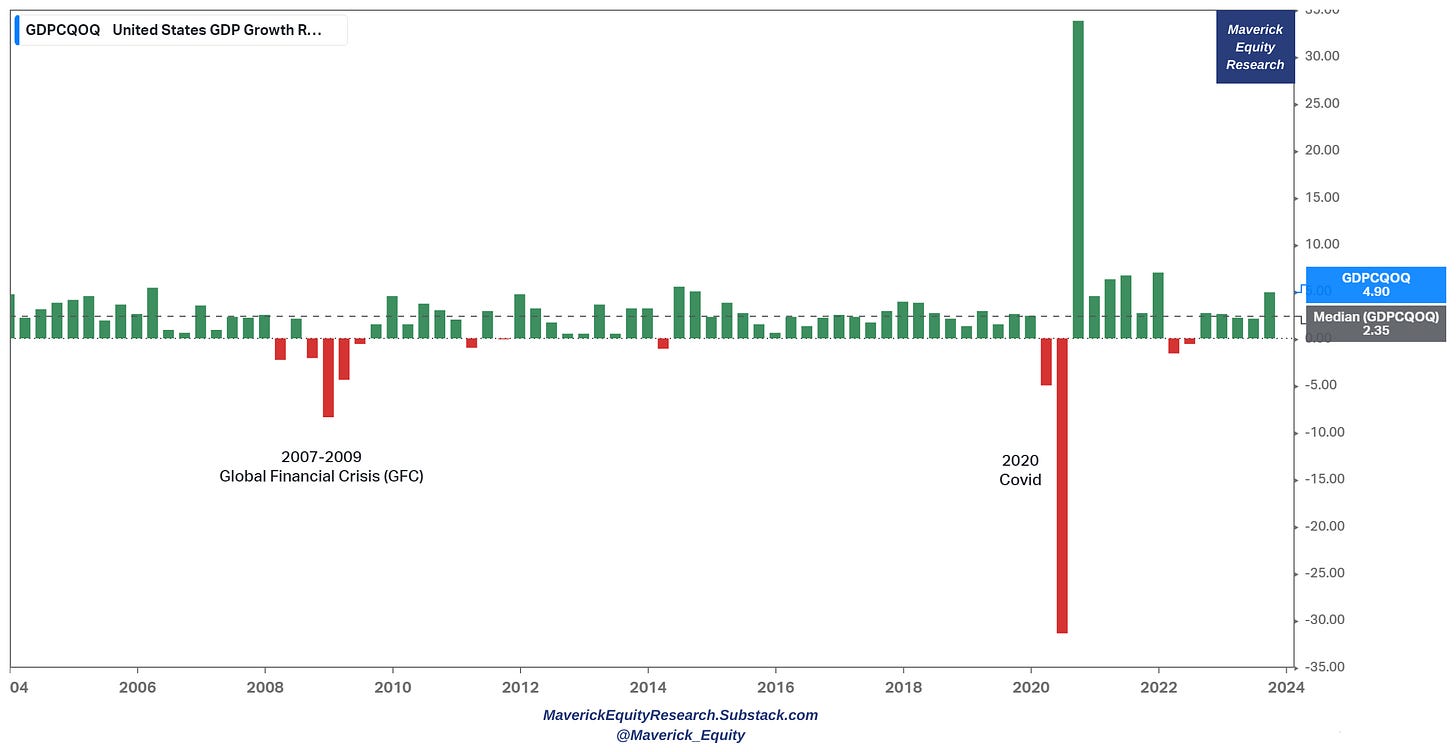
Q3 2023 real GDP increased at an annual rate of 4.9% (q/q) … not bad at all …
👉 Q3 increase driven by increases in consumer spending and inventory investment. Imports, which are a subtraction in the calculation of GDP, increased. Overall, 14 of 22 industry groups contributed to the Q3 increase in real GDP
👉 the 4.9% growth rate is more than double the 2.35% median in the last 20 years
👉 note also the 2007-2009 recession, and also the 2020 Covid down & up swing
👉 reminder: every 6-8 years we get a recession, it’s just the business cycle … things recover, having a plan for when (not if) it happens makes it easy to weather the storm
Q4 2023 +2.2% (q/q) via the Jan 10th 2024 GDPNow Altanta FED model estimate:
👉 consumer spending looking good while inventories and imports a drag on growth
👉 the same metric but complementary where we can see a lower consensus at 1.5% and also the range of the top/bottom 10 average forecasts
Addressing 3 misconceptions or lack of rigor that I have seen around this often:
👉 Atlanta FED GDP growth estimate is not nominal, but real after counting inflation
👉 best viewed as a running estimate aka a ‘Nowcast’ based on available economic data for the current quarter, and not an outright ‘Forecast’ of real GDP growth - also note that it is not an official GDP forecast from the Atlanta FED
👉 no subjective adjustments - based solely on the mathematical results of the model
Given US = biggest economy, we have many economic forecasters - fun fact: these days the dispersion of estimates remains near 40-year highs, let that sink in!
📊 The Job Market 📊
Unemployment Rate (UR) at a very low 3.7%
👉 materially below the 20-year median at 5.1% and has now been below 4% for 23 straight months which equates to the longest streak since the late 1960s
👉 the unemployment rate never got lower than 4% once in the 1970s, 80s or 90s
👉 note also that the 3.4% in April 2023 was the lowest since 1969 … let that sink in!
👉 who would have imagined that after the 2020 Covid panic (bigger even than the 2007-2009 GFC) that we will recover that fast? Amazing what the economy can do!
My fun fact on the unemployment rate: it’s one of those metrics that when it’s high you hear very how bad that is, and when low you hear the exact same thing as many say it signals an impeding recession. My take is simple: a low unemployment rate is always good in my book and it does not signal a recession (not a leading indicator).
America’s Smallest Employers Have a Record Share of Openings via WSJ:
👉 America’s smallest employers have the highest share of job openings on record—more than 1 in 5 available positions ready to be filled
👉 nowadays also small companies can have superpowers thanks to the technological changes that happened during the pandemic: easier scaling, higher efficiency, wide distribution, IT, marketing are now accessible also to the ‘little guy or girl’
A labor market that is strong and inclusive is a strong development because normally when things are bad, small businesses take the hit quite some … now nowadays!
Wondering which sectors will see the strongest employment growth in 2024? Via WSJ:
Initial Jobless Claims (people filing for unemployment benefits) down big time to 202k which is back to 2019 pre-pandemic level, and materially below the 237k median. It sank by 18,000 to 202,000 in the last week of 2023, firmly below market expectations of 216,000 to mark the lowest claim count since October.
Continuing Jobless claims (1-week lag metric measuring people who have been receiving unemployment benefits for a while) also hovering around 2019 pre-pandemic levels with 1,855m and 1814m median.
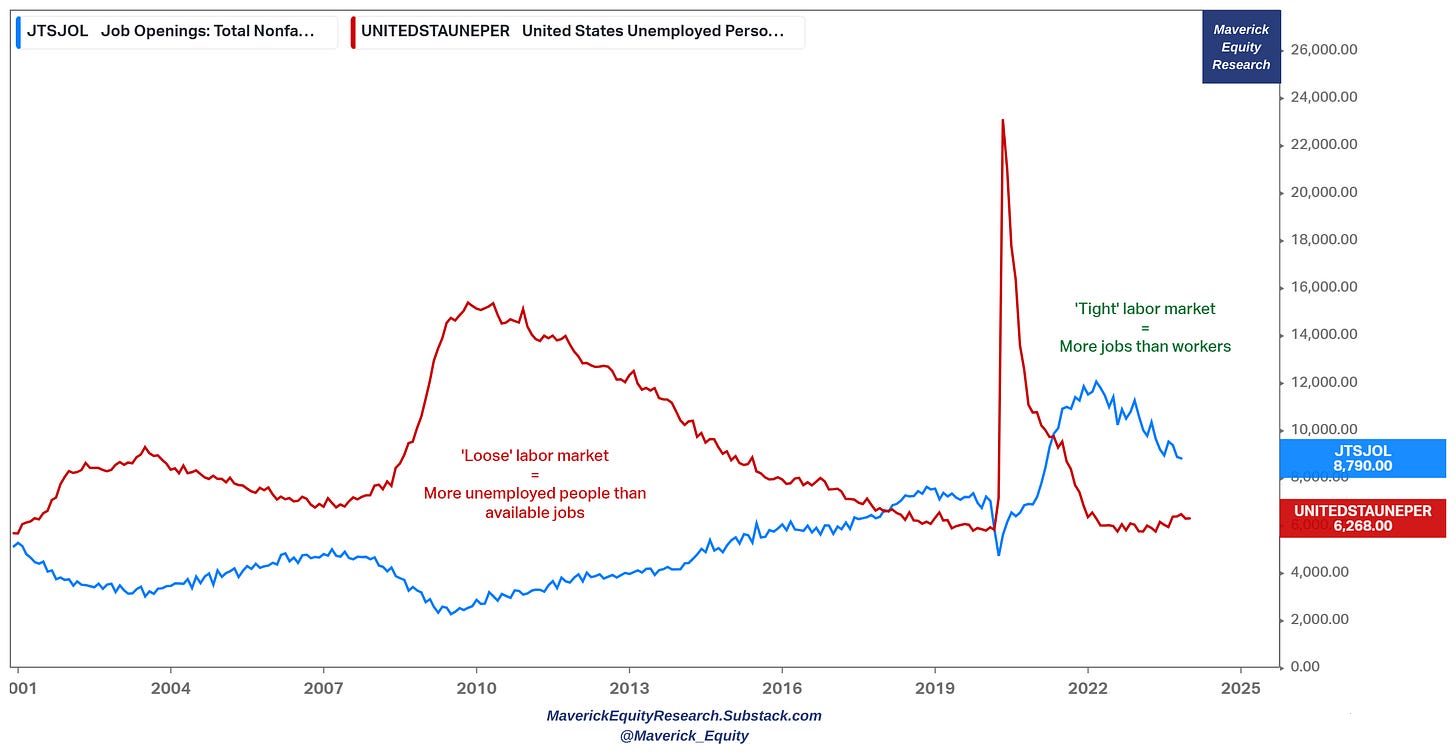
Job Openings ‘JOLTS’ (Total Nonfarm) also show the strength in the labour market:
👉 8.79 millions of available jobs ready to be filled
👉 1.5+ million extra jobs out there compared to pre-pandemic levels
👉 4+ million jobs ready to be filled added relative to the pandemic bottom
👉 the recent drop is material while still my view on it is positive & simple: it's a plus reserve to have that many jobs ready to be taken
👉 additionally, N.B. the FED wants a bit looser job market in order to chill a bit with the fastest hiking cycle in recent decades and continue cooling off inflation
Therefore, should we slow down from here, there are more than decent 'job reserves’ available … that acts like a cushion which is nice to have.
For further insight, a view closely watched by Fed Chair Powell and other FED leaders (as one of the factors driving inflation): Job Openings ‘JOLTS’ (blue) & Unemployed People (red) as a telling visual if the job market is at any point in time ‘loose’ or ‘tight’:
after the 2007-2009 GFC we had for quite a while a ‘loose’ labor market
while now after the pandemic a ‘tight’ one after a great & fast recovery as the economy not just recovered the lost jobs from the pandemic but added way more
The 2 above now as a ratio: Job Openings to Unemployed People: at a nice 1.4x!
👉 job vacancies still exceed the number of unemployed by more than 40%
👉 prior to the pandemic it was about 1.2x and it peaked at 2x in 2022
👉 simply put, we have 1.4x job openings for every unemployed person = historically a great time to be looking for work and negotiating a decent salary ...
👉 the fact that lately the ratio is good as it helps cool off inflation
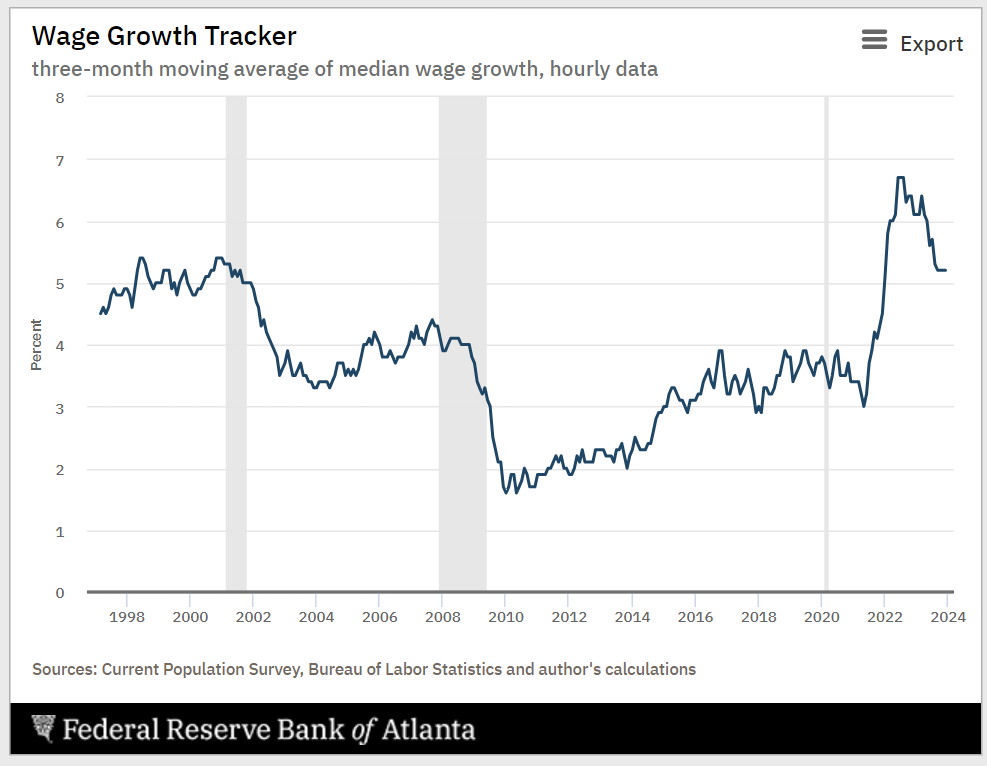
Next, does this from above translates into reality via wage growth? Yes, +5.2% wage growth for December 2023 which is both a driver of and a hedge against inflation
👉 income from labour = the primary funding source of all consumption
👉 when that does well, consumer spending will naturally just follow (more on that below when I cover the consumer)
📊 The Consumer aka People 📊
👉 the American consumer surprised economists again & again after the Covid outbreak as spending kept trending up & up … the job market helps a lot for sure …
👉 we know & often hear that the Consumer (Consumer Spending) is 70% of the economy - I would extend that and say that the Consumer IS THE Economy with our collective decisions to spend, save & invest. It usually drives growth during economic recoveries (pandemic rebound) and is key for overall economic growth …
👉 people are now out & kicking: holidays, consuming & investing …
N.B. Personal Consumption Expenditures (PCE) accounts for about 2/3 of domestic spending and is a significant driver of GDP
The University of Michigan Consumer sentiment jumped in the latest December reading: a good chunk of the increase is due to less concerns over inflation
Sentiment is also backed by hardcore credit and debit card data via BofA which suggest consumer spending is holding up in December.
“Total card spending per HH was up 1.3% y/y in the week ending Dec 9, according to BAC aggregated credit and debit card data. Spending on holiday items fell 1.5% y/y in the week ending Dec 9. … However, in the 16 days since Thanksgiving, spending on holiday items was up 0.8% compared to the same period last year.“
Goldman Sachs also has a positive outlook on the consumer: the near-record level of Household Net Worth should continue to support spending and implies that the saving rate should remain low by historical standards
Plenty of headlines say the ‘Consumer is in bad shape’: that it is squeezed by the FED’s high rates, inflation, but let’s look at a key chart that is not much mentioned: US Households: Checkable Deposits & Currency Held for insight into the liquidity position of households (amount of funds individuals hold in readily accessible forms).
👉 After the government fiscal stimulus, I do not see a bad shape, but a big cash reserve that went up from $1 trillion in 2019 to $4.2 trillion now. This amount equates to about $17k per US citizen for more than 4x cash today than available pre-pandemic.
👉 recall, that is after a pandemic, a recession, inflation, fastest FED hiking cycle in decades, war in Europe & recent banking turmoil
👉 just like with the job market, there is a big cushion here as well
📊 Interest Rates & Yields 📊
US yields: 1y 2y 3y 5y 10y 30y with a 20-year lookback period:
👉 3 hiking cycles in 20 years: not the 1st one nor the last one I tell you that
👉 currently above the 2015-2019 period, and a bit below the 2004-2009 cycle
Where are we headed? FED interest rates pricing via the Fed Funds Futures:
👉 1st cut in this cycle likely to happen in March (61.5% probability): when the 1st cut happens, often stocks get a boost (lower discount rate / cost of capital = higher valuation) compared to lower-yielding fixed income assets
👉 5 cuts priced in to happen for the whole 2024
Takeaway: peak interest rates aka ‘peak FED’ should be here rather sooner than later!
For a very complementary angle:
👉 FED funds target rate naturally highly correlated with the 2-year yield
👉 as the 2-year yield started going south … expect FED funds rate to follow
📊 Real Estate: Mortgage rates, Housing 📊
Mortgage rates:
👉 with inflation cooling off & the FED about to cut rates, naturally the 30-year mortgage rates cooling off as well from a 20-year record of 7.79% to now 6.62%
👉 note the median of 4.46% is way below the current rate
Hovering now above the 2006-2008 peak levels, 2 key notes for true insight:
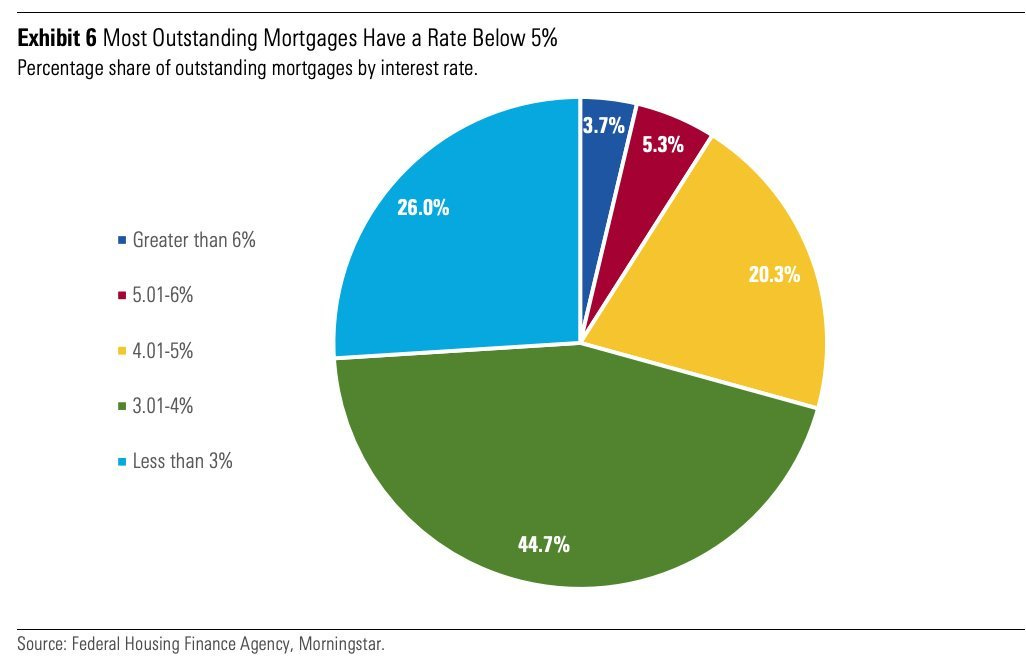
👉 distribution of mortgages by interest rates paid: 91% of people have a rate BELOW 5% which is close to the 20-year median of 4.46%. Detailed breakdown:
26% have a rate under 3.00%
70.7% have a rate under 4.00%
91% have a rate under 5.00%
96.3% have a rate under 6.00%
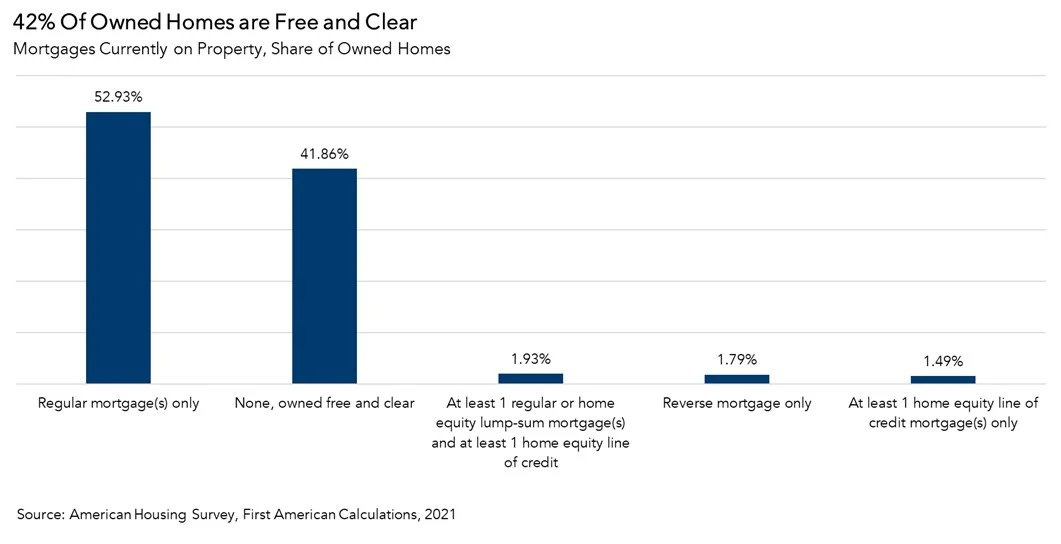
👉 How many owned US homes are free and clear from a mortgage?
42% in 2021 of all owner-occupied homes in the U.S. were owned free and clear, up from 34% percent in 2011. Of those who owned their home free and clear, nearly 78% were owned by homeowners aged >55
Q1 2024 nowadays very likely higher: maybe even 45-50% given that homeowners aged >55 should be close to the end of the mortgage payment schedule
Combining the 2 above we have actually the story: if 42% of homes (likely more in 2023) are owned outright + 71% of mortgages below 4%, we can deduct that in excess of 80% of homeowners do not feel much the effect of high current mortgage rates.
Are residential constructions halted or dropping ? Not at all:
👉 1,560,000 privately‐owned housing starts which is way above the 1,204,000 median for the past 20 years
👉 notice the big uptrend after the 2007-2009 subprime mortgage crisis was resolved, and the 2020 Covid interruption
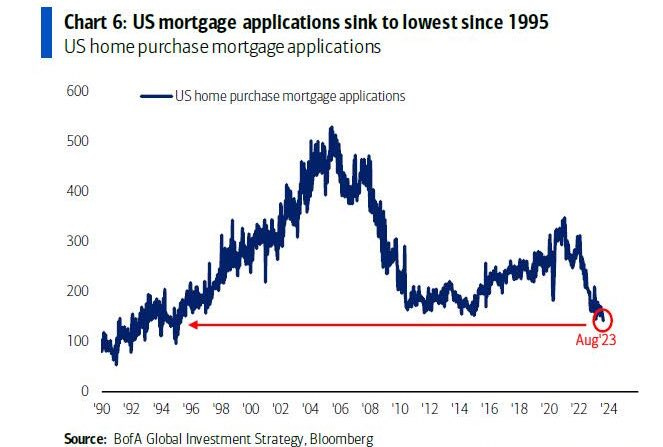
Easy for new people to take mortgages now? No, mortgage applications are at the lowest since 1995. Americans ages 18-38 are buying fewer homes than ever … however, at no point in time everybody can be happy.
Until things settle (interest rates are normalised), renting is quite a cheaper alternative than buying a home: US Housing - Monthly Cost of Buying vs. Renting:
👉 median rent about $1,850/m = 30% cheaper than the median cost to buy at $2,700/m
👉 = gap represents the largest difference between renting and buying in U.S. history … let that sink in!
Renting specifically, asking rents posted the biggest decline in over 3 years via Redfin:
“The median U.S. asking rent declined 2.1% year over year in November to $1,967 — the biggest annual drop since February 2020 — and fell 0.6% from October.“
Therefore, headlines are more doom & gloom than they should when it comes to the real estate market overall. But for clicks and views for advertising revenue they will keep rolling, and once interest rates, yields & mortgage rates will go down, headlines will find something else to beat the drum.
The Rise of Negative Media is now a confirmed phenomenon via solid research besides my own personal observation … a quick take and summary you can read here.
📊 Inflation 📊
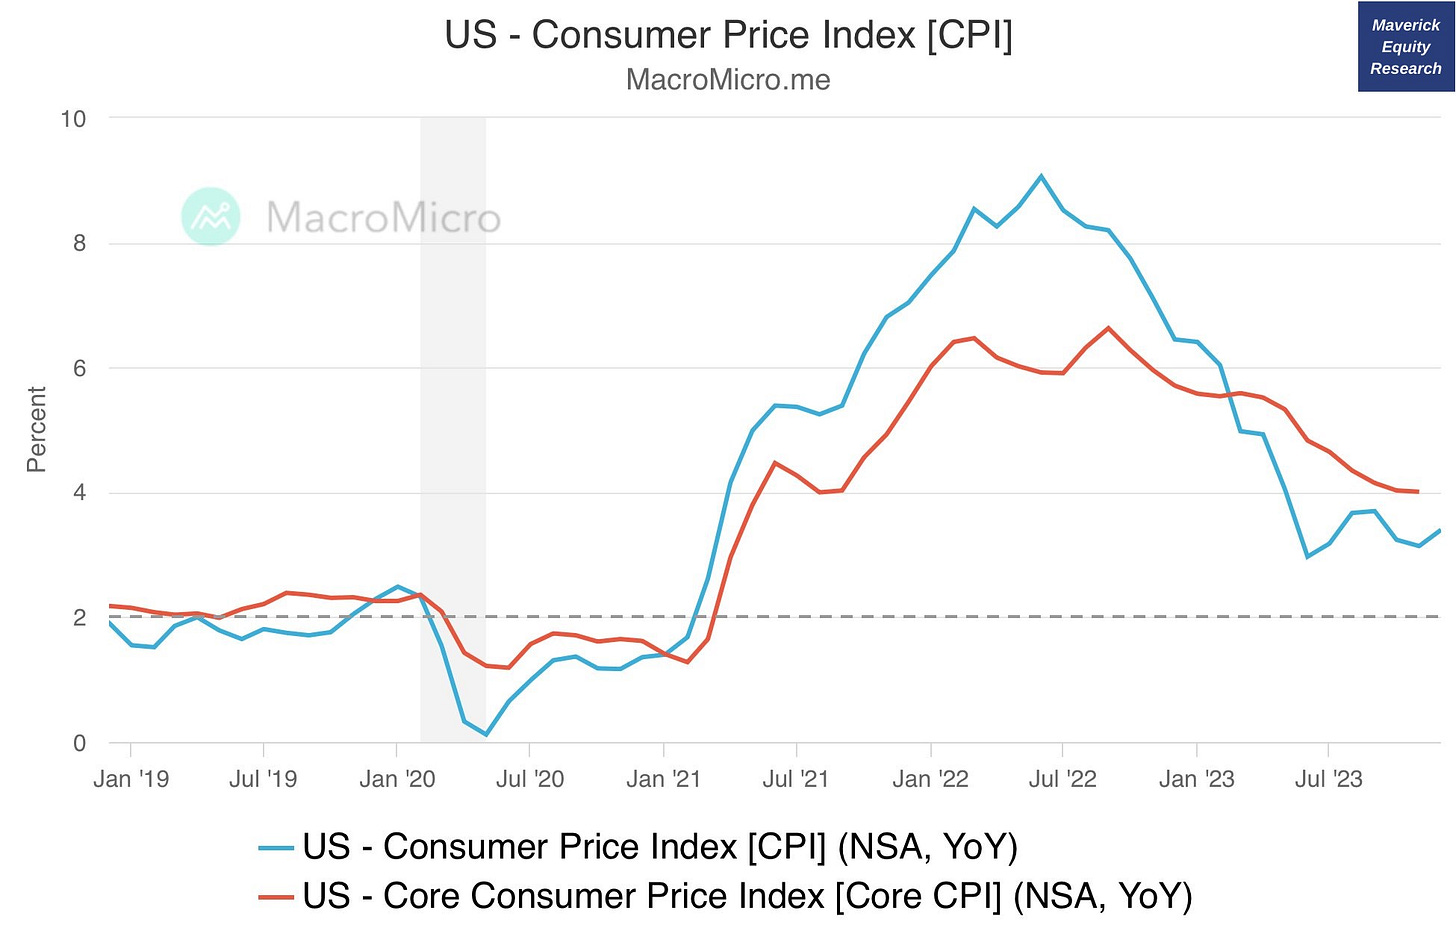
After peaking in June 2022 at 8.9%, inflation reversed and fell to 3.4% following the key driver M2 money supply growth rate at -2.66% currently. The latter turned negative in Q4 2022 for the 1st time since 1933. Yes, almost a century! Let that sink in!
Therefore, if inflation is primarily monetary phenomenon (which is in my opinion), how could it not keep going down? US CPI Y/Y (blue) & M2 growth Y/Y (red):
Core Inflation Rate is a bit higher at 3.9% relative to the 3.4% CPI, though both trending down as inflation gets more and more normalised
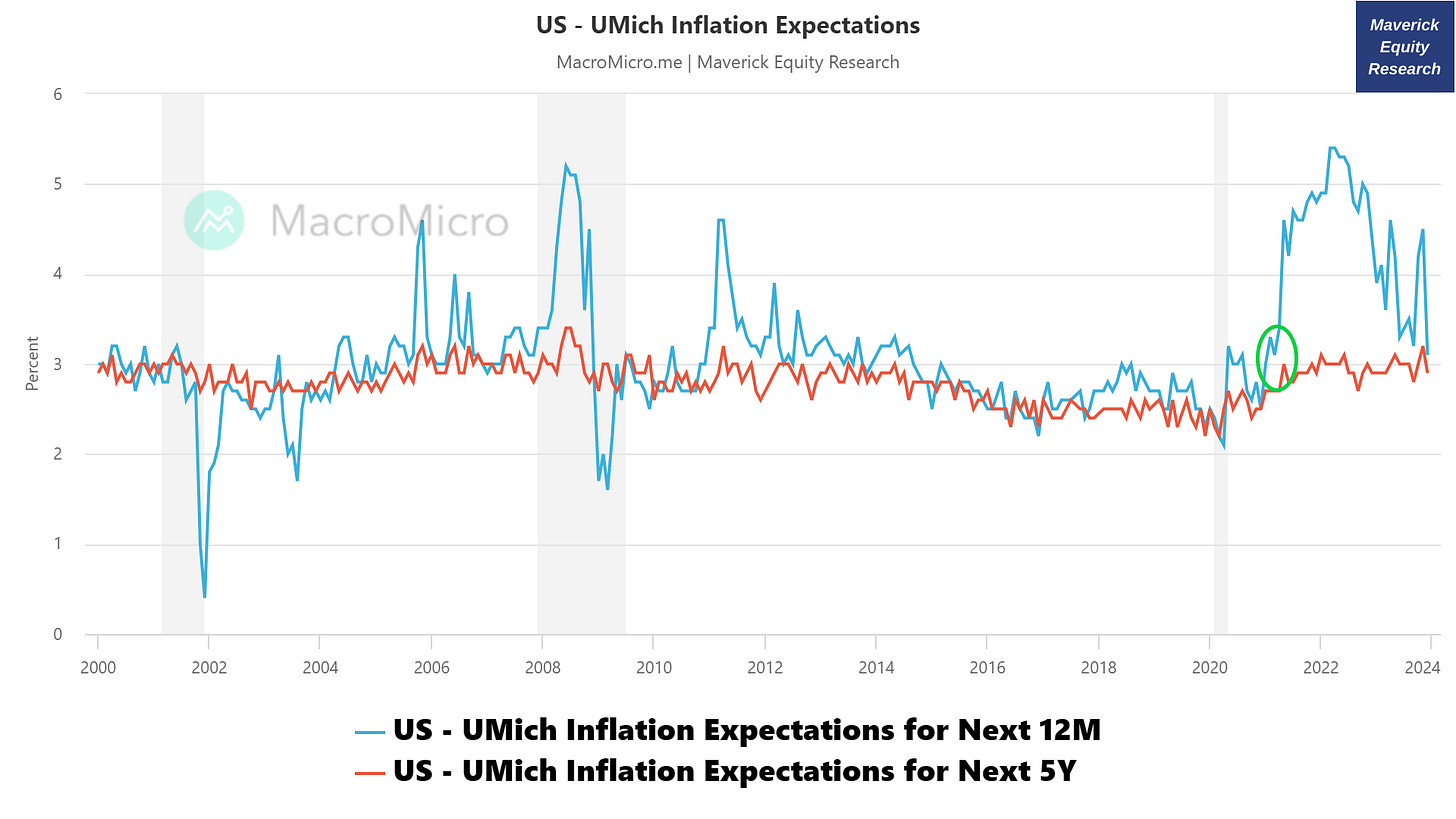
Now that we saw the actuals, what about the key question on inflation expectations?
US University of Michigan Inflation Expectations:
👉 1-Year Inflation Expectations metric points to a 3.1% figure after the 2022 parabolic spike … cooling-off big time …
👉 note how the 5-year ahead expectations never took off materially given that the expectations are that central banks and governments will always manage to control inflation/deflation every time it pops up big time
How I and you should use this in the real world?
👉 check when both spike up in the same time, hence confirm each other as I noted in the green circle right before we got the big inflation times - in reverse now, we will likely see inflation stabilise
New York Fed’s December 2023 Survey of Consumer Expectations - median inflation expectations declined at all horizons:
👉 the 1-year ahead horizon reached the lowest level since Jan 2021: from 3.4% to 3%
👉 at the 3-year ahead horizon, it fell from 3% to 2.6%
👉 while at the 5-year ahead horizon, down from 2.7% to 2.5%
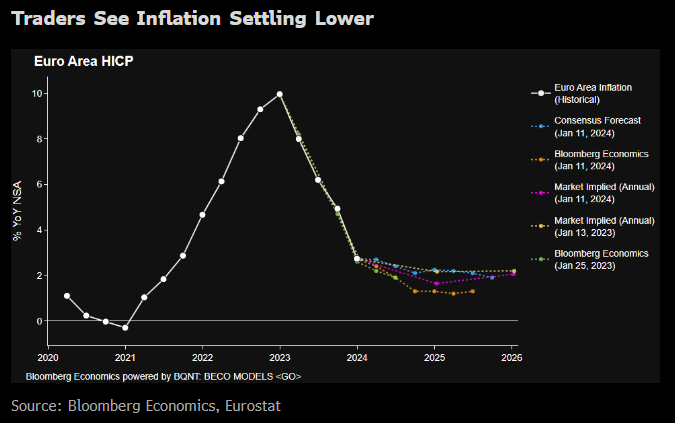
Side note on Europe given that inflation is naturally not a US phenomenon:
👉 swap traders more confident than the ECB on lower inflation: traders pricing inflation at 1.6% in January 2025 (down from 2.2% a year ago)
👉 while the ECB still sees inflation staying above 2% until 2H25
Last but not least, FED’s latest statement from December 2023 on the inflation target: “Inflation remains well above our longer-run goal of 2%. … It will take substantially more evidence to give confidence that inflation is on a sustained downward path.”
N.B Inflation special report coming out soon from my side … stay tuned!
👍 The (R)ecession talk and 2024 Forecast 👍
I am into the no recession/soft landing camp. Now a very common question I get is: ‘What metrics and/or models you look at to track the business cycle and the likelihood of a recession at any point in time?’ Well, there are many out there that I look at and use: one day I will compile all of them into a comprehensive article and overall framework.
Nowadays, among many other I look particularly at the following 10 metrics & surveys:
Philadelphia FED Recession Probability Index also cooling off below 40% levels
👉 note that this metric tracks the probability for the current quarter, next and 1 year ahead with an overall signal sensitivity/focus more to the current and next quarter
👉 as well, to be used in practice in tandem with all it’s 3 parts and also other complementary business cycle / recession indicators
FED / FOMC view via the meeting’s minutes:
👉 in the July 2023 FOMC meeting, Chairman Powell indicated that staff economists no longer forecast a recession
👉 while the R-word "recession" doesn't appear even once in the minutes from the last three meetings (which took place between September & December 2023)
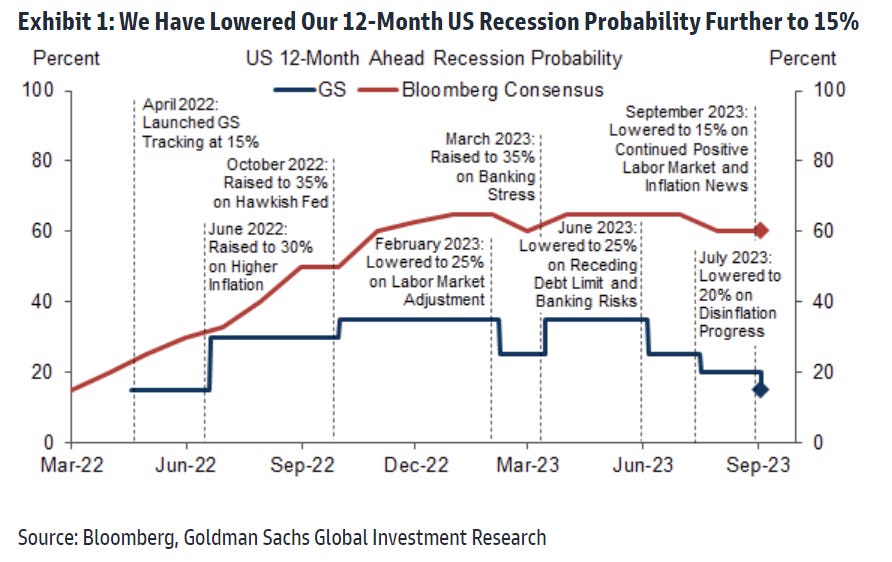
Goldman Sachs lowered further their 12-months ahead recession odds from 20% to 15% backed by the positive developments on inflation and the labor market
👉 15% is equal to the average historical probability calculated from the fact that a recession has occurred roughly once every seven years since WW2
👉 US GDP is projected to expand 2.1% in 2024, compared with 1% for the economist consensus forecasts surveyed by Bloomberg & the FED FOMC’s 1.4% growth
Business & academic economists surveyed by the WSJ (conducted Jan. 5-9 2024) lowered the probability of a recession within the next year to 39% from 48% in the October survey
👉 note how in both the 2007-2009 GFC & the 2020 Covid short recession it spiked to +90% probability - key takeaway: next time whenever this happens and we reach those levels, it’s a good signal of the worst being behind us and the road to recovery is on … likely a time when equities are bottoming also and time to pick some cheap goodies ...
Real-time Sahm Rule Recession Indicator: due to historical low levels of unemployment rate, the indicator is not signaling a recession
Background: FED economist Claudia Sahm approach - if the 3-month moving average of unemployment rate exceeds 0.5% compared to the previous year's low, the economy is in a recession or will enter one soon (condition met in past recessionary periods).
NBER Recession Indicators Drawdown: no sign of recession here either
FED Excess Bond Premium Recession Probability: a further lower 14.46% current probability (December 2023 reading) which dropped from the previous November 2023 reading of 18.81% - and hasn't reached close to levels observed during crisis periods
FED Financial Conditions Impulse on Growth (FCI-G): after heavy tightening of financial condition in order to cool-off inflation, financial conditions are not tight anymore, hence not longer a drag on overall GDP growth
Goldman Sachs Financial and Credit conditions: impact of changes in financial conditions and credit conditions on GDP growth will swing from a 0.8% drag in 2023 to a 0.4% boost in 2024 (supporting their above-consensus growth forecast)
2024 Election Year = Eyes on Washington Baby
👉 via Goldman Sachs: fiscal policy has become somewhat more expansionary in presidential election years on average
👉 as it looks now, no big fiscal stimulus is to be expected, but should we have some material weakness in Q1/Q2, I think stimulus will likely be deployed
Overall take for 2024
👉 GDP to grow in 2024, yet lower than in 2023 which in turn is actually good in order to cool off inflation and interest rates
👉 Should growth take a hit and about to go negative, intervention is possible and quite likely, especially as we have an election year
👉 hence, probability of a recession in 2024 is low
Main takeaways for nowadays but also for the future
👉 The business cycle is the business cycle: I learned about it in the 10th grade at the Economics basics class and we have no reason for it not to be valid going forward:
every 6-8 years we do get a recession
since WW2, recessions last an average of just 11.1 months
the last economic expansion: started after the 2007-2009 GFC & lasted 10.6 years
👉 Implications of any recession vary with each individual situation, my key notes:
as an entrepreneur: hiring, CAPEX/investment and other major business decisions
as a trader: risk management, hedging, liquidity
as a medium-long term investor it really does not matter much as long as one has a solid portfolio i.e. owning stocks should be treated like they truly are, pieces of business, not moving tickers on a screen (never confuse investing and trading)
I was DOWN 52% during the 2007-2009 GFC & that bear market lasted almost 2 years, 2020 Covid indiscriminate selling & the 2022 bear market was peanuts in comparison, hence it shall be easy to go through the next one as well
Remember, the market is structurally net long which is way too often forgotten given the constant news and headlines, or simply not known! If you believe our species will evolve, societies & economies will also. And that will simply be reflected in higher investment portfolios values! Keep compounding!
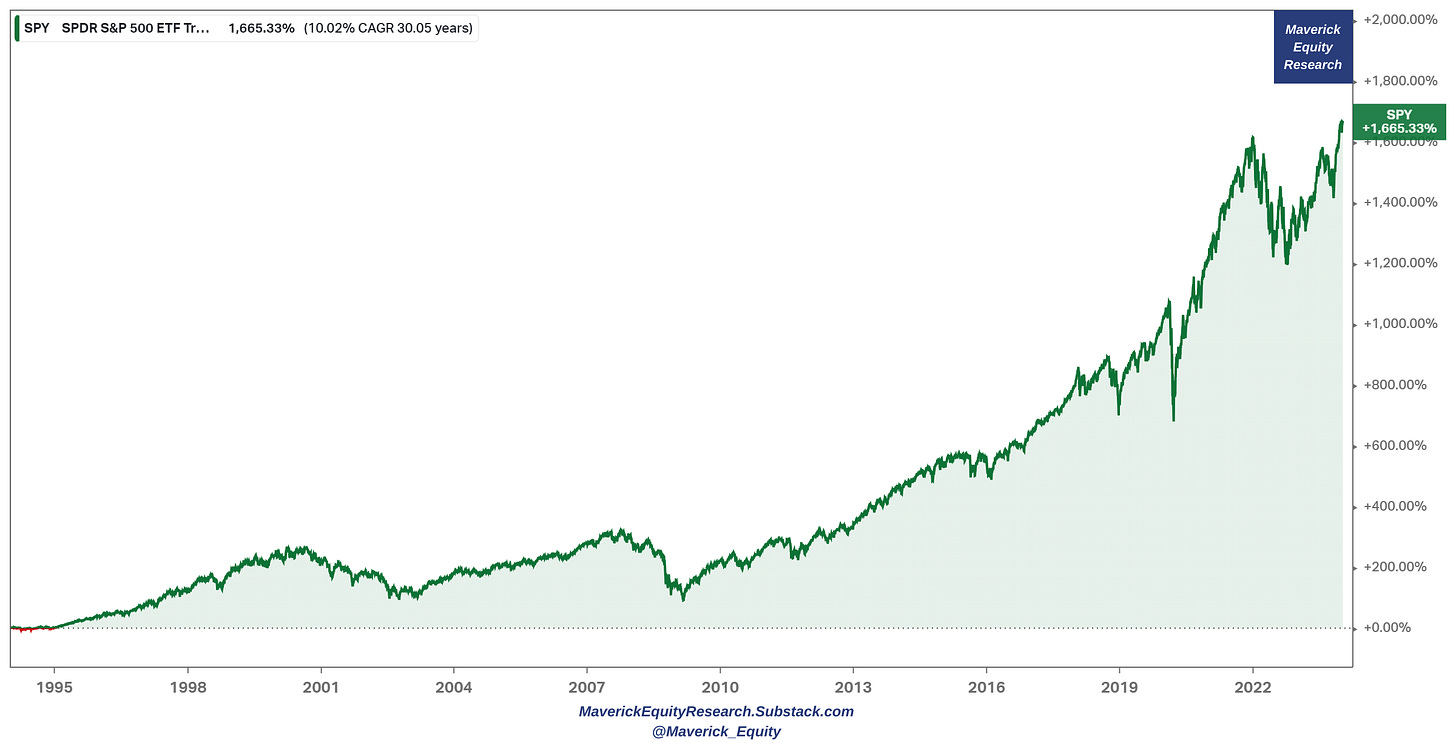
👇 S&P 500 last 30 years: 1,665% return with a 10% CAGR 👇
Research is NOT behind a paywall and NO pesky ads here unlike most other places!
Did you enjoy this extensive research by finding it interesting, saving you time & getting valuable insights? What would be appreciated? Sharing it around with like-minded people and hitting the ❤️ button. This will help me bringing in more & more independent investment research: from a single individual, not a company of any kind!
Also some of you asked how can one support my work which is really kind of you 🤗. Therefore, it would highly appreciated if you would support the ‘Maverick-esque’ ongoing & future research. Some of you asked if they can donate via CashApp, but I cannot open an account from Europe. A donation/tip can be done via the following:
Thank you and have a great 2024!
Mav 👋 🤝















Solid research. Thanks!
Great collection of data. Thank you for distilling the crème de la crème of macro data for the week.