✍️ The S&P 500 Report: Performance, Profitability & Special Metrics - #Ed 3
Breaking down the S&P 500 & the 11 Sectors via Sleek Charts - Edition #3
Dear all,
welcome to the 3rd edition of the S&P 500 Report, a unique & comprehensive report via data driven research & visually appealing charts that simply tell 10,000 words. A perfect time for another S&P 500 deep dive now that the Q2 2023 earnings are over.
N.B. This S&P 500 coverage focuses on Performance, Profitability & Special Metrics. Valuation lens will be covered in the dedicated ‘Valuation’ section, prior edition here: ‘Maverick Valuations #2 - USA: Dow Jones, Nasdaq 100 & the mighty S&P 500’
Structured in 6 parts + bonus charts & designed to have a natural flow:
📊 Performance Ins & Outs
📊 Earnings, Profitability, Flows, Value & Growth
📊 The 11 Sectors Performance Breakdown
📊 Sentiment, Seasonality, Volatility
📊 Technical Analysis: Short Term & Long Term
📊 Special & Alternative Metrics
👍 Bonus Charts 👍
📊 Performance Ins & Outs
👉 Bears Make Headlines & Lose Money, Bulls Make Money!
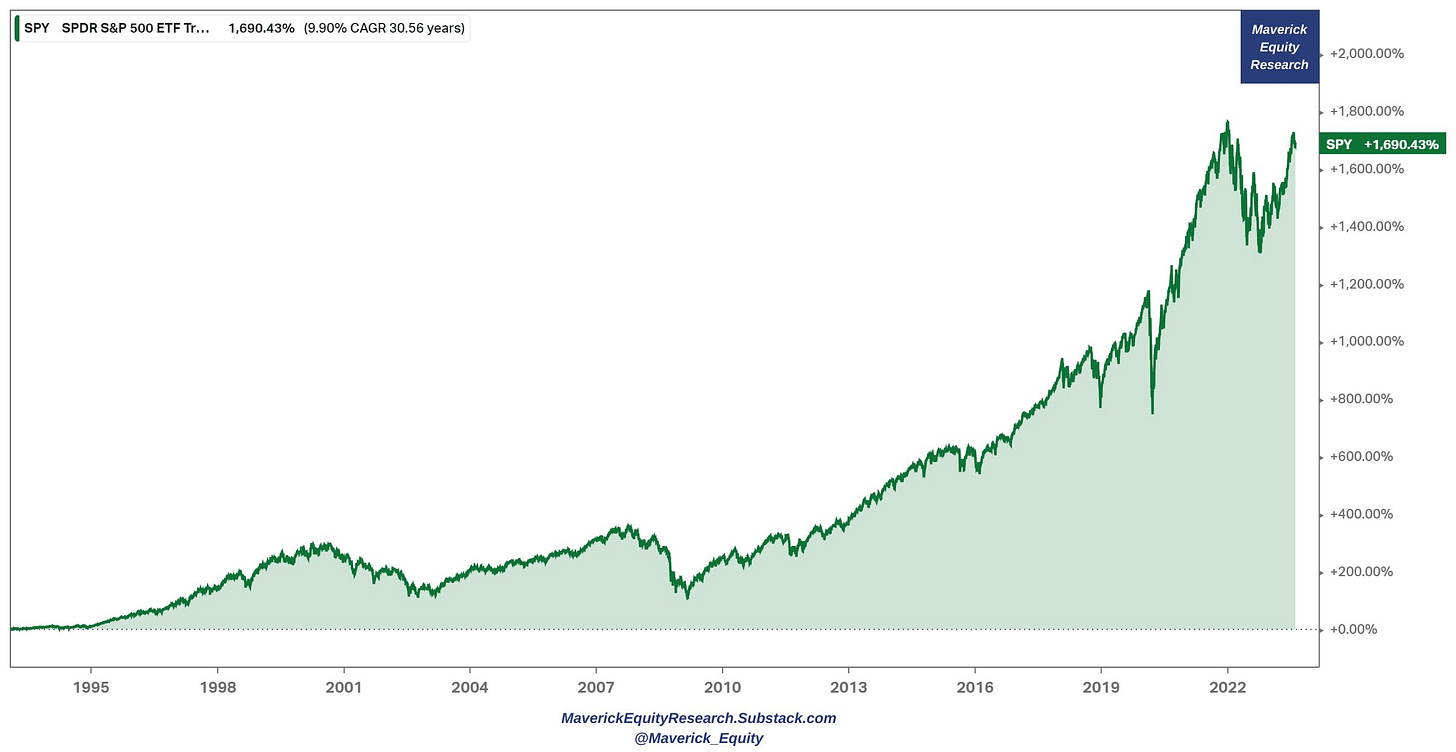
S&P 500 last 30 years: +1,700% return with 10% CAGR … compounding surely works …
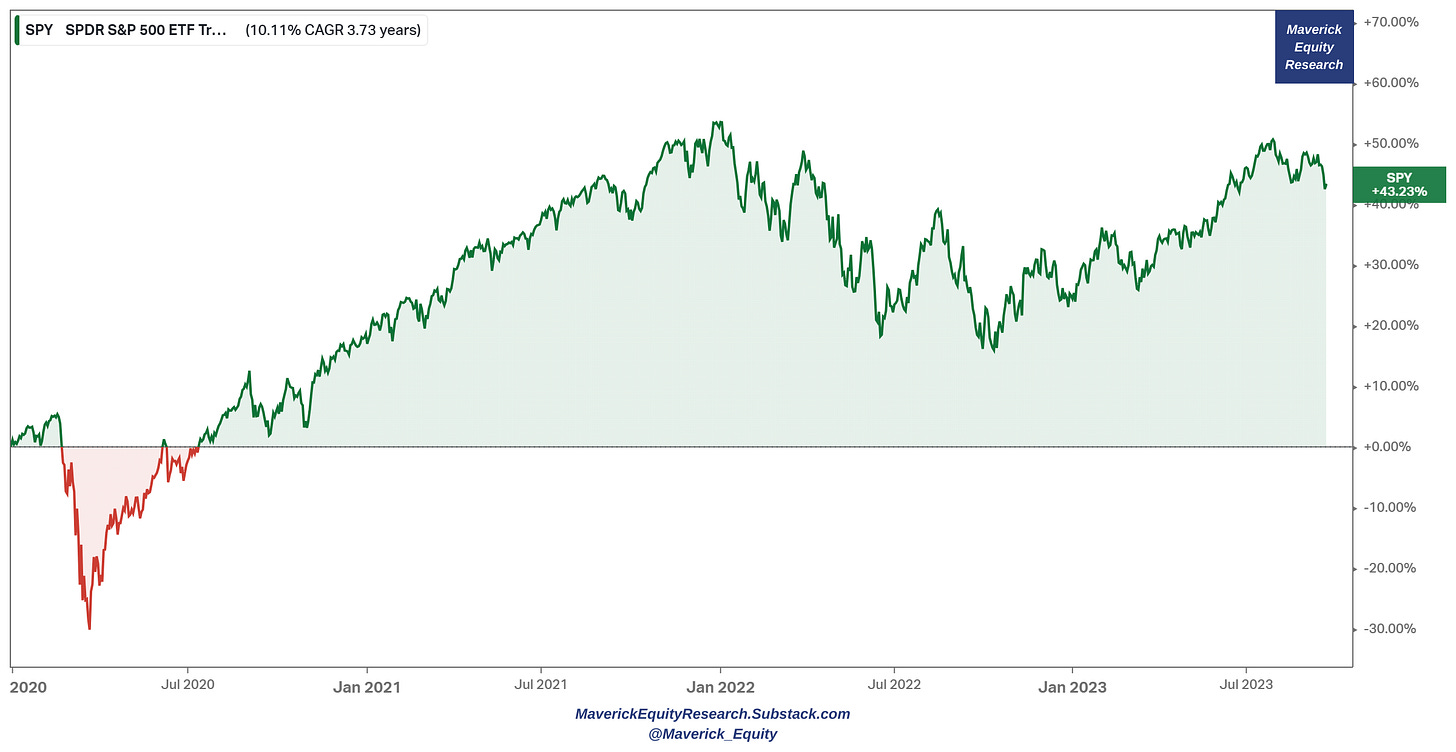
👉 Since 2020 we had many outliers: a pandemic, ramping inflation & interest rates (from 0% to 5.5%), an energy crisis, some banks that went bust (Credit Suisse in Europe, SVB & FRC in USA), a worldwide bottled supply chain & a war in Europe.
A key question now: how did the S&P 500 do despite all that?
+43.23% = 10.11% CAGR to investors = very very good given the recent context!
Recall “The first rule of compounding: never interrupt it unnecessarily.” Munger
for that not to happen, one should have a solid plan, a good broker that does not charge them very high fees, and consider taxes when optimising own investments
👉 2023 performance now: a great 14.46% with a dividend yield of 1.43%
👉 Key note #1: after we had the 2022 bear market (biggest since the 2007-2009 GFC), it follows the typical no-recession recovery path currently
👉 Key note #2: 14.46% return is concentrated in a few names or more distributed?
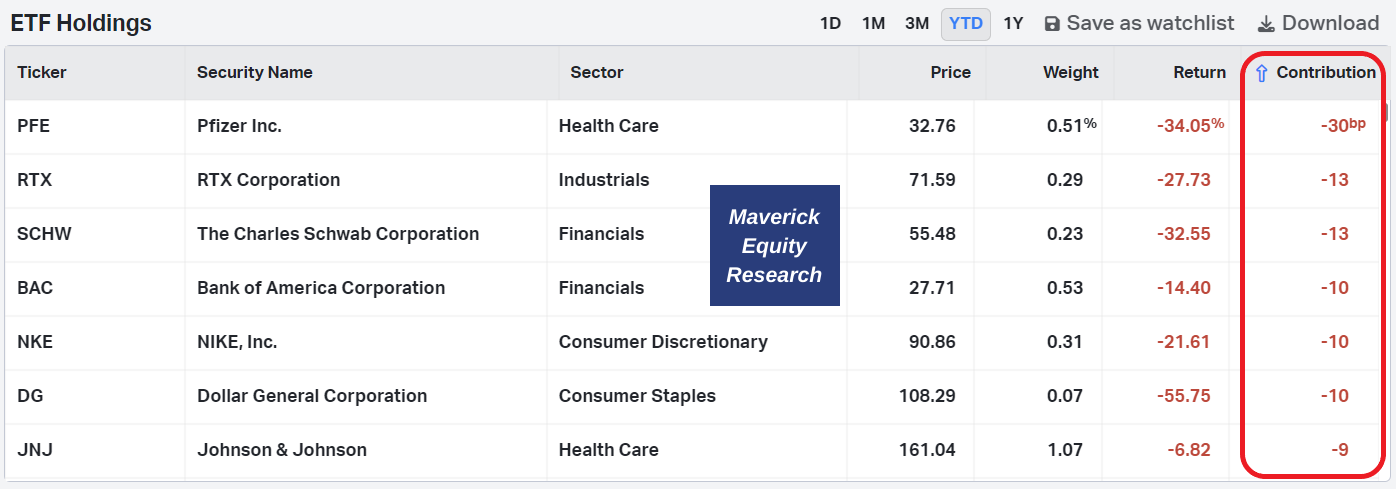
2023 % returns & the holdings weightings
return attribution analysis tells us exactly that 10.61% (1061 b.p basis points) are due to just 7 stocks, the M7 (Magnificent Seven) tech stocks: Apple, Nvidia, Microsoft, Amazon, Meta/Facebook, Tesla & Google/Alphabet.
hence, 73.37% (10.61/14.46) of the 2023 performance is due to the M7 tech stocks
Let that sink in! And bring the sink if you feel like 😉
The laggards are the following 7 stocks: their weight is small in the index, but note that most of the individual returns are materially negative in 2023: Pfizer, Schwab, Bank of America, Nike, Dolla General and J&J as household names
The major M7 stocks positive contribution is also showcased via the returns of the weighted (SPY) VS equal weighted (RSP)! The weighted SPY outperforming big time!
note that it started in March when the recent AI breakthroughs & narrative took over completely the center stage
I am quite certain that there will be big AI winners in the next 5-20 years, though also certain that many will pump their AI capabilities and real world use cases, hence hype is almost a given, hence down the road many will naturally deflate…
👉 now let’s ignore weighting and switch to the S&P 500 unweighted components via the following 2D chart: 2023 % returns & Above 52-Week Low %: Nvidia the mega outlier after the recent AI driven parabolic run, followed by Meta & Tesla
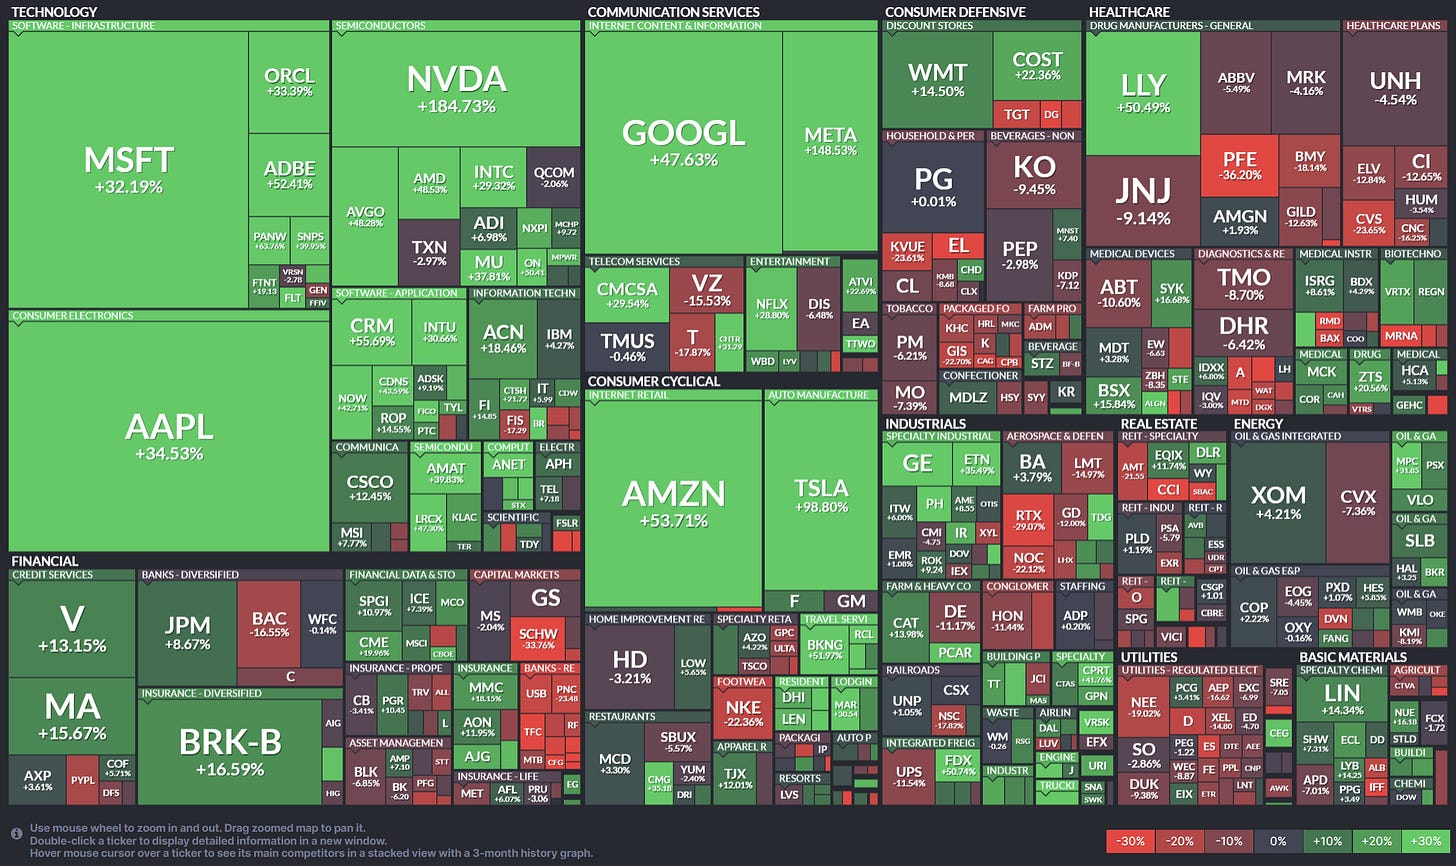
Complementary by single names in the 11 sectors and 24 industries, size = market cap
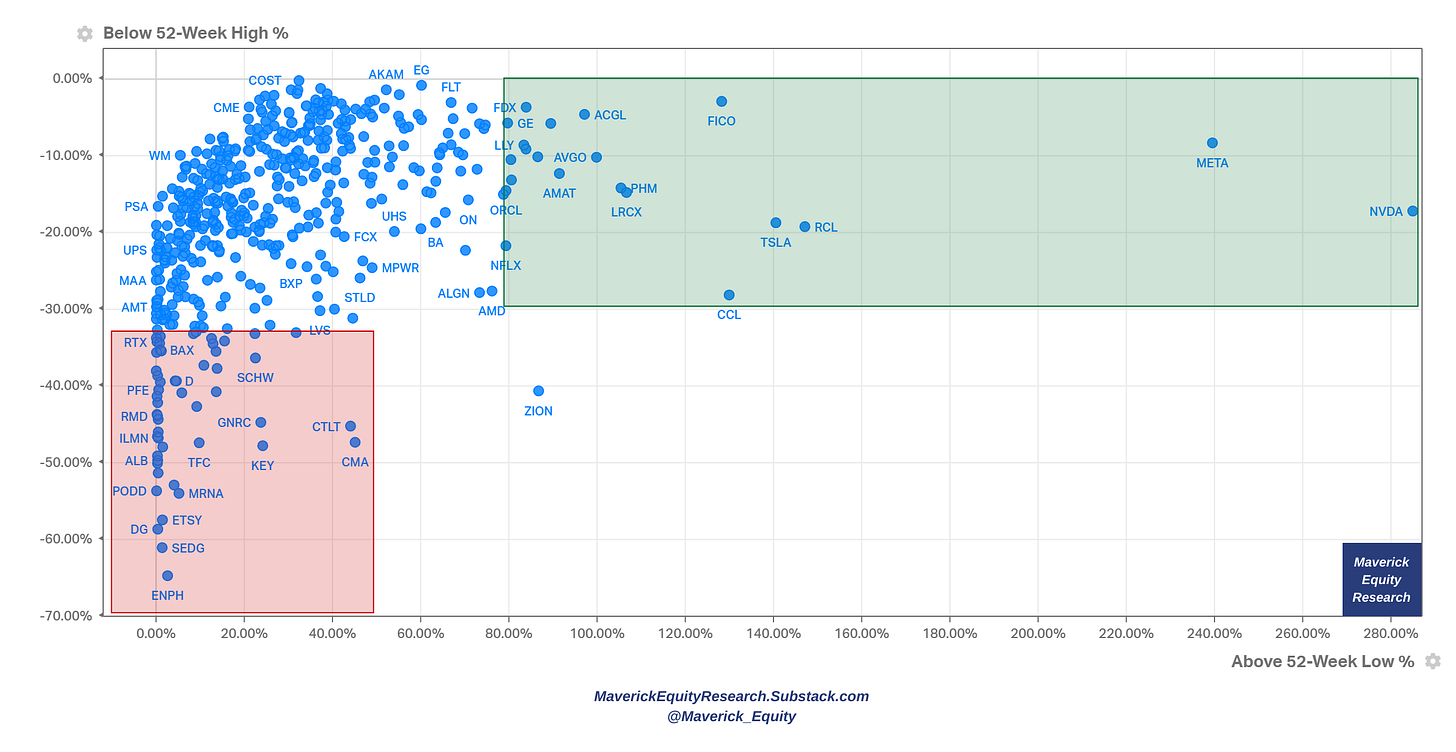
👉 continuing smoothly with the S&P 500 stocks above their 52-week lows & below their 52-week highs as my quick way to see both positive & negative momentum
if you see some of your names in one of the extremes, it’s interesting to relate to the other close clusters, peers or market overall and derive insight from there
📊 Earnings, Profitability, Flows, Value & Growth
👉 2023 Q2 earnings season:
revenue growth +0.5% going against the most anticipated recession ever talks
earnings growth -2.8% which is expected to be back positive in Q3 and taking off starting with Q4 … that is rather too optimistic in my view, but still I see expect decent positive developments earnings wise
👉 Profitability:
S&P 500 Net Profit Margins (ex-Financials & Energy) sequentially improving lately
S&P 500 EPS (earnings per share) forward 12-month & price
back to earth & more aligned after the FED (and fiscal policy) induced parabolic run once the Covid outbreak
when stock prices go way above earnings/EPS consider getting cautious ...
fundamentals matter always sooner or later. In the end it is all about earnings I heard on the street …
Complementary, the S&P 500 EPS Actuals & Estimates via consensus bottom-up:
221 for 2023 & 247 for 2023. No earnings recession on the horizon …
👉 Industry analysts median forecast +19.0% return in the next 12 months
imo likely too optimistic, I target for less & would be surely happy with less as well
Side personal note here, in investing (but not only):
better to have less expectations than high ones, if results are higher than it’s just a very nice and welcomed surprise
key to be realistic: would be great another 19% to compound on top of the 14.46% this year, but it will be tough with high interest rates which are seen now as they will be ‘higher for longer’ among other reasons
as you might have noticed, true and genuine research aims to stay grounded and withing what’s realistically possible: this is not a ‘trading room’, not a place where people are lured in for ‘multi-baggers’ ‘generational wealth’ ‘10-100x your money’ and get rich quick schemes … plenty of scams and places like that out there…
👉 S&P 500 (SPY) monthly financial flows (green/red) & total return (blue) since 2020:
2020 Covid crash: -$28.5bn in February, +$13.3bn with the March sharp rebound
2022 bear market: +$25.6bn in Dec 2021 right at the top, -$30.5bn in Jan 2022 to start the bear market and even bigger than the Covid crash, hence big outflows outliers are a good metric to watch for
2023: +$18bn in May as this time it was NOT sell in May and go away because they were bigger even than the October +$14.5bn local bottom which told us there is another leg higher in the 2023 rebound
Going forward, I do not expect extreme outflows nor inflows which are to be watched as reasoned above, while I aim for positive inflows in December for a Christmas rally.
👉 Value & Growth via the investing styles lens:
VUG growth (blue) +28.53% rally while VTV value (green) with just +1.24%
3-year timeframe: we see how value VTV value (green) did match VTG growth (VUG) for a good part of the 2022 bear market, now Growth is back big via the AI driven run!
More nuance via factors: growth (IWF) leading & momentum (MTUM) lagging in 2023
📊 The 11 Sectors Performance Breakdown
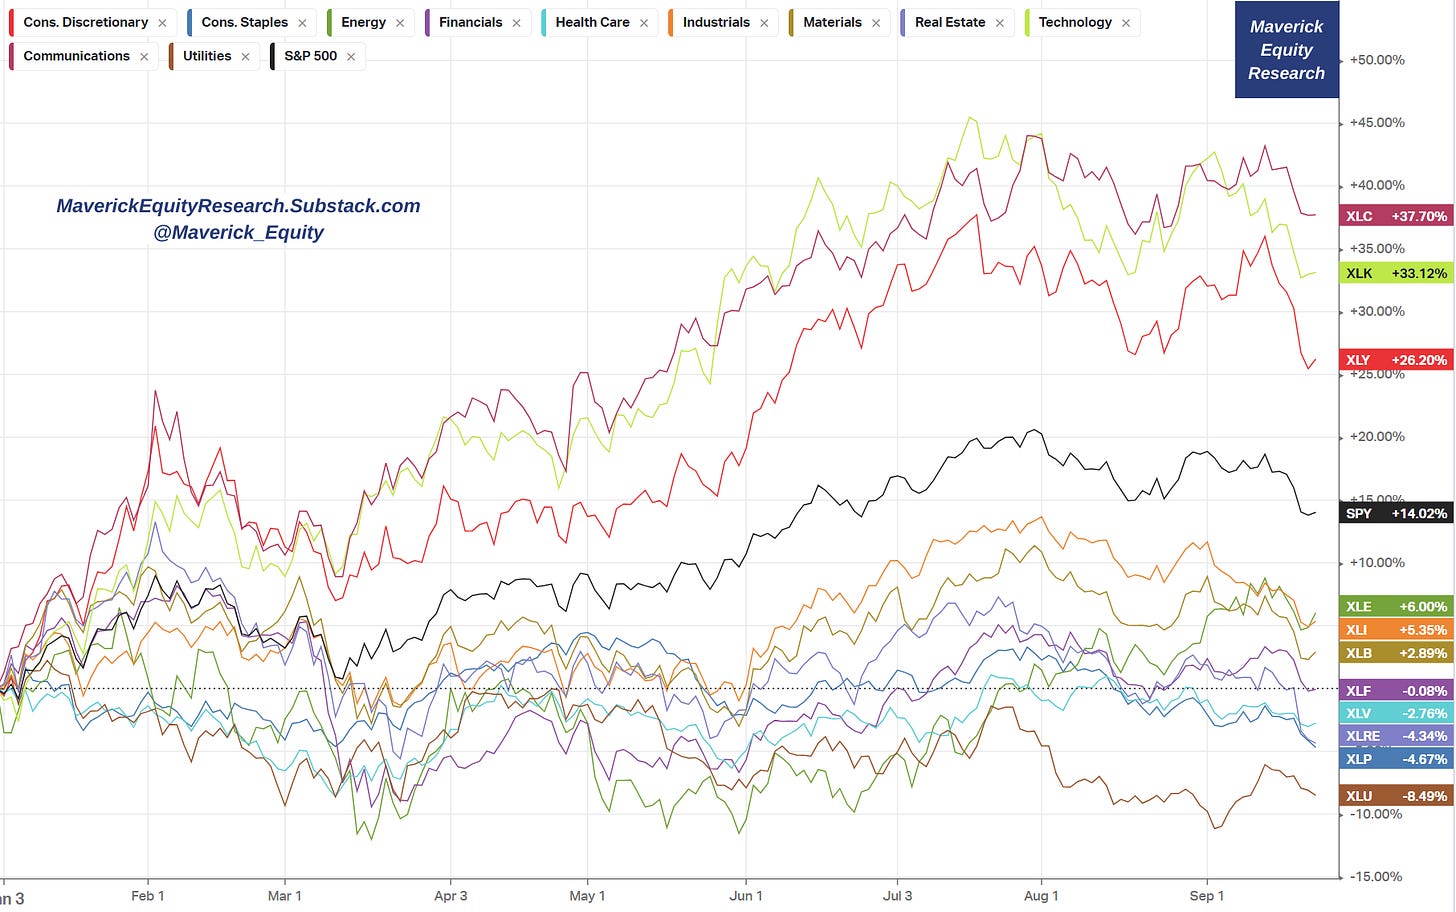
👉 2023 performance of the 11 Sectors that shape the S&P 500:
XLC (Communications) & XLK (Tech) & XLY (Consumer Discretionary) leading
46% huge spread between the Top & Bottom sectors which is very rare to see: XLC (Communications) + 37.7% while Utilities (XLU) -8.49%
👉 The 11 Sectors + S&P500 itself (SPY) with 2023 % returns & Above 52-Week Low % for an extra dimension and same key message:
XLK, KLC & XLY also with the momentum from their 52-week lows
note, energy is bouncing back also from the 52-week lows
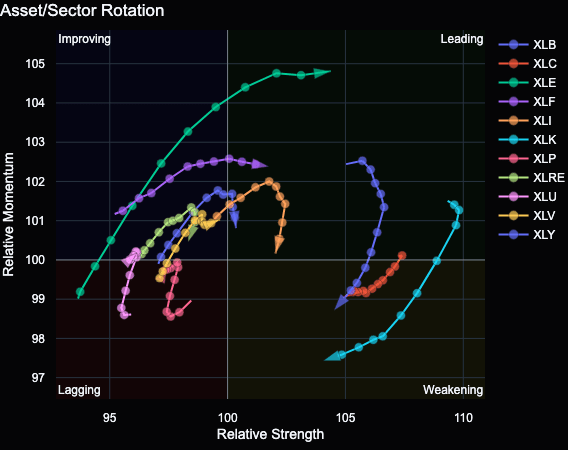
👉 Sectors rotation graph for relative strength & momentum dimensions:
Energy (XLE) leading while note the weaking Tech (XLK)
👉 Short Interest breakdown for the 11 sectors: Industrials (XLI) the most shorted, Tech (XLK) and Communication Services (XLC) the least
👉 Industry analysts 12 month median forecast / target price for the 11 sectors:
Tech (XLK) the most optimistic while Energy (XLE) the least
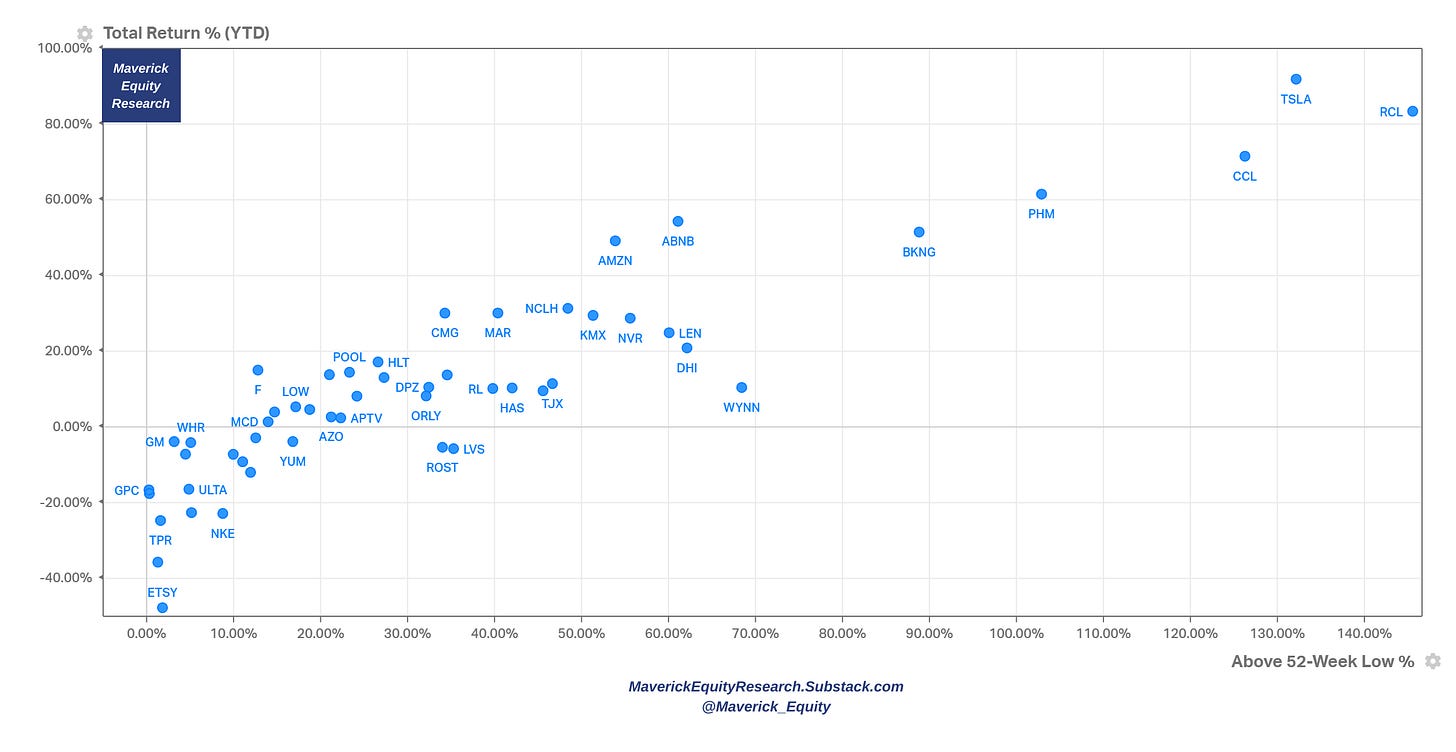
👉And now let’s zoom into the Price/Performance of the 11 sectors via scatterplots: 2023 % returns & above 52-week low % returns. General use cases for this visuals? Check for outliers, market leaders & laggards, positive/negative momentum, relative strength and/or likely un/warranted cheap or expensive stocks:
XLY - Consumer Discretionary: Tesla (TSLA) & the cruisers Royal Caribbean (RCL) and Carnival (CCL) rocking the boat …
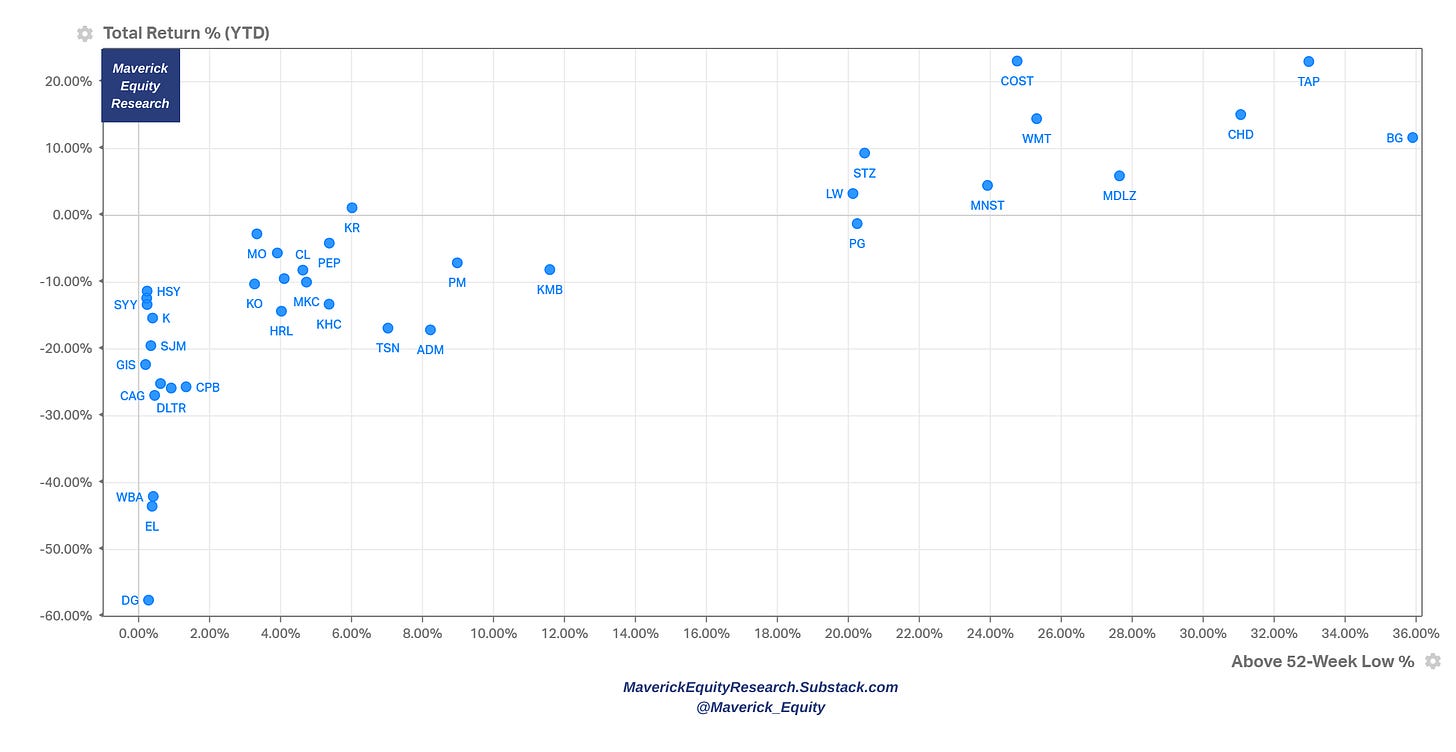
XLP - Consumer Staples: Dollar General the big story on the negative side, Costco (COST), Walmart (WMT) & Mondelez (MDLZ) keep bringing the goodies…
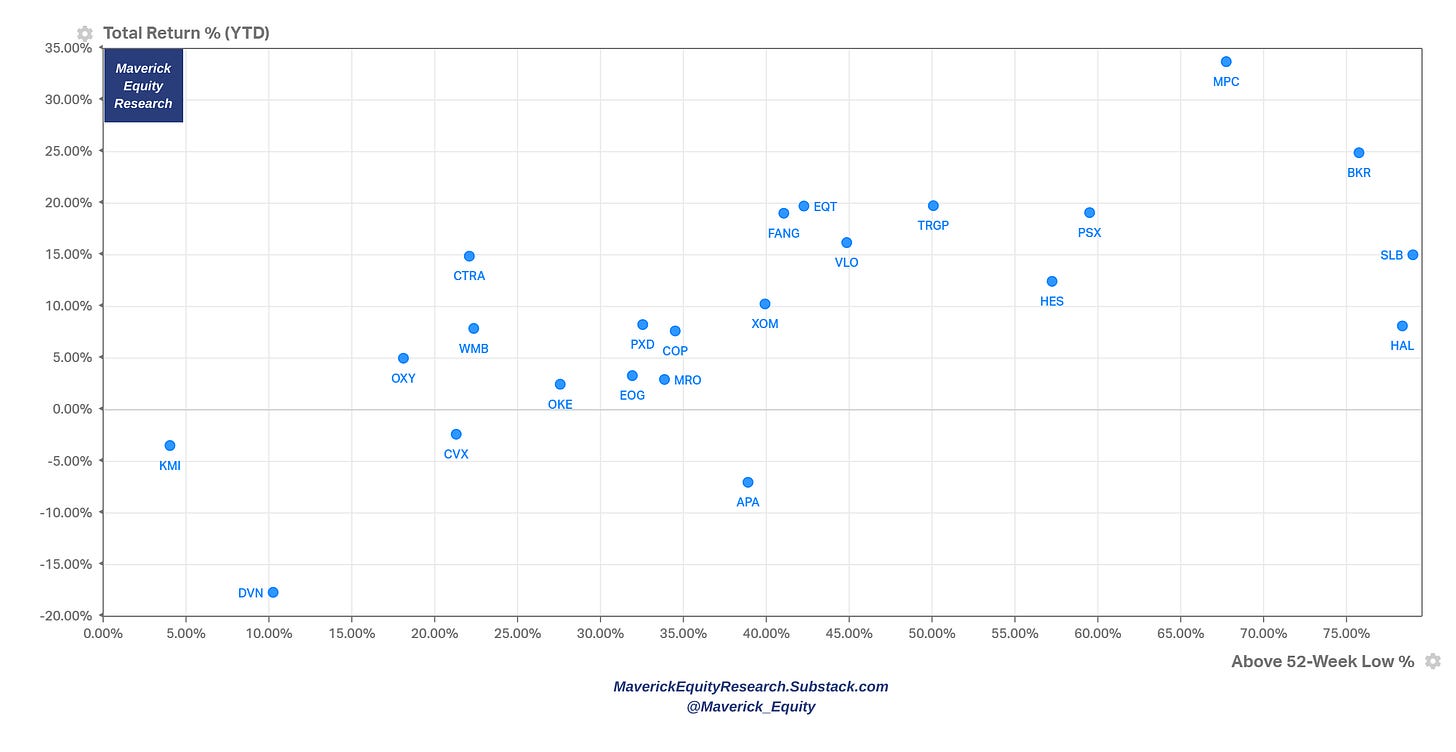
XLE - Energy: most energy names making a nice comeback …
XLF - Financials: a mixed bag as pretty much most of the times, PayPal (PYPL) continuing the slide in 2023 while Arch Capital Group (ACGL) +30% in 2023 and almost 2x since the 52-week low
XLV - Health Care: many names down this year while West Pharmaceutical Services (WST) the big outlier on the positive side
XLI - Industrials: General Electric (GE) and FedEx (FDX) the big rebounders …
XLB - Basic Materials: many names rebounding nicely from the 52-week low … infrastructure needs and demand anyone? …
XLRE - Real Estate: Welltower (WELL) the outlier in this space …
XLK - Technology: Nvidia (NVDA) the big outlier, AI AI AI …
XLC - Communications: META/Facebook with a mega rebound, currently in the MetaVerse … with the CEO planning and training to fight Musk in the ring ;). Google (GOOG) & Netflix (NFLX) not chilling anymore with a nice rebound also …
XLU - Utilities: Constellation Energy Corporation (CEG) a big outlier …
📊 Sentiment, Seasonality, Volatility
👉 Sentiment: retail investors, institutional & mixed/composite indices
After the 2022 bear market, retail investor sentiment is picking up materially
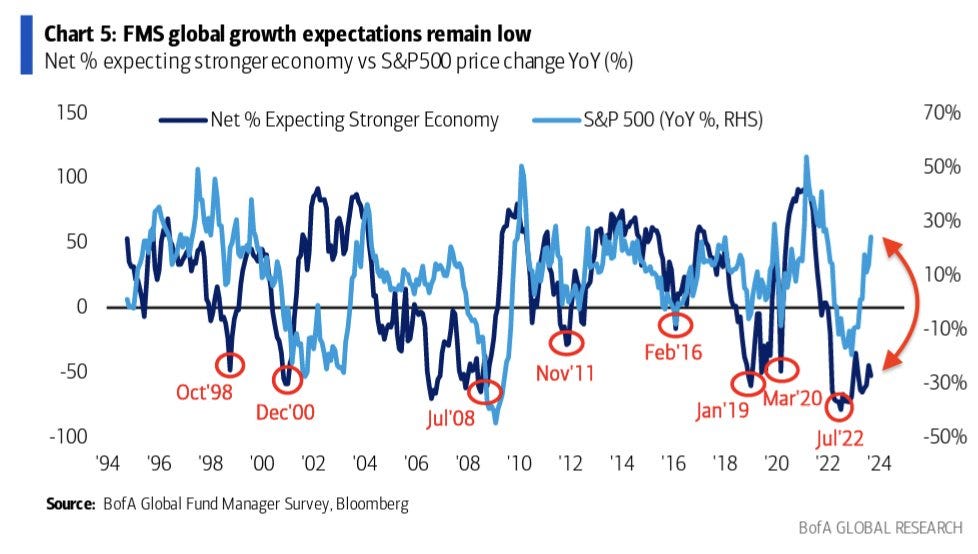
BofA fund manager survey: despite global growth expectations being more pessimistic with net 53% expecting a weaker economy over the next 12 months, there is optimism for the stock market which is likely driven by likely interest rates cuts as priced in currently by the market
The Fear & Greed index shows Fear at 35, materially less than the Neutral 46 from 1 month ago, while note that 1 year ago in the 2022 bear market we were at the 21 Extreme Fear level
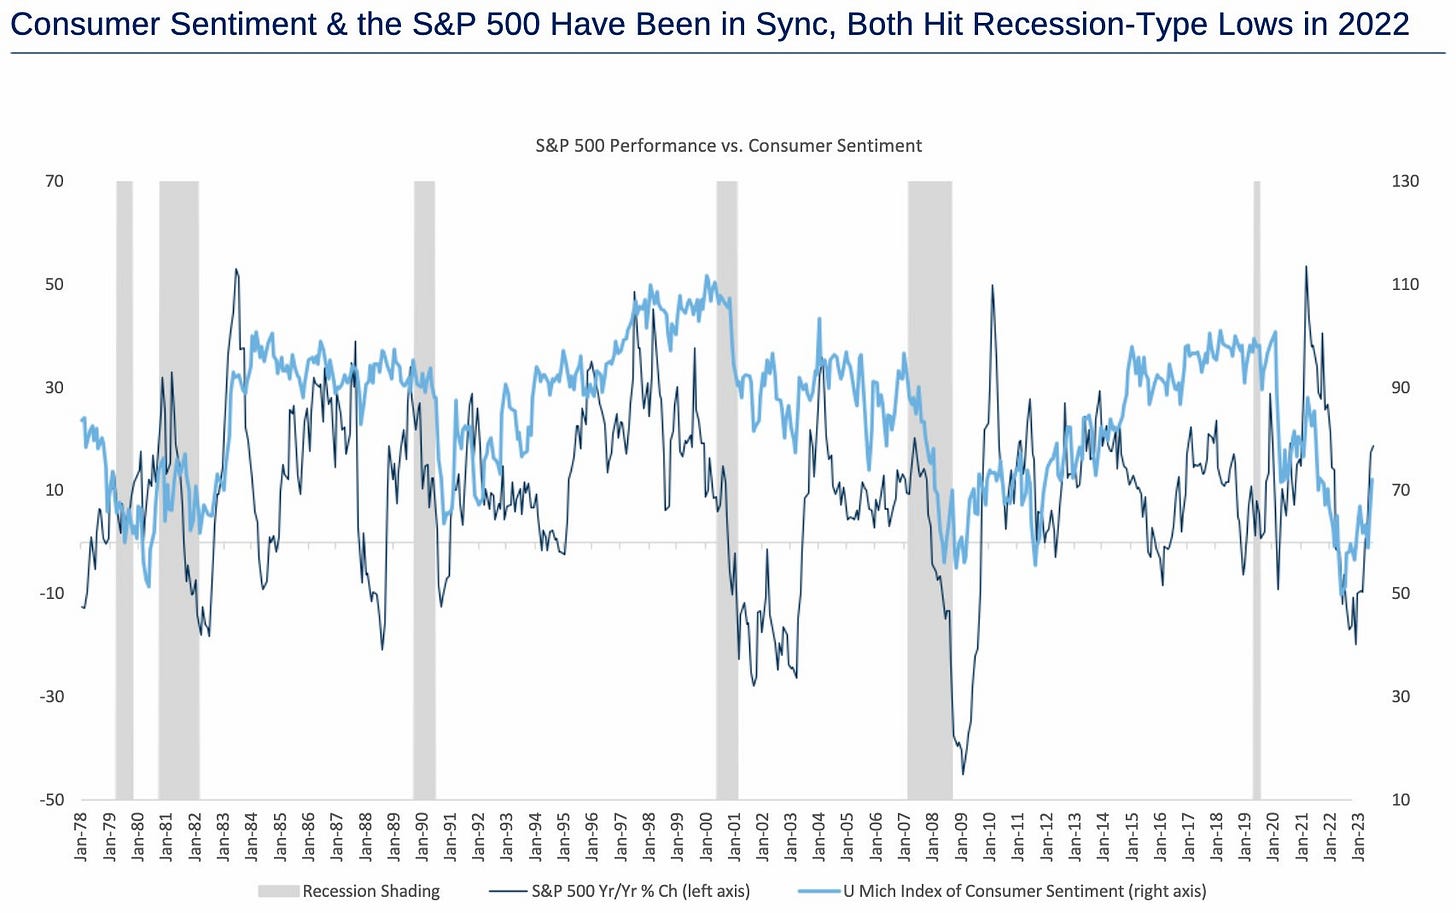
Consumer Sentiment and the S&P 500 dance together: after the 2022 bear market (biggest since 2007-2009 GFC), recovering more and more
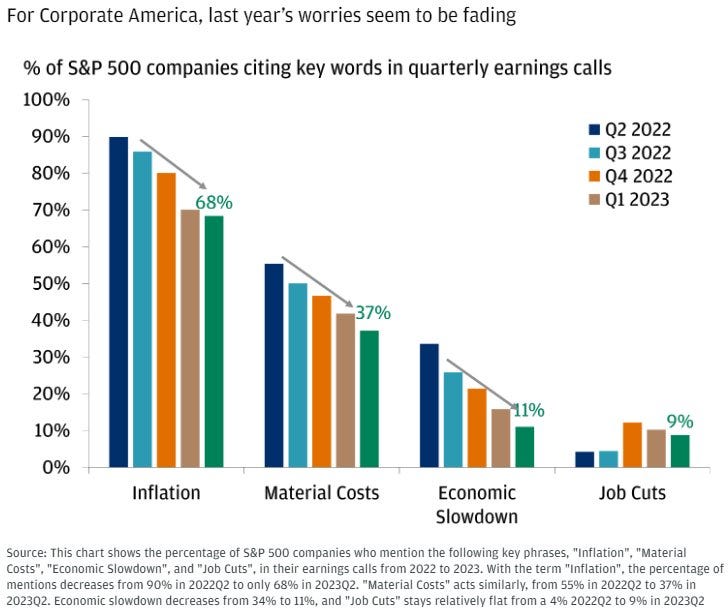
S&P 500 companies themselves via earnings calls narrative
2022 worries are fading for Corporate America
And the ‘R’ word: fewer & fewer citing ‘recession’ for the 4th straight quarter
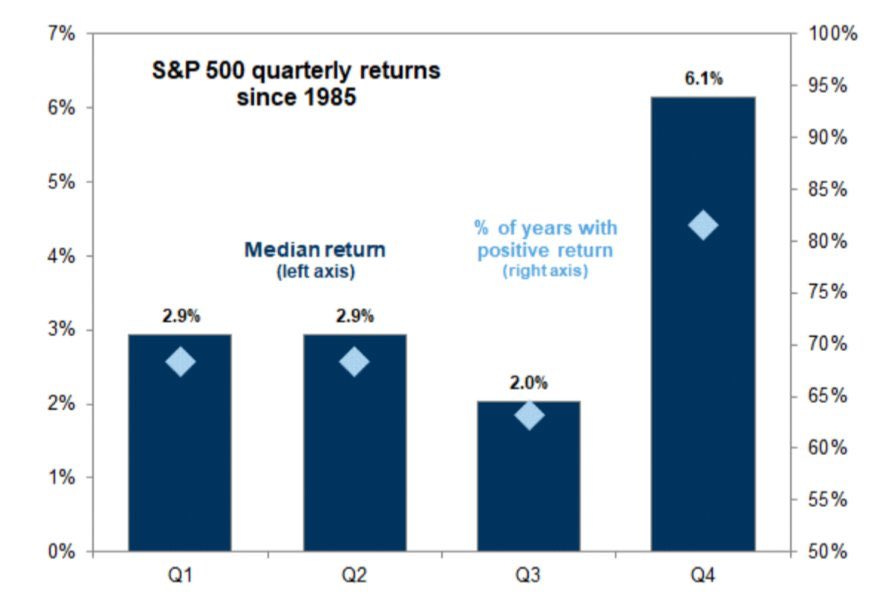
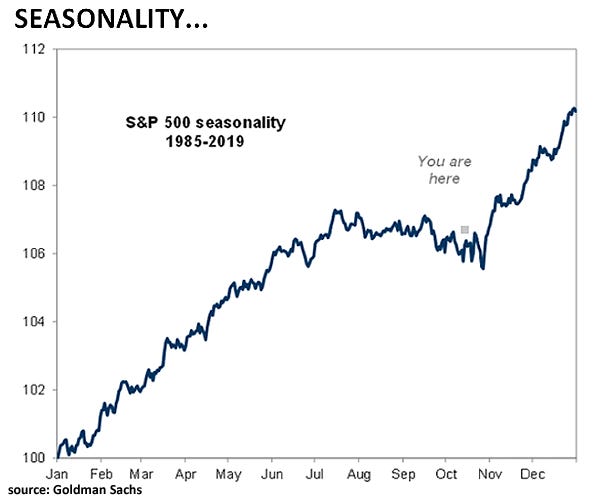
👉 Seasonality tells us we are behind the next move higher
Quarterly wise, since 1985 we have a 6.1% return in Q4; personally, I expect less given we already had a great year this year
Daily/Monthly wise, it points out up as well
👉 Volatility wise:
2023 stock market rally caused VIX (indicator of market uncertainty) to fall since June to its lowest level in more than 3 years (since January 2020)
recent spike to 17.2 as we cooled off a bit, but still below 19.6 average since 1990
📊 Technical Analysis: Short Term & Long Term
Short Term:
once we broke out of the major resistance level (red) & the 200-day MA, we did exit the 2022 bear market and headed up nicely via the trending channel
channel resistance level broken recently with the next support at the 200-day MA
however, the RSI at 34 is signalling oversold conditions as it signalled also before local bottoms, hence pointing to a likely bounce back going into the year end
Complementary with an even shorter time frame, specifically from July 2022:
trendline (black line) from the October 2022 lows is the support level
tested for the 2nd time recently, only to bounce back from in the recent days which was also signalled by the RSI that reached oversold territories
hence, still a support level and in case broken, the 200-day MA is the next one
the 50-day MA (blue) is the resistance level here should the 2023 rally continue
Long Term:
after the recent drop still above the 50 & 100-week moving averages which are now support levels going forward
RSI in oversold territory at the 33 level which often signals a bounce back
📊 Special & Alternative Metrics
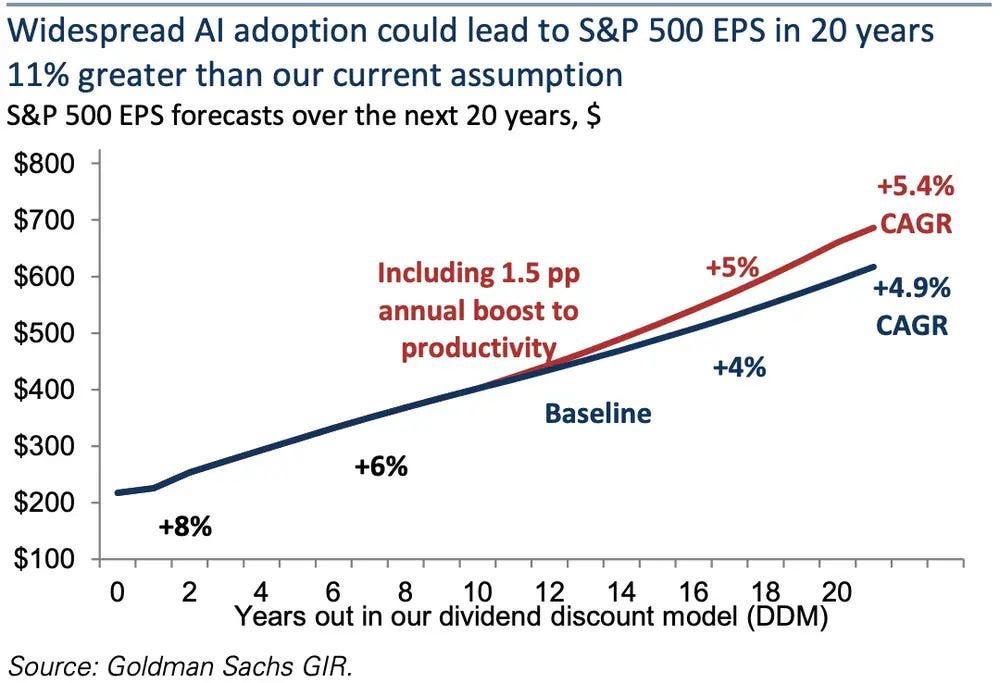
👉 S&P 500 EPS to be boosted for the next 20 years by +0.5% in annual growth driven by widespread AI adoption (0.5% seems not a lot, but CAGR aka compounded)
👉 S&P 500 set to triple to 14,000 by 2034 via the generational cycles:
current 16-18 year cycle likely to peak around 2023
3x might sound ridiculously high? It is highish but not something bombastic and that is because: a) reaching 14,000 would imply around 11% annualised returns which is not that uncommon b) not too long ago in 2010 the S&P 500 was at 1,000
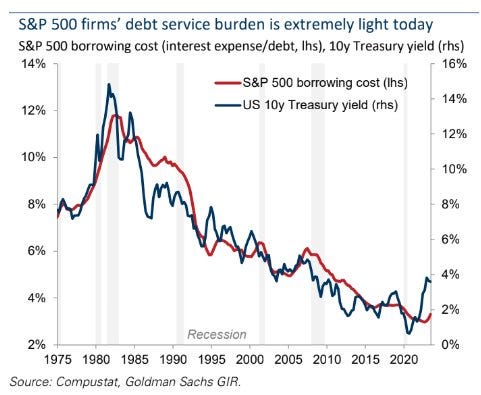
👉 How is the S&P 500 dealing with the high & fast rising rates environment?
debt service burden is extremely light
strong Corporate America is also a reason for why the most anticipated recession did not happen
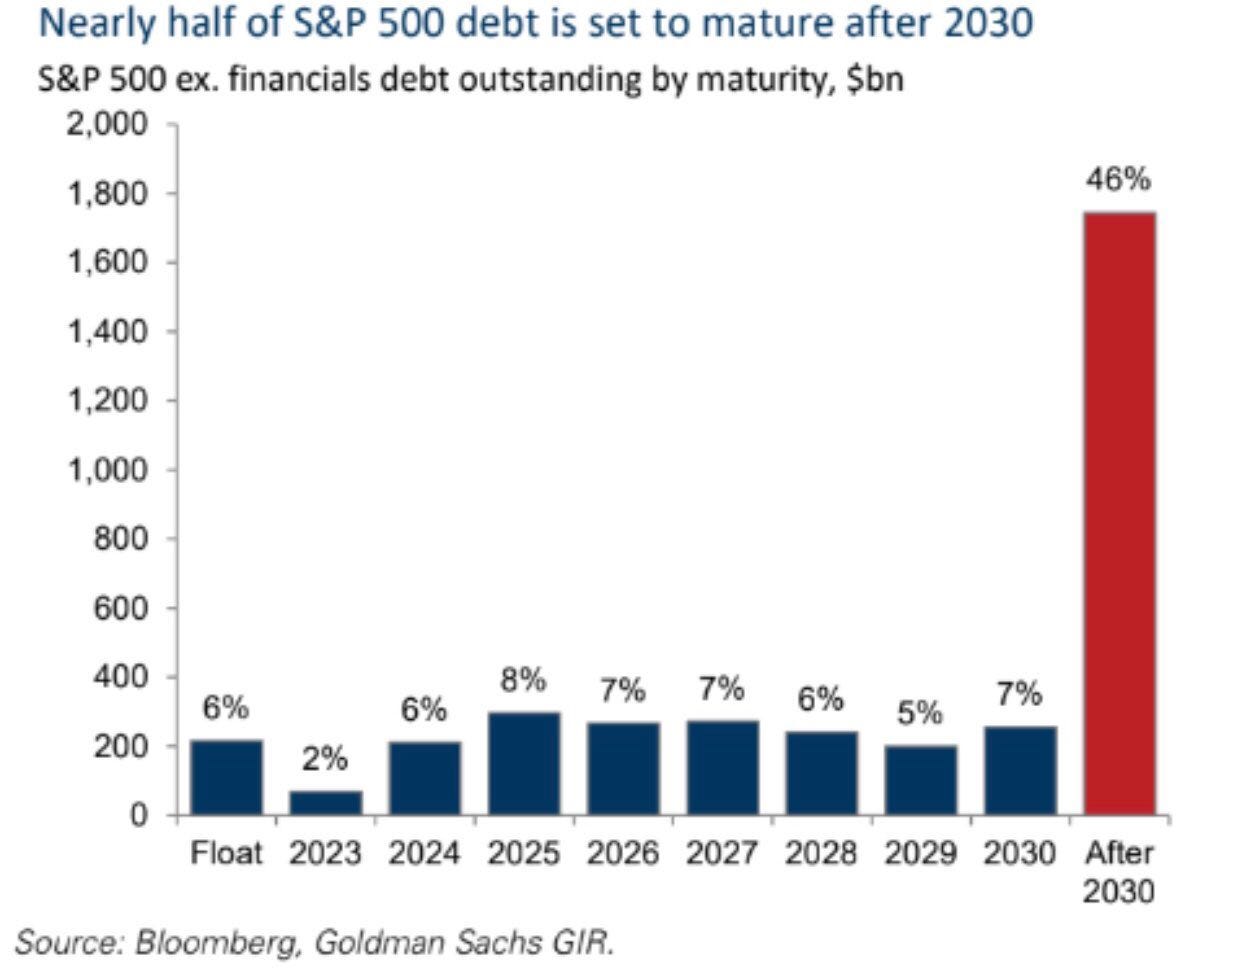
Complementary angle to answer, ‘how comes rates are not impacting S&P 500?’
almost half of the S&P 500 is set to mature AFTER 2030
hence, rate hikes have had not much of an impact on their interest expense so far
also, many of the S&P 500 companies have big pricing power etc
S&P 500 labour costs across the 11 sectors:
At the aggregate S&P 500 index level, labour costs equal 12% of revenues
At the stock level, they equate to 13% of revenues for the median constituent
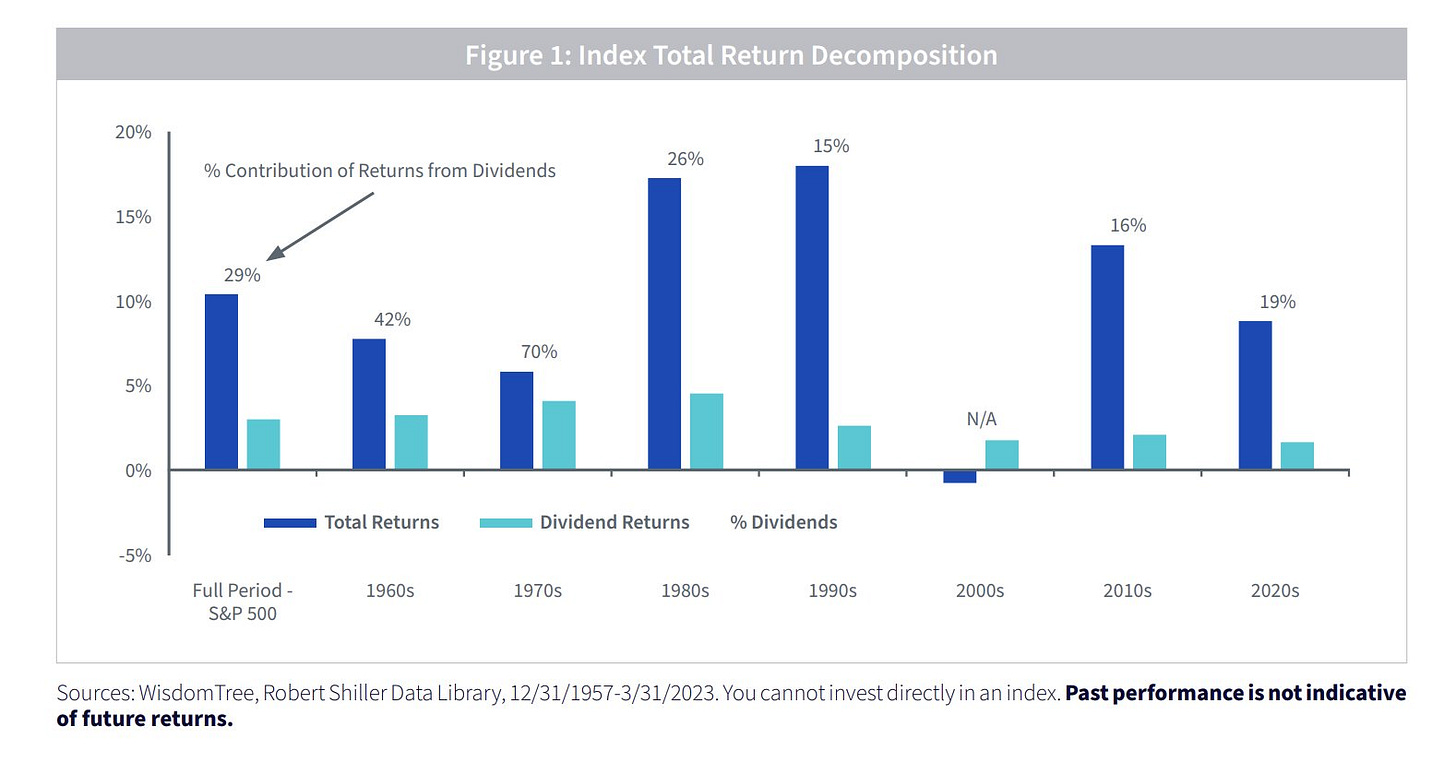
👉 The Power of Dividends in the S&P 500:
Dividends contributed almost 30% to the 10.4% annual total returns of the S&P 500 over the long run. Some further key notes:
In the 1970s, a decade characterized by high inflation and weak economic growth, dividends made up 70% of total returns
The 1990s—the decade of the dot-com bubble—had the lowest contribution from dividends of just 15%
The 2000s was the only decade with negative total returns: the dividend returns of nearly 2% provided a cushion to offset negative price returns driven by the bursting of the dot-com bubble and the Global Financial Crisis
S&P 500 distance from a 52-week high (green) and recession periods (grey):
20% drops (grey horizontal line) do not happen often outside of recessions
👍 Bonus Charts 👍
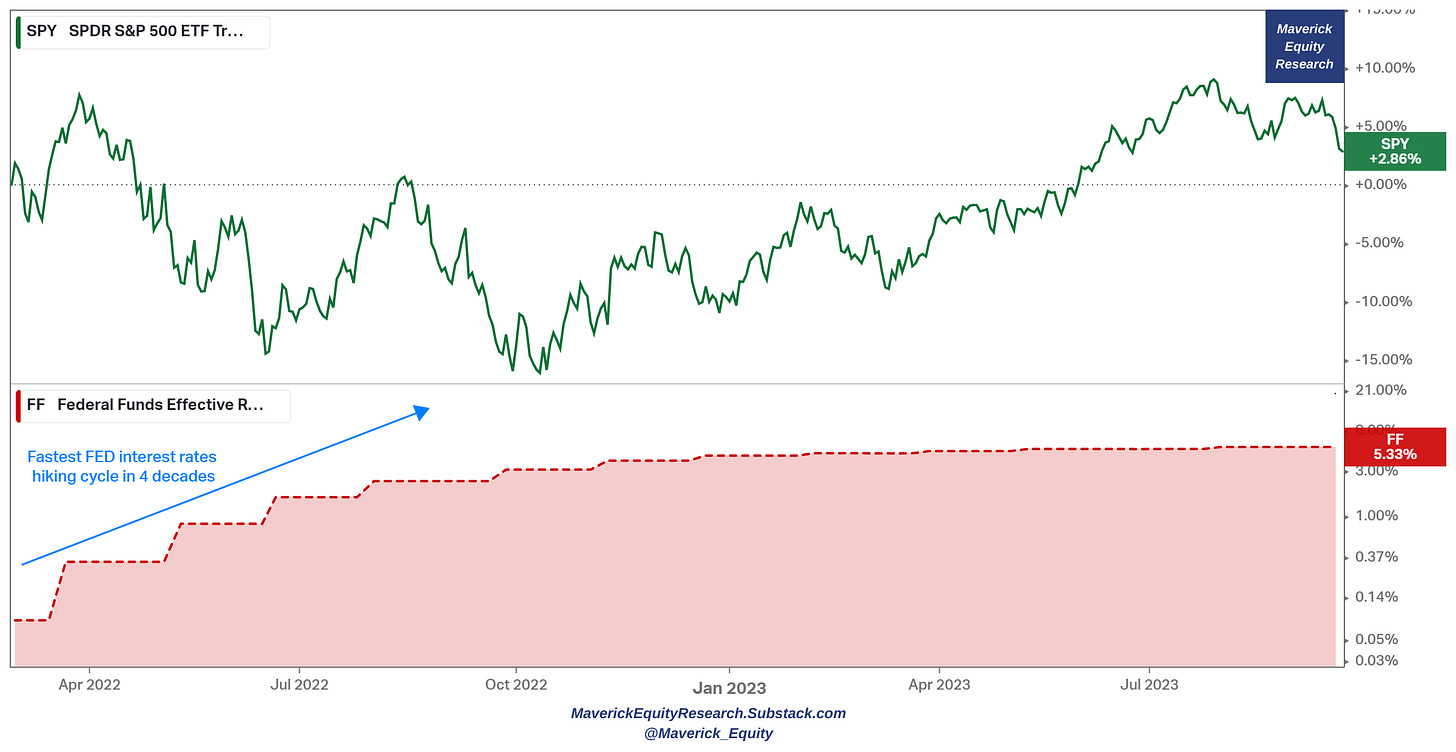
👉 interest rates a main talking point, S&P 500 (green) & US FED interest rates (red):
we went from 0% to 5%+ interest rates in no time = 2022 FED with the fastest interest rates hiking cycle in 4 decades, yet despite that outlier, stocks still +2.86%
stocks as a (natural) hedge to interest rates! Not the first time, nor the last …
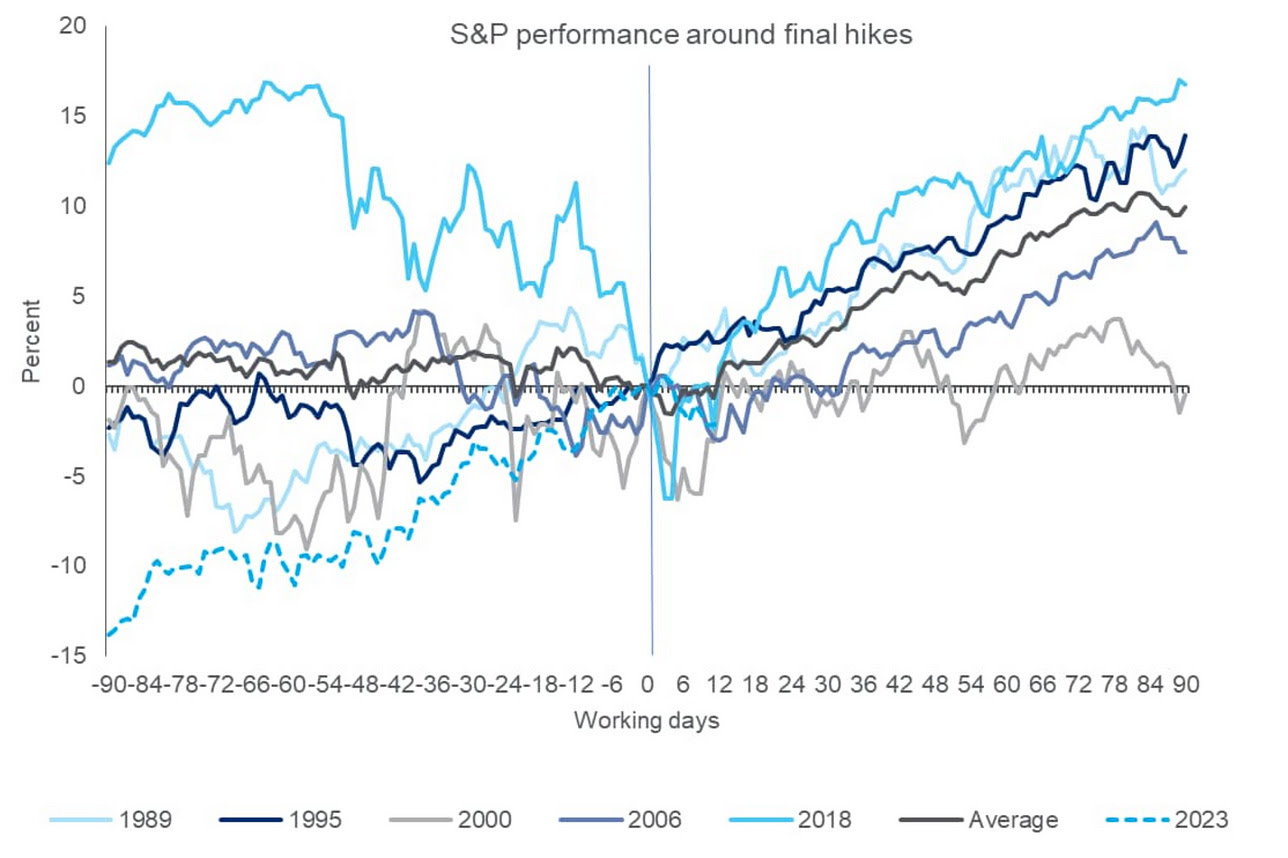
👉 How does the S&P 500 perform around final interest rate hikes which we should have sooner rather than later? There you go:
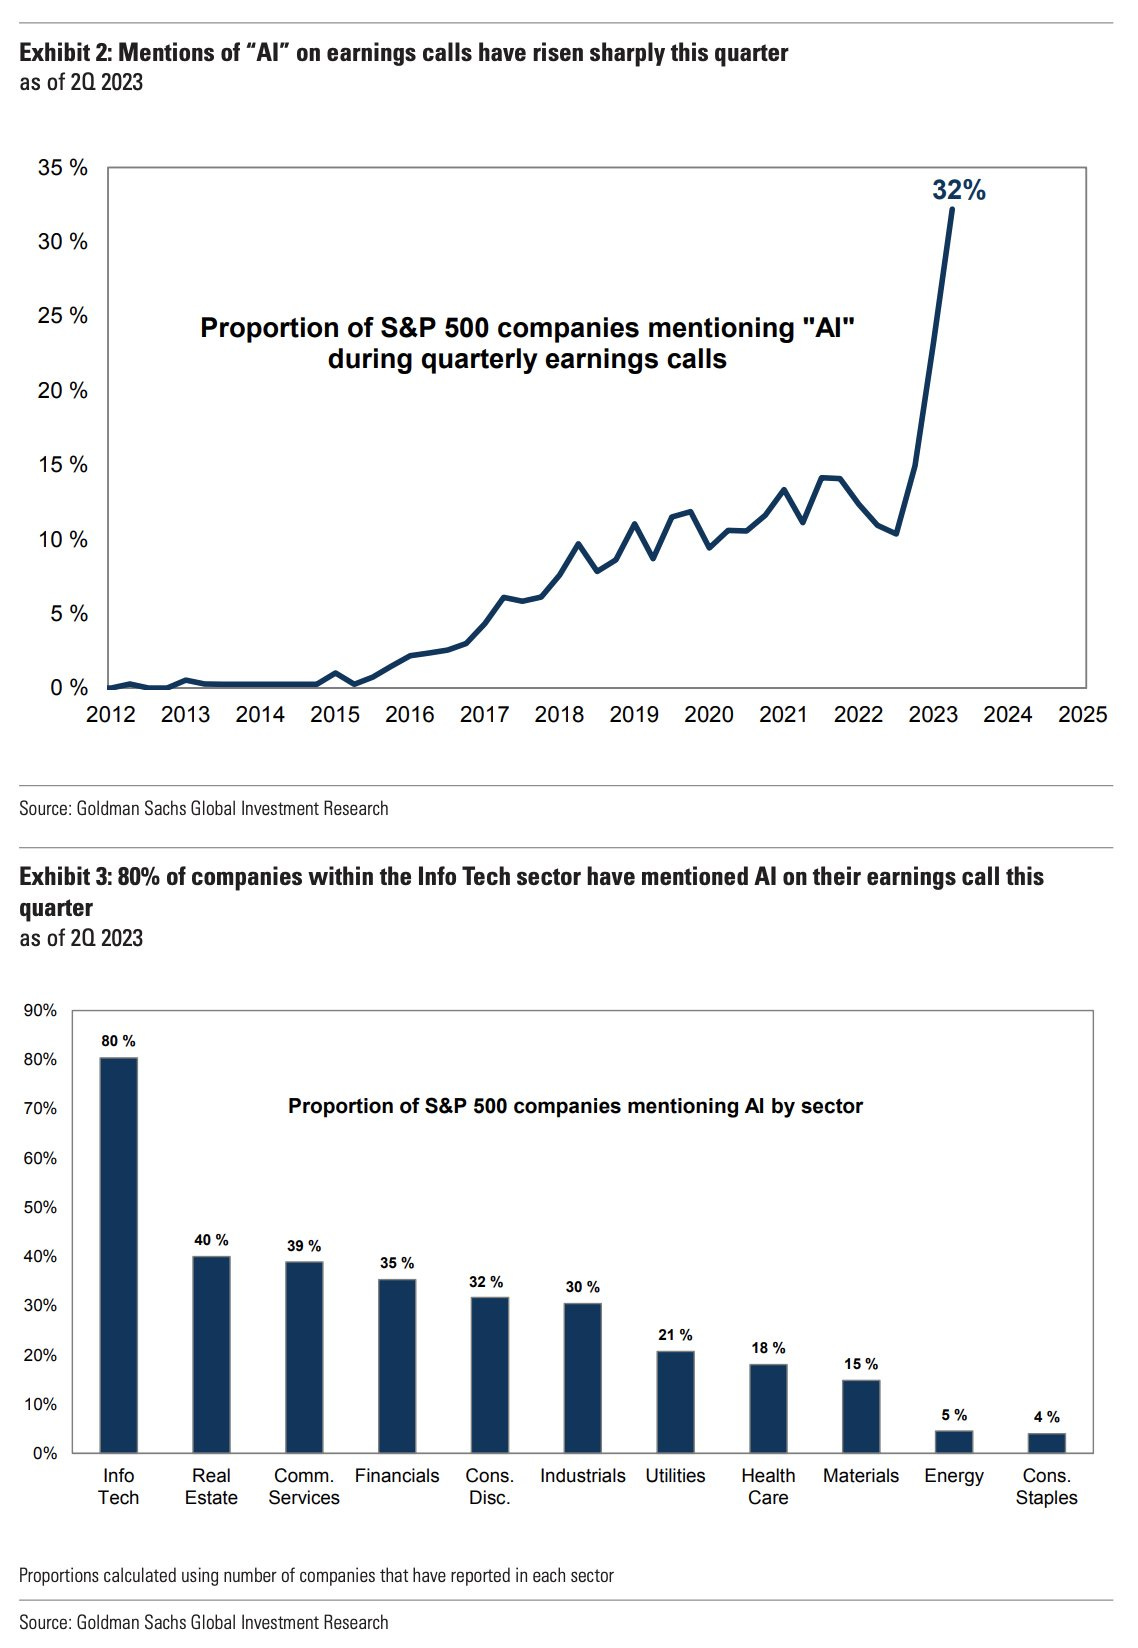
👉 ‘AI’ mentions on earnings call rose sharply in the most recent quarter
👉 Top 5 stocks contribution by year since 2010:
Apple running the show
Big Tech domination present in the last years
This research is NOT behind a paywall & there are NO pesky ads floating around.
Did you enjoy this extensive research by finding it interesting, saving you time & getting valuable insights? Now some of you asked how can one support me which is really kind of you 🤗. Therefore, it would be great & highly appreciated if you would support an independent investment researcher for the ‘Maverick-esque’ ongoing & future research. A donation or a tip to support my work can be done via the following:
Twitter thread on this research piece can be found here.
Thank you & have a great day!
Mav





















Thanks a lot! So many great charts and insights, appreciate the effort! Great work as always!
By far the most comprehensive coverage on the S&P500 out there! Top structure and takeaways from so many angles. Thank you!