


✍️ Maverick Charts of the Week #12: S&P 500 Valuation & Seasonality + 'My name is Bond, Maverick Yield Bond!'
10 Maverick Charts that say 10,000 words

Dear all,
10 cherry picked charts for both data-driven insights + valuable food for thought!
Table of contents:
📊 S&P 500 Valuation & Seasonality
📊 'My name is Bond, Maverick Yield Bond!' - a Yields/Rates Special
Delivery is in typical fashion, via Maverick Charts that say 10,000 words or more!
📊 S&P 500 Valuation & Seasonality 📊
S&P 500 valuation via Price/Earnings (P/E) multiples (very complementary after previously I did cover the FCF yield angle). Framework = 'Buy Low, Sell High'!
Forward P/E - trading at 22.6x (blue)
👉 not far from the + 2 Standard Deviations (SD) of 24x (2020-2021 madness levels)
👉 sitting above the +1 SD of 21x, and even more above the 10-year average of 19.2x
Maverick’s approach:
rarely a buyer when around the +2 SD, let alone when even above the +2 SD (like in 2020-2021), the latter actually quite a strong signal to sell or hedge
considering being a buyer, small buys when around the 10-year average
a solid buyer when close or below the -1 SD, and even more solid when below -2 SD which occasionally happens: -1 SD in the 2022 bear market, -2 SD in 2020 Covid, 2018 …
context matters: if earnings/EPS drop (denominator) or Price (numerator) drops (especially when panic selling) make for different implications - the same, if we have a recession as a strong case or not
As always, patience + discipline are both the difficult parts, and the key in this ‘game’!

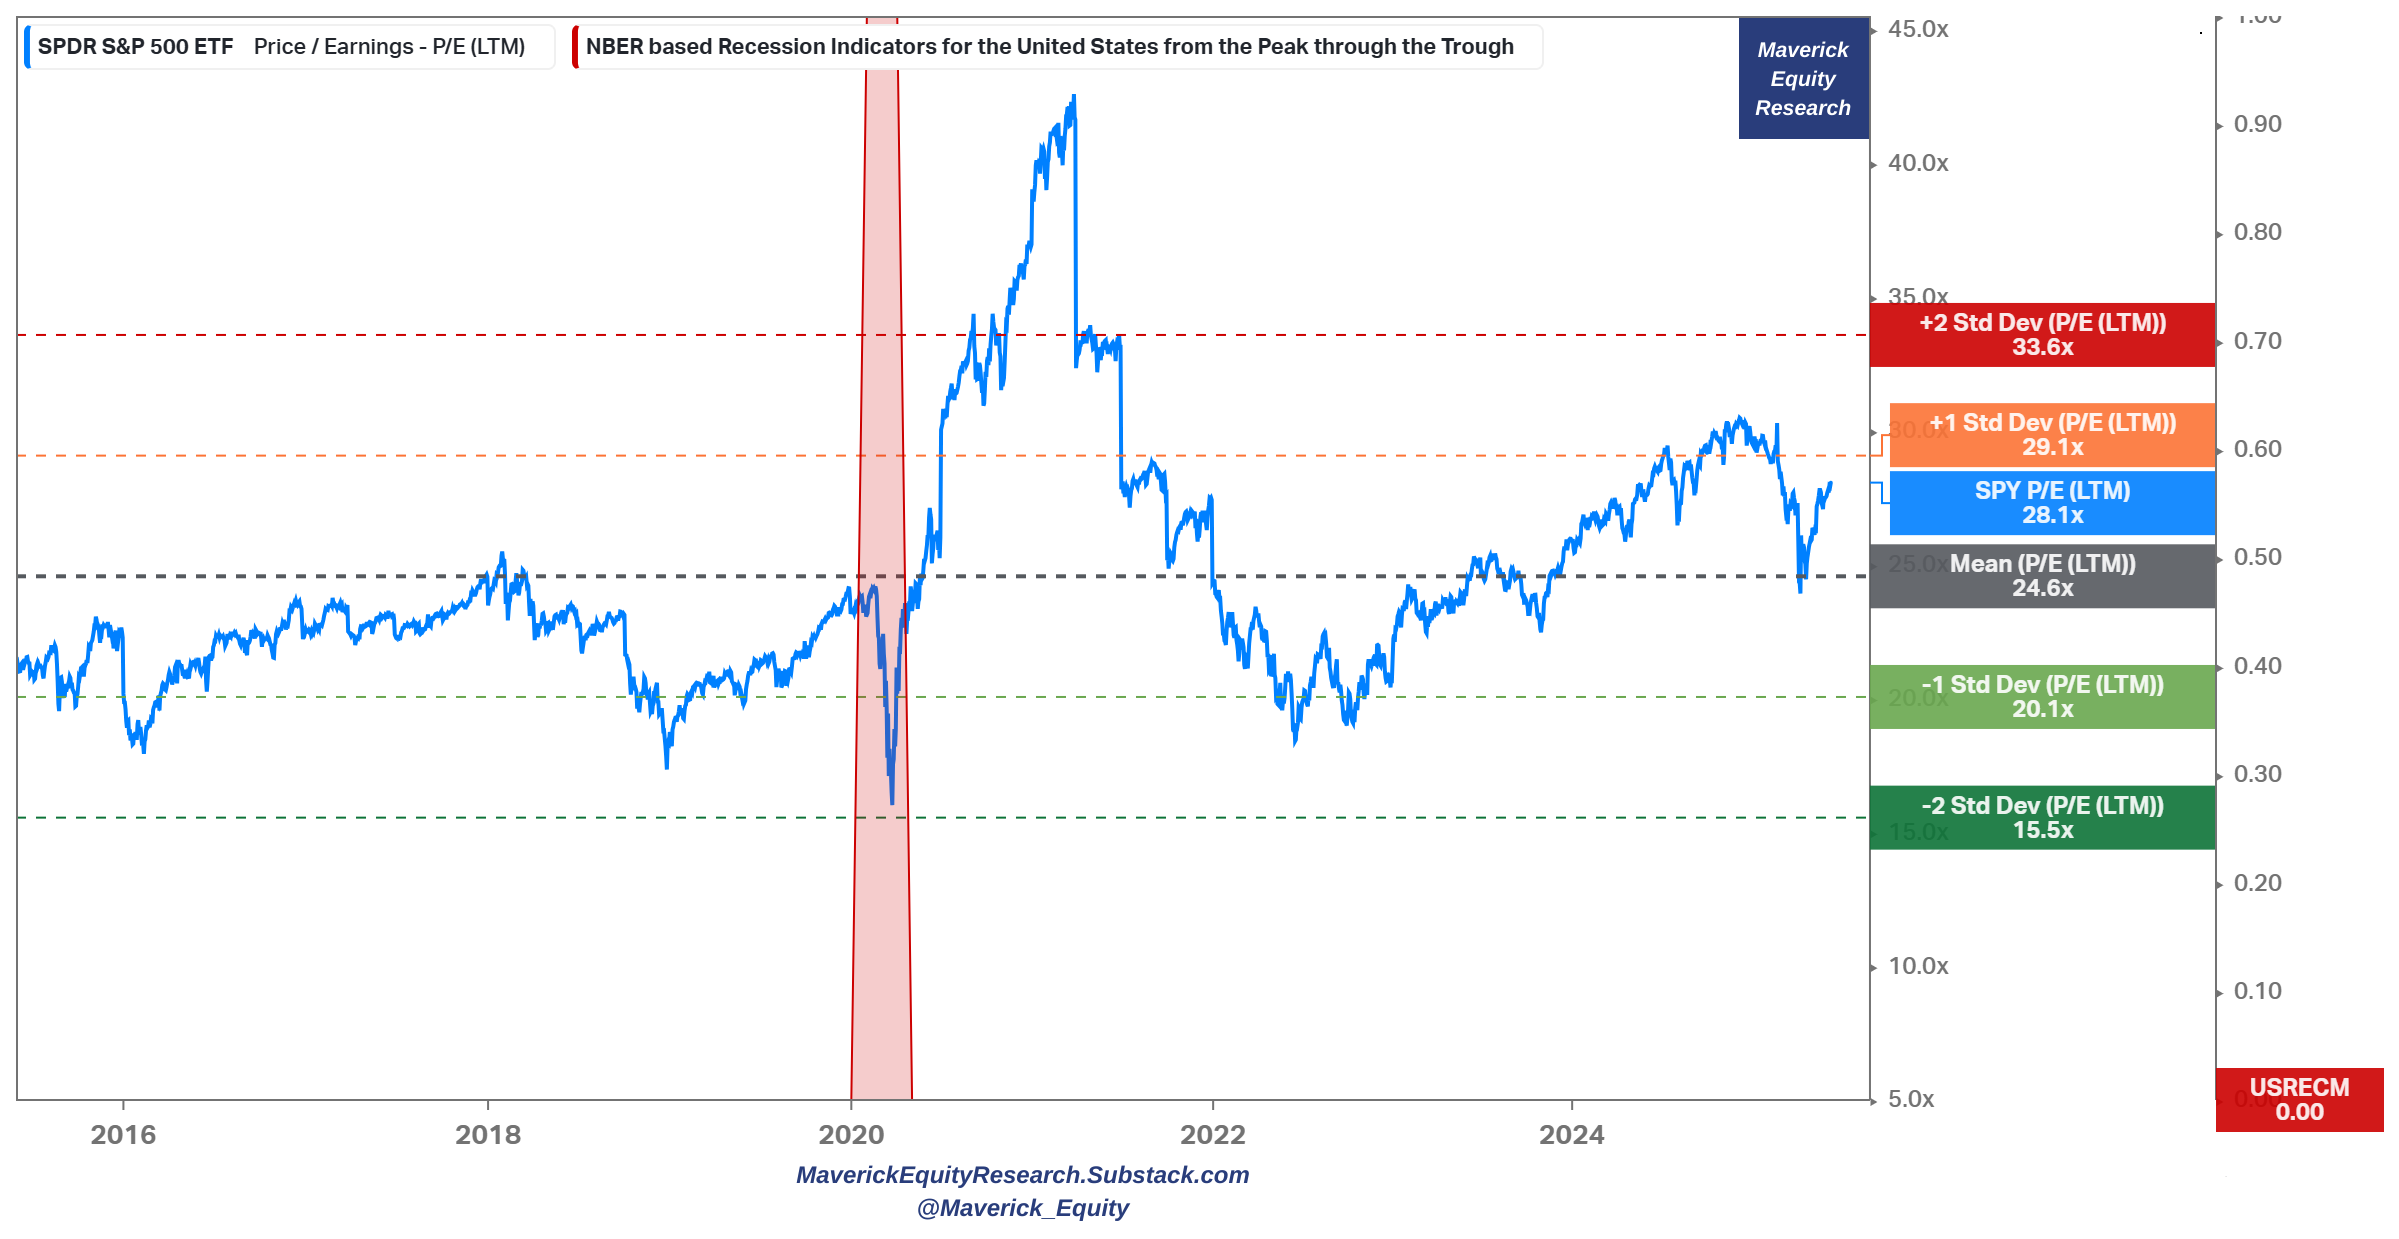
Trailing P/E - trading at 28.1x (blue)
👉 close to the +1 SD of 29.1x after being above it until February 2025
👉 when it dropped very fast to the 10-year average of 24.6x via the Trade War saga
Maverick’s approach:
rarely a buyer when around the +2 SD, let alone when even above the +2 SD (like in 2020-2021), the latter actually quite a strong signal to sell or hedge
considering being a buyer, small buys when around the 10-year average
a solid buyer when close or below the -1 SD, and even more solid when around or below -2 SD which occasionally happens: -1 SD in the 2022 bear market, -2 SD in 2020 Covid, 2018 …
context matters: if earnings/EPS drop (denominator) or Price (numerator) drops (especially when panic selling) make for different implications - the same, if we have a recession as a strong case or not
As always, patience + discipline are both the difficult parts, and the key in this ‘game’!
N.B. one can start to look at things similarly also for individual stocks and an overall portfolio made out of stocks - I will start covering single stocks going forward as well:
✍️ Full Equity Research - starting in 2025
N.B. there is more on that for both a short and medium-long term focus, and in 2025 my distinct S&P 500 comprehensive reports will get further improved, and this time materially with some special metrics you rarely see … stay tuned!
✍️ S&P 500 Report #6: Valuation, Fundamentals & Special Metrics
✍️ S&P 500 Report #6: Performance, Profitability, Sentiment & More
S&P 500 seasonality pattern - 8th June to the 27th June (last 10 years):
👉 it does not look good from here until the end of June, and is complementary to the P/E multiples and FCF Yield frameworks I covered in this and previous report
 for the next 20 days.")
📊 'My name is Bond, Maverick Yield Bond!' - a Yields/Rates Special 📊
Naturally from the name, I focus on equities, yet understanding and having a look at interest rates is an important aspect in investing. The rationale is that simply put, interest rates are a key determinant in valuing any asset on planet earth (some more directly & fast some less). Stocks specifically, just recall Warren Buffett’s take on rates: ‘everything in valuation gets back to interest rates’, ‘interest rates are 'gravity' on stock prices’, basically the discount rate, hurdle rate, the cost of capital in valuation.
Therefore, 7 Maverick charts on U.S. + Global yields with one key question answered!
4 & 5. Why are long-term rates moving higher? 10-year & 30-year yields since 2015:
👉 in one sentence, because both growth and inflation are rising
👉 notice also the higher volatility (1-day change) after 2020 Covid - regime change

👉 10-year yield at 4.5% and 30-year at 4.97% broke the long-term downward trend
👉 way lower volatility relative to the FEDs anti-inflationary policies from the 1980s

6 & 7. Is the U.S. an isolated case regarding interest rates behaviour? Nope!
👉 global 30-year bond yields up & up since 2021 as inflation showed up its teeth
👉 U.K. 30-year at 5.33%, U.S. at 4.97%, Germany at 3% and Japan as well at 2.88%

Going back to 1975 like before, we have a similar development and takeaway:
👉 the long-term downward trend has been broken since 2021

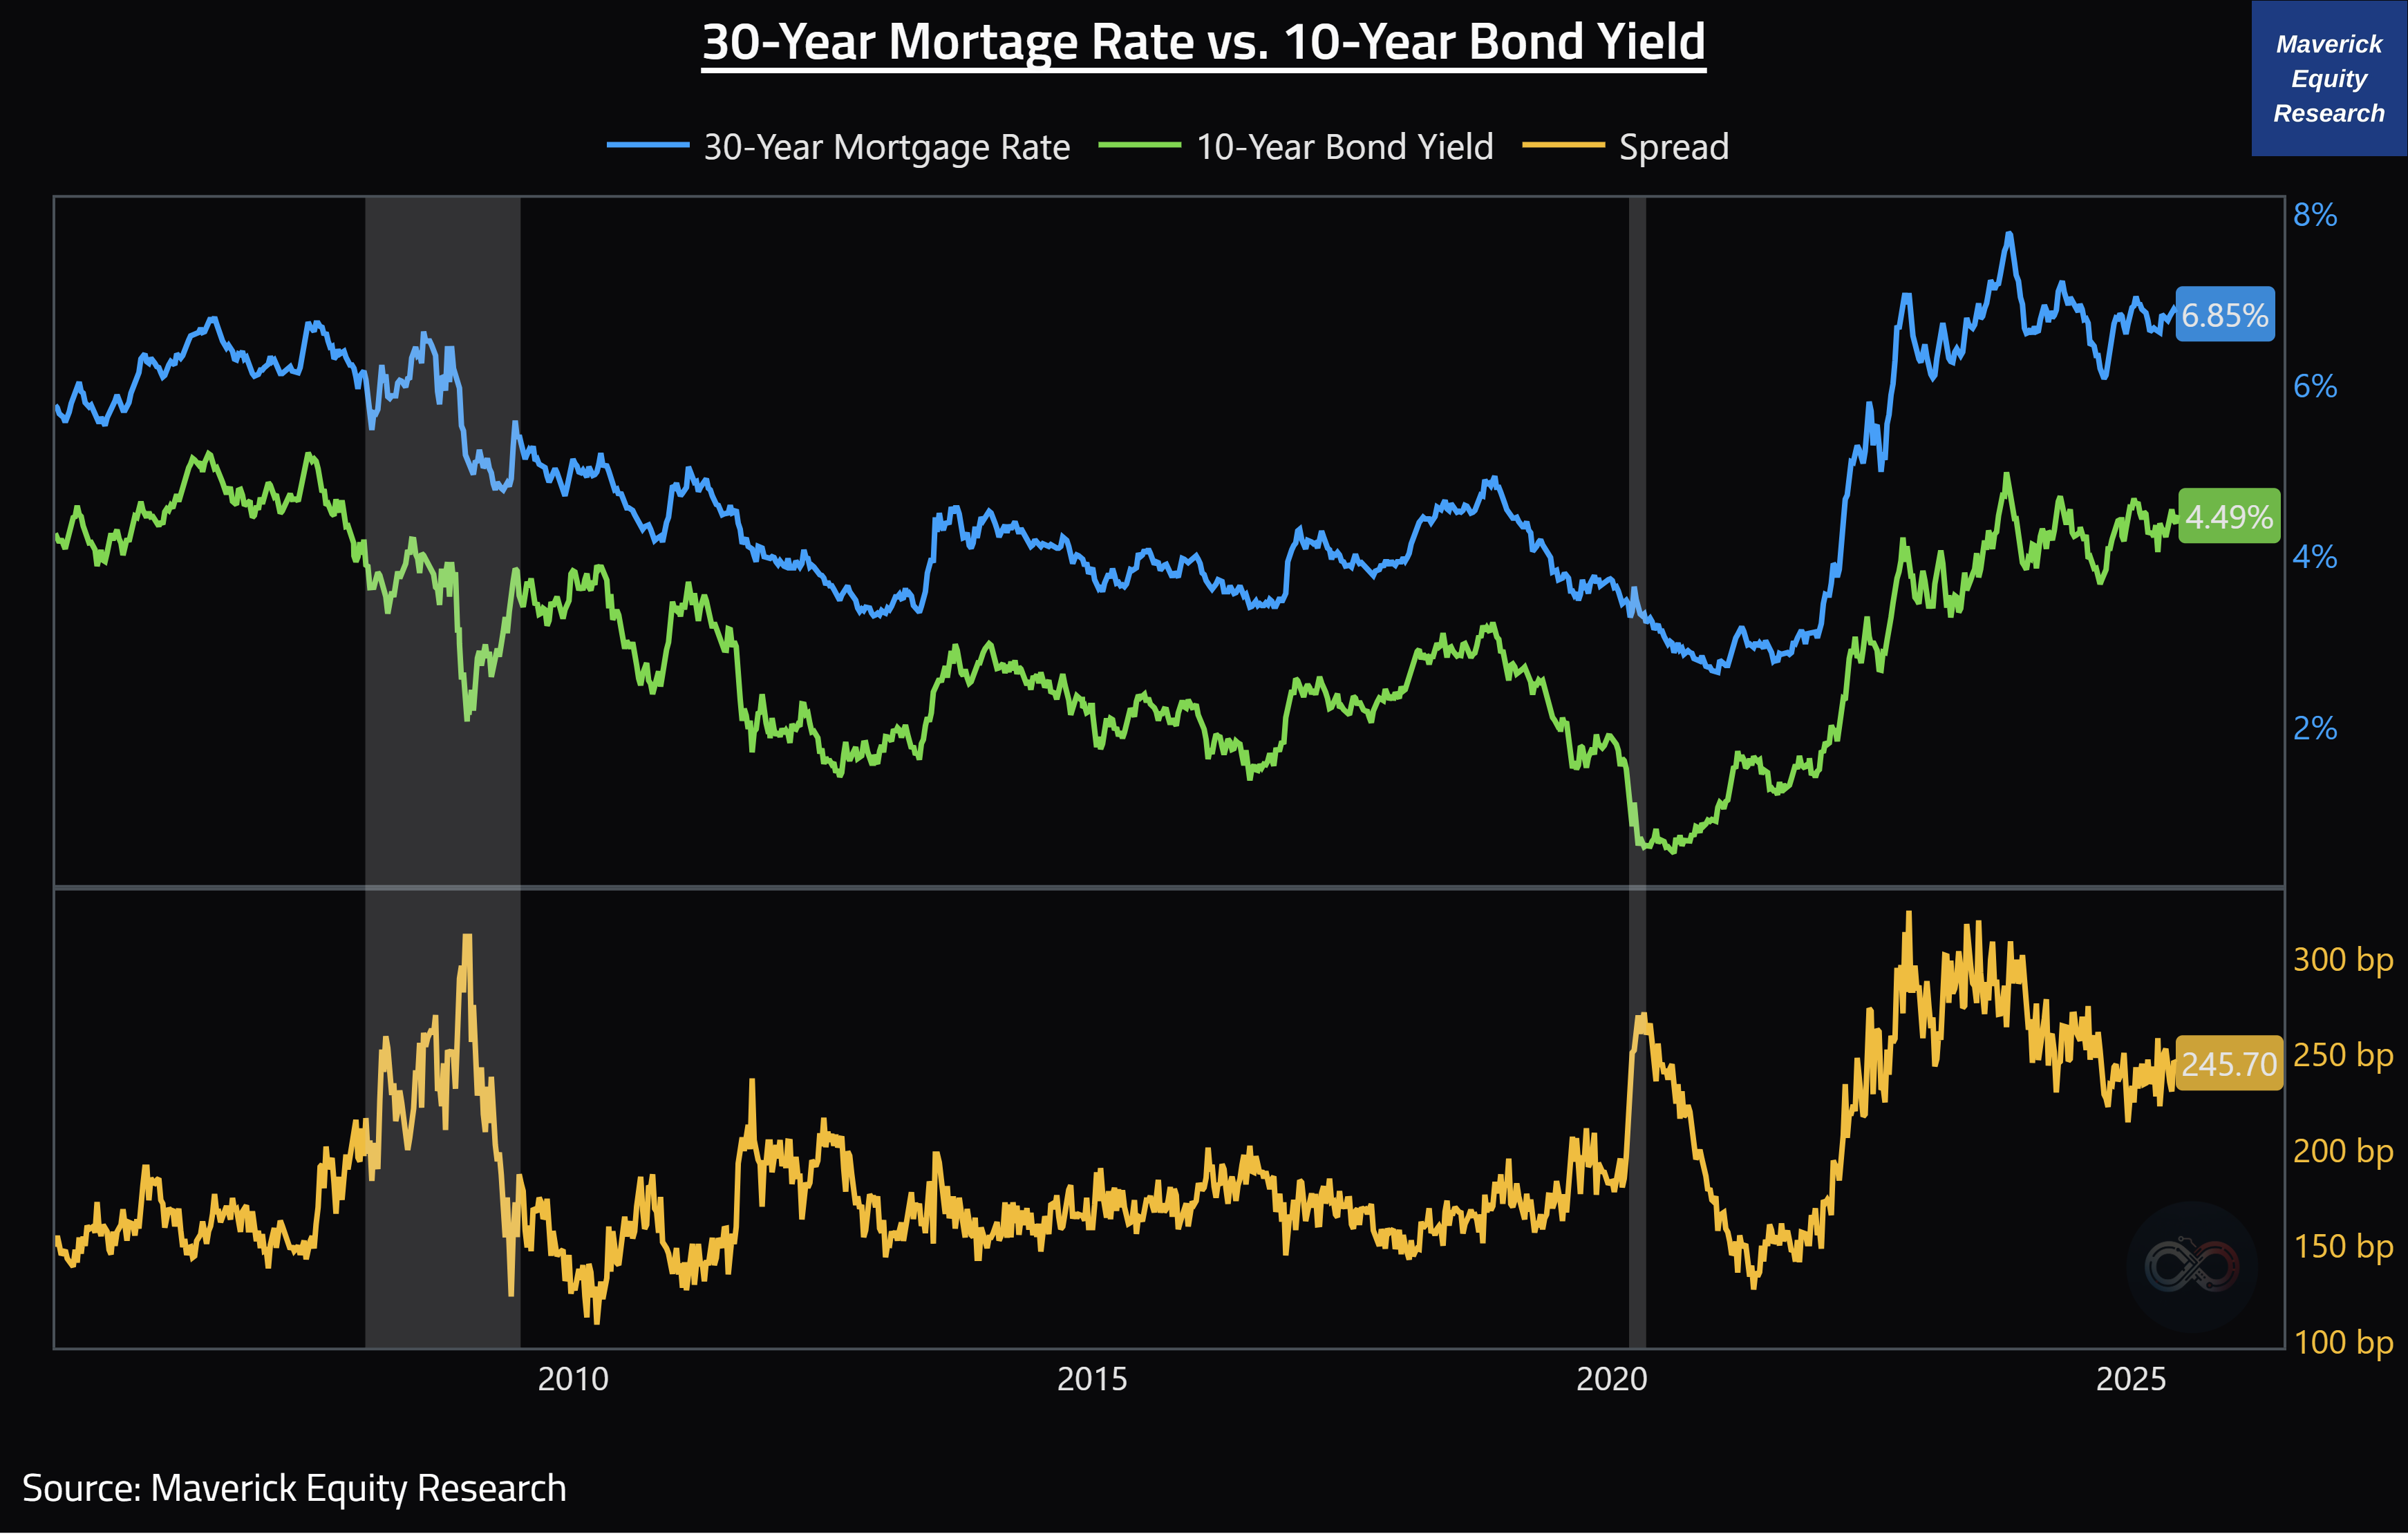
8 & 9. What about the U.S. 10-year yield and U.S. 30-year mortgage rate?
👉 2021 a historical chance to get a fixed mortgage below 3% for a home (2.66% low)
👉 record low spreads of 140-150 b.p. with a low at 127 b.p. - currently 245 b.p.
Zooming out for a bigger perspective since 1975:

U.S. 10-year Real Yield - Before & After 2008 (GFC/Lehman) - things changed:
👉 before 2008 = 2.84% real yield VS after 2008 = 0.54% real yield
👉 a 2.3% differential, it used to be way easier to earn decent Real Risk-Free returns

N.B. in case you missed my Maverick Special Situation reports on the topic:
Research is NOT behind a paywall and NO pesky ads here unlike most other places!
Did you enjoy this by finding it interesting, saving you time and getting valuable insights? What would be appreciated?
Just sharing this around with like-minded people, and hitting the 🔄 & ❤️ buttons! That’ll definitely support bringing in more & more independent investment research: from a single individual … not a corporate, bank, fund, click-baity media or so … !
Like this, the big positive externalities become the name of the game! Thank you!
Have a great day! And never forget, keep compounding: family, friends, hobbies, community, work, independence, capital, knowledge, research and mindset!
With respect,
Mav 👋 🤝

Thank you!