✍️ Maverick Special Situation #4: My name is Bond, Yield Bond! The Return of Yield! T-Bill & Chill ... T-Bond & Long (Part II)
Goodbye Negative-Yielding Bonds & Hello Decade-High Bond Yields. From TINA (There Is No Alternative) to TARA (There is A Reasonable Alternative) or BAAAA (Bonds Are Again An Alternative)
Dear all,
the S&P 500 reached the record 5,000 level in February which is a remarkable feat!
Maverick Equity Research also reached the 5,000 milestone with the newest 432 readers, and is now read across 132 countries & 50 US states! When I started out, I said to myself it’s impossible to reach such a broad audience via just pure research, meaning not paying for marketing: Twitter, Google search, doing Podcasts, big names and influencers in the industry, hence so glad I was wrong! Word of mouth = my way!
Welcome to Part II of Investing in Bonds/Credit/Cash in the current environment.
In case you missed Part I where I did set up the stage & answered how did we get here:
✍️ My name is Bond, Yield Bond! The Return of Yield! Getting Paid to Chill ... (Part I)
Today’s research structure is below & designed to have a natural flow to answer the big question: ‘Why Investing in Bonds Nowadays - Why Now?’
📊 Because They Pay
📊 Bonds Big Bear Market Shall be Over
📊 FED Interest Rates Outlook = Convexity for Bonds
📊 Sentiment, Flows & Positioning
📊 Valuation: Stocks vs Bonds, Bonds vs Stocks
📊 Buffett: ‘T-Bill & Chill’
📊 Asset Allocation
📊 Asset Location
📊 The Hedging Properties of Bonds
Before beginning, a note: the timing to make a business in the real world just like in investing is important. Though realistically, NOBODY can time things perfectly because nobody has a crystal ball, though with solid work and good research one can improve his or her odds materially. The idea is to be directionally right and not perfectly precise, and that by improving the risk/return dynamic, liquidity, opportunity costs & optionality features. In our context, I see 2024 as a time to rethink bonds/fixed income as an attractive risk/return opportunity for investment portfolios.
Why investing in bonds nowadays - ‘Why Now?’
📊 Because They Pay
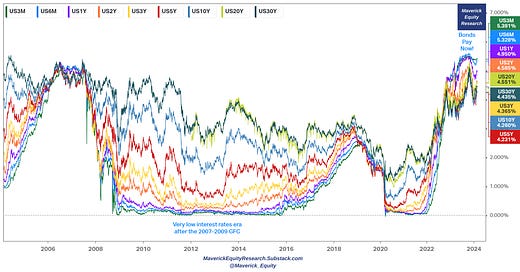
The reluctance to invest in bonds made sense when they weren't paying much in return, but things have changed & bonds look more appealing. In fact, investors can now be singing a slightly different version of Sabrina’s song Boys (Summertime Love) as in the following Maverick version "Bonds, bonds, bonds, I’m looking for a good time. Bonds, bonds, bonds, I’m ready for your love …" . US yields - 1y 2y 3y 5y 10y 30y since 1985:
3-month: 5.39%, 6-month: 5.32%, 1-year: 4.95%, 2-year: 4.58%, 3-year: 4.36%, 5-year: 4.23%, 10-year: 4.26%, 20-year 4.55%, 30-year: 4.43% as of February 21st 2024:
‘When was the last time one could earn almost 5%+ via a 1-Year riskless treasury bill?’
👉 2007 as the Global Financial Crisis was starting
Bonds pay also in real terms, let’s look at the 10-year:
👉 if in October 2023 we could have locked in a 2.5% real yield, now it is ~2% which is still great (10-year breakeven inflation rate in blue, 10-year treasury yield in red)
👉 given that the CBO (Congressional Budget Office) sees the US potential GDP growth at ~1.8%, locking in an above ~2% real yield is a good signal of a good valuation
Nowadays you do not need any special private banking / wealth management privileged account or so, you can buy bonds via your broker. Hence, below for you a great overview with whom pays what in the world of bonds, cash, credit.
Certificates of Deposit (CDs)
US treasuries (regular and zeros)
Agency/GSE bonds
Corporate bonds (investment grade)
Municipal bonds
Yields are very decent: plenty of 5-7%+ yielding opportunities via investment grade corporates … and one can push it even to 8-9% for equity like returns:
📊 Bonds Big Bear Market Shall be Over
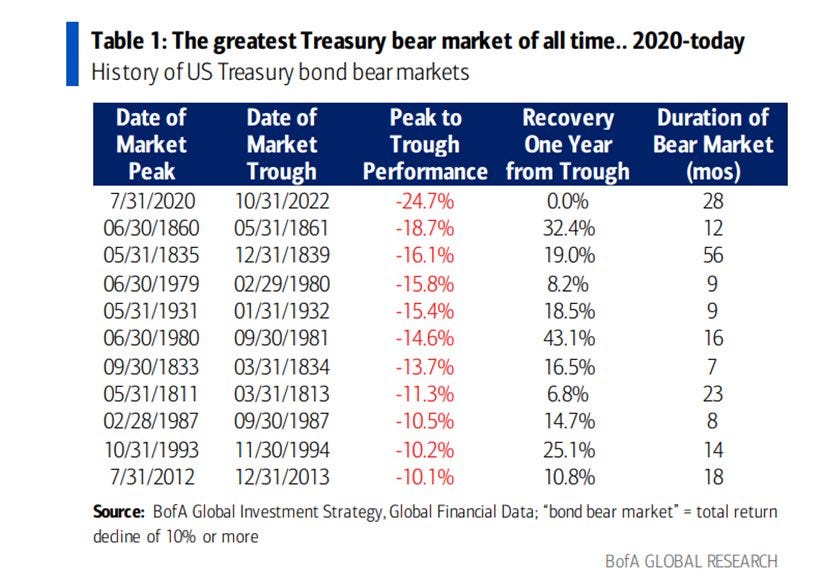
Treasuries recorded the greatest bear market of all time in 2022-2023
👉 check the historical returns in the column with the recovery 1-year from trough
👉 just like with stocks, after big heavy bear markets the returns are very good in the following 12-36 months - contrarian time!
👉 Hype, mania, exuberance are the enemies of investing, unless one uses that to his or her advantage to protect gains via hedging very cheaply. The saying is true: ‘hedge when you CAN, not when you MUST’, otherwise too late and/or expensive.
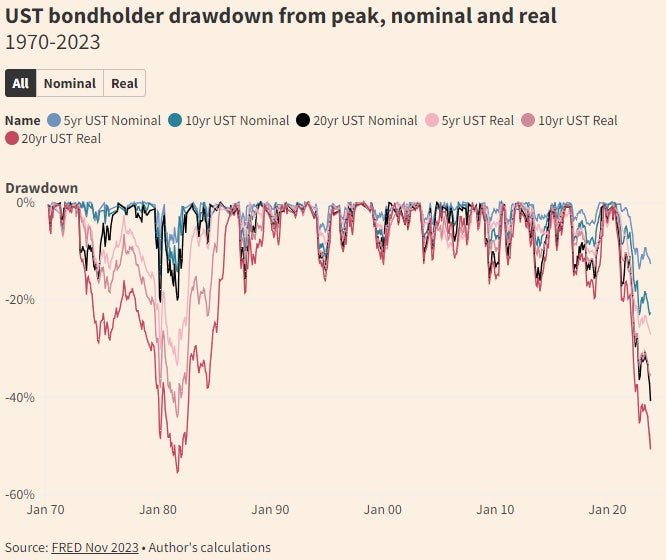
The historical steep bond sell-off via both nominal & real drawdowns
📊 FED Interest Rates Outlook = Convexity for Bonds
First of all, why we had the biggest bond bear market ever? Because high interest rates via the fastest FED hiking cycle in 4 decades (modern history) & that after a historical record low period of both the level of interest rates & length of time
Second of all, a key question, what is the rationale for FED cutting rates in general?
Rate cuts normally begin once the Federal Reserve has confirmation that the economy has slowed down and inflationary pressures have subsided
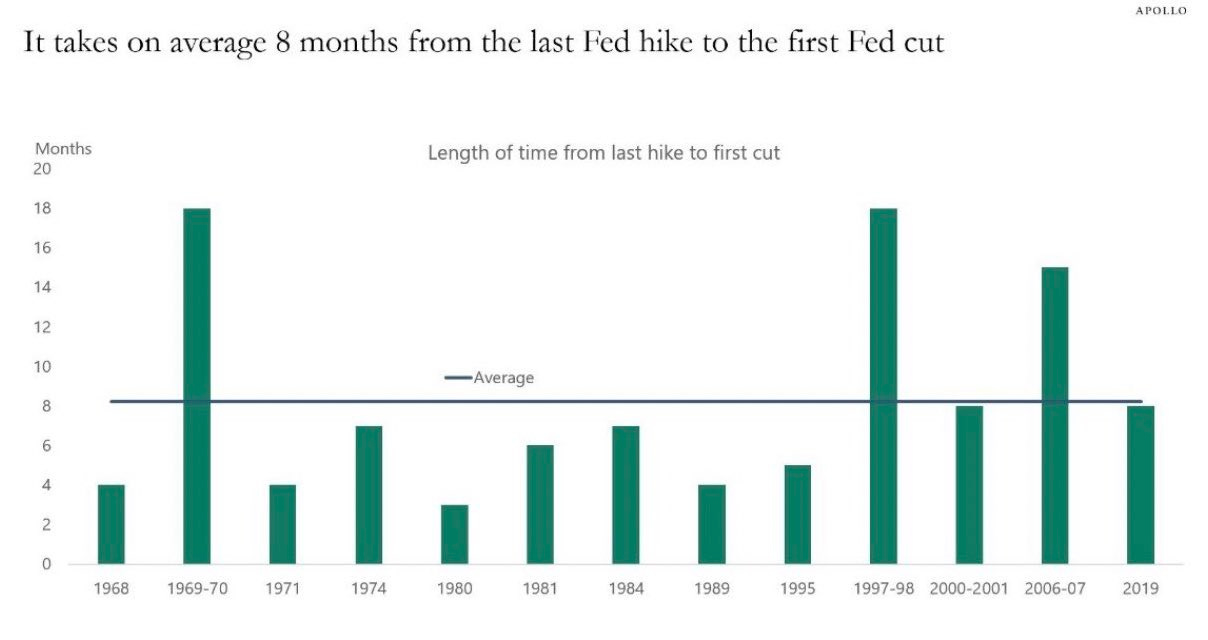
How long until the FED cuts rates? = the magic big question for investors here!
On average it takes 8 months from the last FED hike to start cutting rates
Last FED hike was in July 2023, hence about 6 months ago
When are financial markets pricing the 1st FED cut? It used to be quite certain it will be March 2024 (exactly 8 month after the last FED hike), though lately the probability got way smaller
👉 in my ✍️ The State of the US Economy in 45 Charts, Edition #2 report I showed how on the 15th of January the probability was 81%
👉 January 27th dropped to 46%, and as of February 18th just an 11% probability
Hence the 1st rate cut got postponed (given a very strong job market that I mentioned many times), though note how rate cuts are still to be expected, about 100 b.p. looking forward at the next 12 months
What is the pattern of FED cuts once it starts?
once the FED starts easing, deep cuts quite often come swiftly
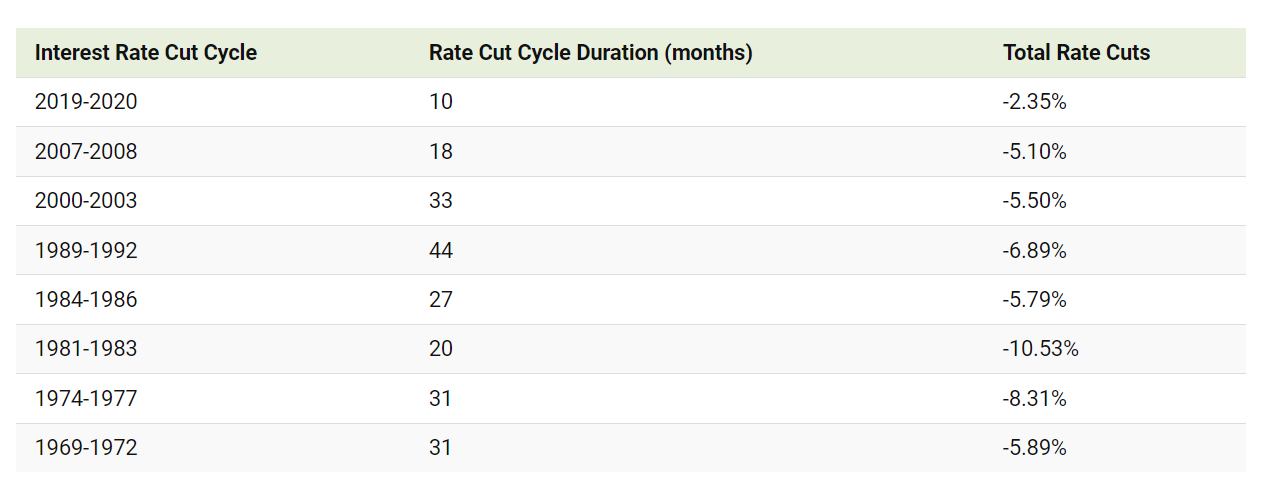
For historical context, looking back at past interest rate cuts we can see how quickly these easing cycles played out … especially those in the 1970s and 1980s.
Complementary view for gauging when do long yields peak - the 10-year treasury yield (green) and the FED funds target rate (dotted blue):
👉 the grey shaded area points to around the FED stops hiking rates, hence we can say that long yields defined here as the 10-year treasury has peaked
👉 hence, long duration quality bonds is what I am liking here
As well, the US 10-year yield, its 20-year mean, with +/- 1 & 2 standard deviations:
just recently the 10-year almost reached the +2 SD above its 20-year mean which
historically signalled a top and preceded falling yields which result in a huge surge in bond prices as yields plummet towards the mean
4.26% now, that’s above +1 SD & heading to its 2.91% mean as a base case scenario
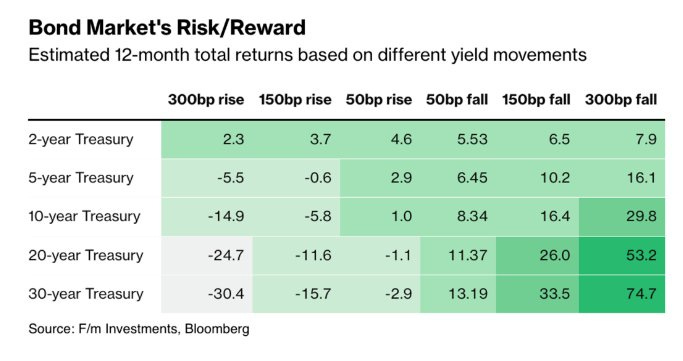
The Risk to Reward Ratio for treasuries is very favorable these days - this looked like a dinosaur nowhere to be found in the ZIRP ‘Zero Interest Rate Policy’ times:
👉 Upside & Downside for treasuries via sensitivity to various levels of rising/falling yields ... let that sink in and bring the sink: as you do that, watch the asymmetry that one can get for rates falling vs rates increasing … duration has traditionally benefited from falling interest rate environments … I like that …
👉 for example, should rates fall 150 bp (1.5%) in 2024, a 26% return is in the cards
Complementary, Upside & Downside view for a 1% fall/rise rates, and this time besides the 10 & 30-year treasuries, also the ‘AGG’ ETF which is a basket of investment grade bonds comprised of treasuries, corporate, MBS, ABS & munis.
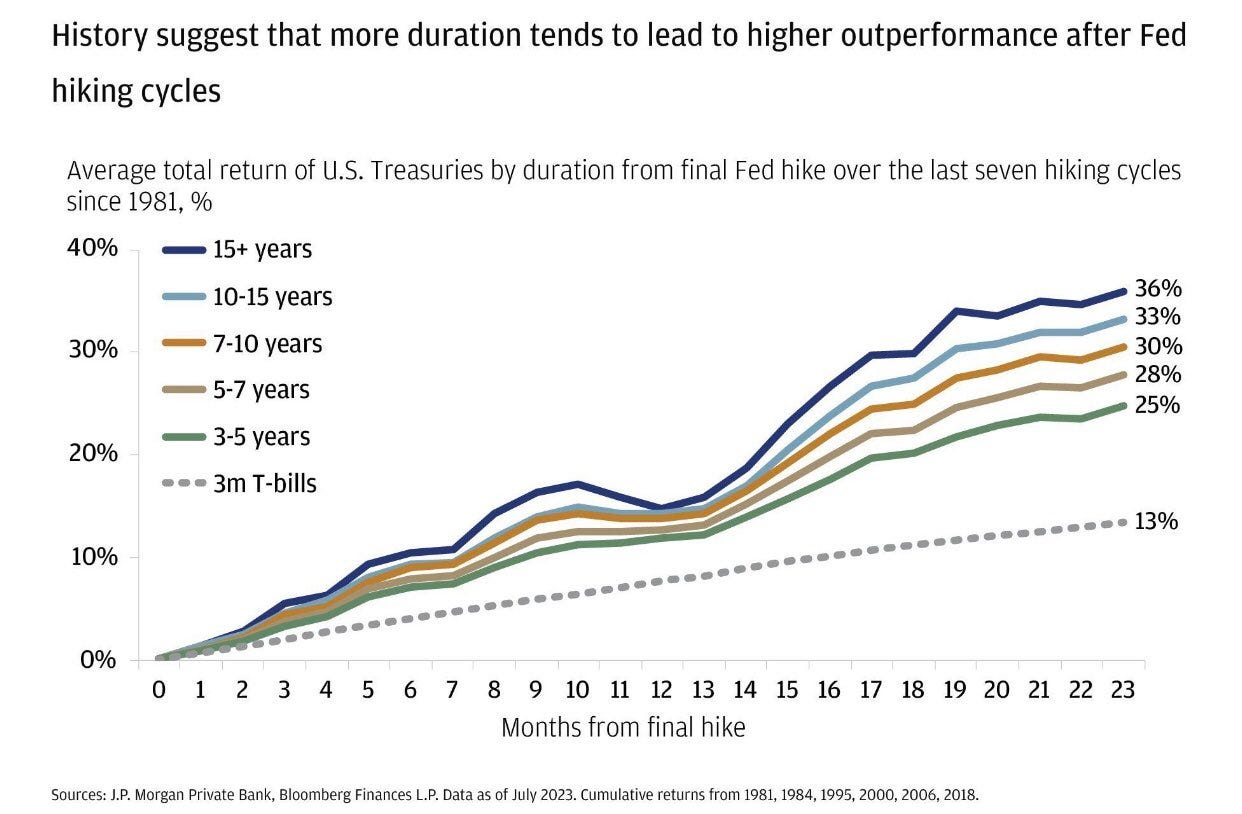
And now, US treasuries average total returns by duration from the final FED hike over the last 7 hiking cycles since 1981:
👉 the longer the maturity (the higher the duration), the higher the returns
👉 for example 15-year plus treasuries with a 36% return 23 months after the final hike + check also the other maturities that are not bad at all given essentially risk free
Expanding the universe with German and UK bonds (bunds & gilts):
👉 if yields fall by 50 bp (0.5%), the total return for US, German and UK bonds are around 8%, 6% and 8% respectively over the next 12 months
👉 if yields fall by 100 bp (1%), the total return for US, German and UK bonds are around 12%, 10% and 12% respectively over the next 12 months
👉 if unchanged, 4%, 2% and 4% while roughly flat if rates rise 50 bp (0.5%), and negative 3%, 6% and 4% should rates rise by 100 bp (1%) which is quite unlikely
In plain English, we have way more upside than downside, or positive asymmetry!
Note also how well US Bonds performed in 2008 when Lehman went bankrupt and the GFC was on-going (complementary note: only 3 times in almost a century when Stocks & Bonds combined had combined negative returns: 1931, 1969 & 2022)
📊 Sentiment, Flows & Positioning
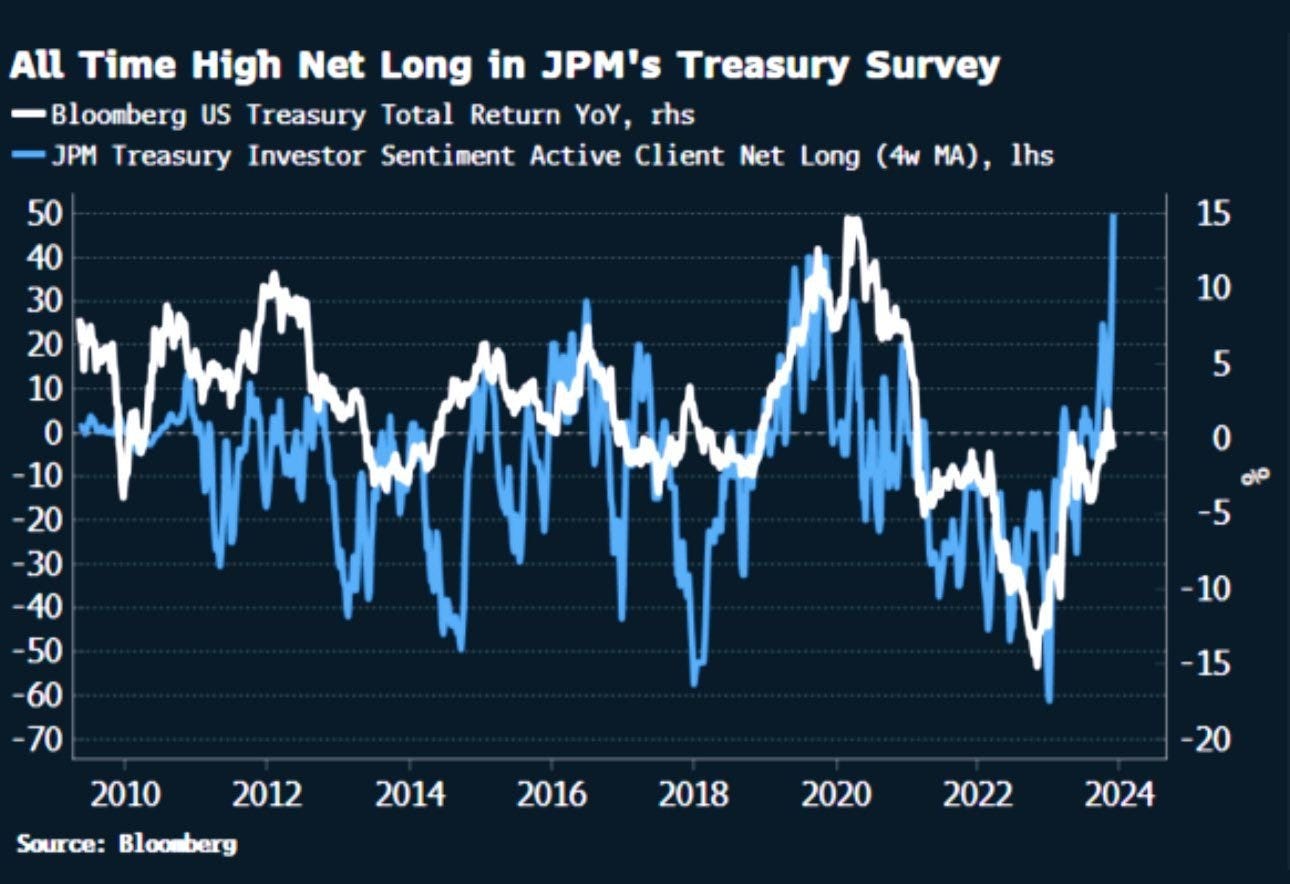
How is the investor sentiment looking like?
👉 all time high net long from JPM’s active clients side
Historically, flows/allocation into bonds pick up around the end of a hiking cycle:
Surveys, declared conviction & sentiment are one thing, want to see that backed up by some serious financial flows into bonds with long maturities? Just ask Tom Cruise in the 1996 Jerry Maguire movie:
Flows and drawdown of the TLT ETF (long-term gov bonds 20-year+ maturities):
👉 record financial inflows: more price drops, the more the inflows keep coming …
👉 $22 billion in 2023 alone, which ranks in the 2nd place ETF inflows, only VOO (S&P 500) attracting more flows
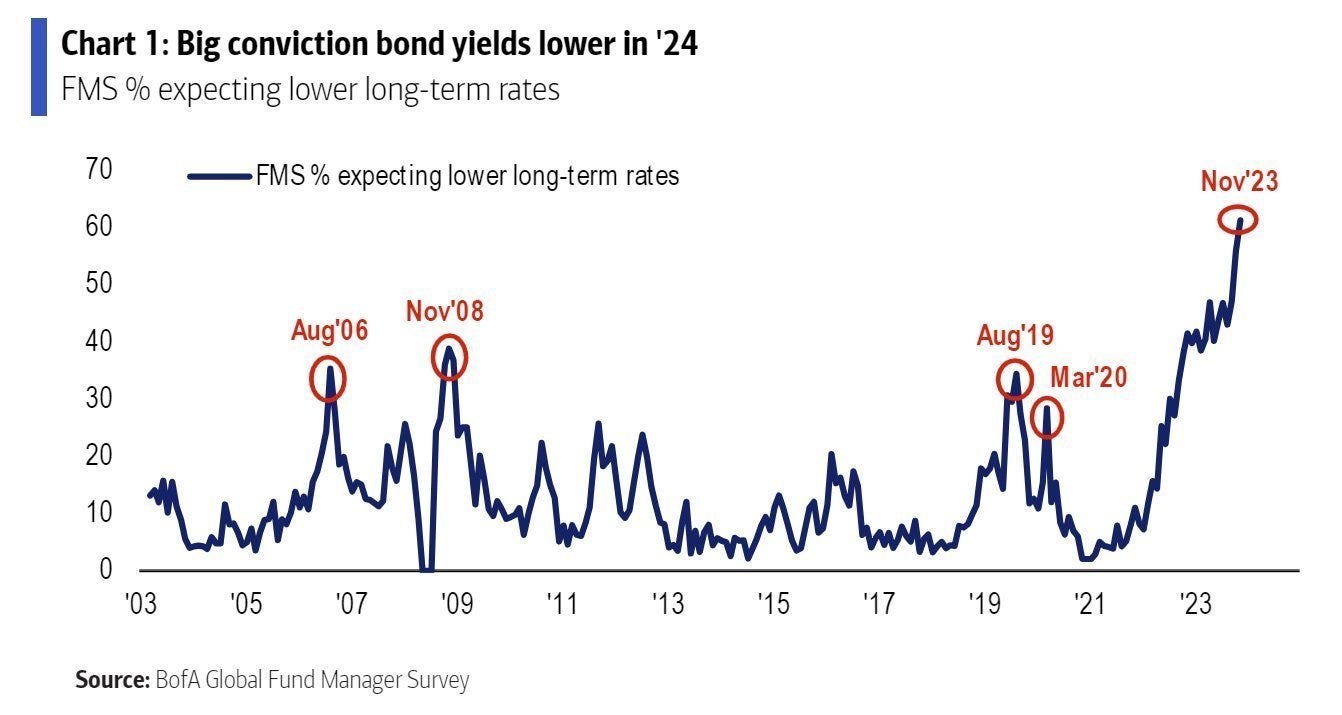
What do fund managers SAY globally?
👉 Big conviction for lower long-term rates in 2024
What do fund managers DO globally?
👉 they are overweight in bonds for the first time since the Global Financial Crisis which climaxed in 2009, at which point fixed income was outperforming ...
👉 now, they are following the logic of mean reversion and loading up with bonds after 18 months of historically terrible performance
📊 Valuation: Stocks vs Bonds, Bonds vs Stocks
Treasuries are the most attractive they've been relative to U.S. stocks since 2002 via the 10-year Treasury yield / S&P 500 earnings yield:
via the metric: 10-year treasury yield / S&P500 earnings yield
note how close we are to the +1 standard deviation as rising yields have kept increasing the relative attractiveness of bonds
Yield bearing assets offer attractive risk-adjusted yields relative to stocks
yields distribution since 1996: S&P 500 materially below the median while both treasuries (10-year & 3-month) and Investment Grade (IG) way above the median
Stocks relative to cash are their most expensive since the 2001 dot-com bubble when comparing the yield on 3-month T-bills (cash) to the dividend yield on the S&P 500
Goldman’s own measure of the equity risk premium (ERP), or how expensive stocks are to bonds also makes the S&P 500 look its most expensive in over 20 years:
Complementary via the ERP Equity Risk Premium (blue) & Stock-Bond ratio (yellow), stocks most rich to bonds they’ve been since 2002:
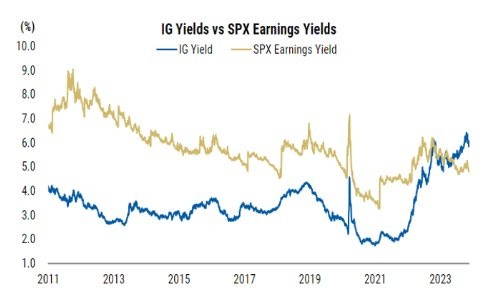
Complementary also via the IG (Investment Grade) yields vs S&P500 earnings yield, IG yields above S&P 500 yields which via the lens of relative risk-adjusted returns looks very good for IG bonds.
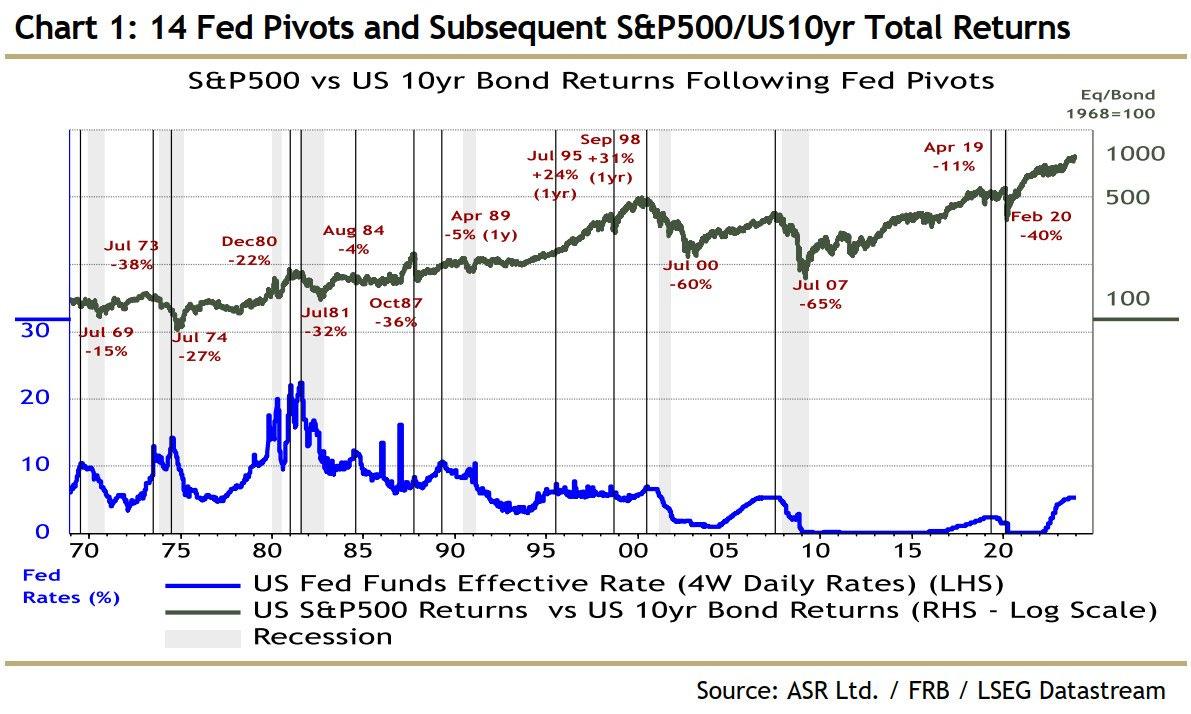
Bringing back here also the FED’s action via this chart which outlines the path of stocks vs bonds when the FED pivoted and started to cut interest rates:
👉 mostly, the stock/bond ratio is going lower when that happens and the rationale is classic: lower rates = good for bonds value while given that lower rates happen usually with weak or negative GDP growth, it is bad for stock’s earnings and sentiment
👉 therefore, if one thinks about allocations between stocks and bonds awaiting for the FED to cut interest rates, historical probabilities tell us: underweight stocks, overweight bonds
📊 Buffett: ‘T-Bill & Chill’
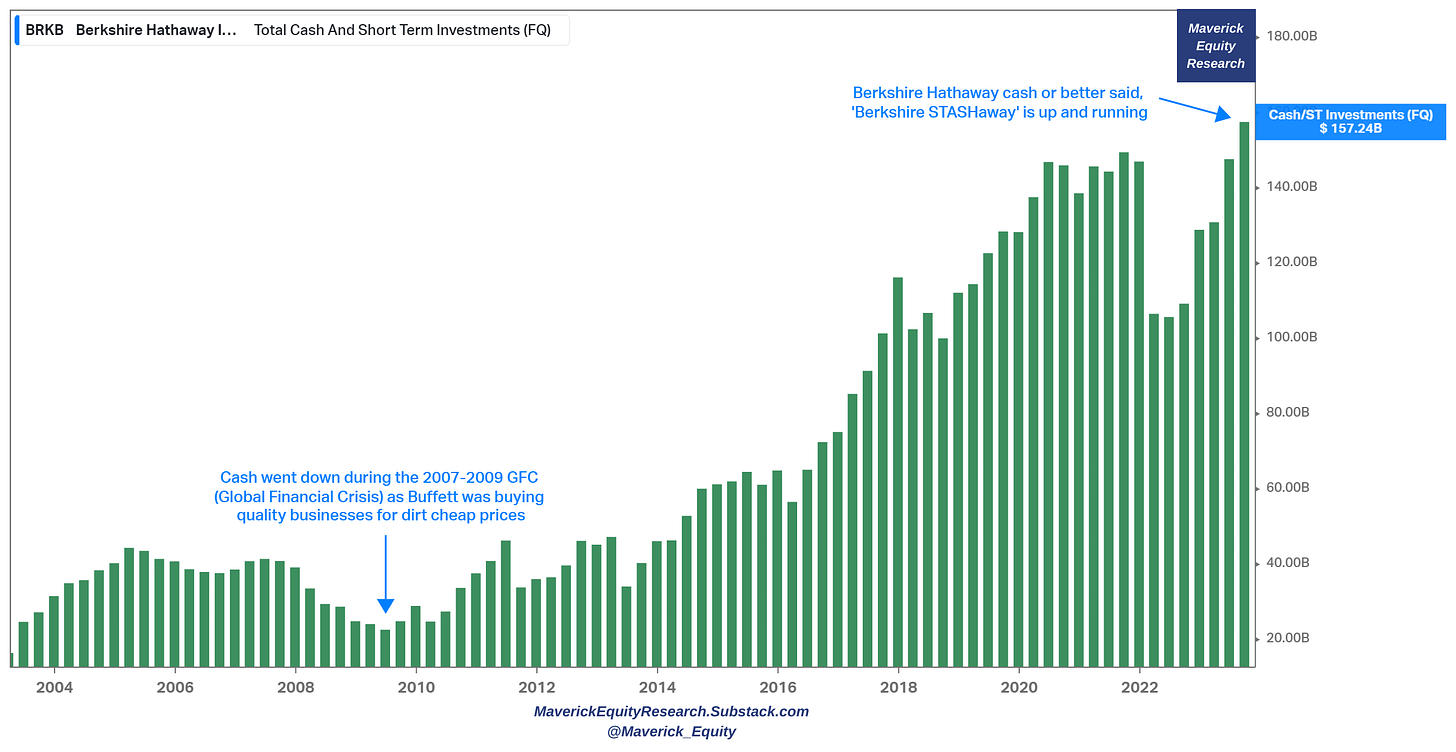
Does Warren Buffett like treasuries? Sure, buys every Monday! Berkshire Hathaway cash position could make it to rename it as ‘Berkshire cash STASHaway’":
👉 cash at an all time record of $157 billions, doing the ‘T-bill & Chill’ strategy
👉 note also how it went down during the 2007-2009 GFC (Global Financial Crisis) as Buffett was buying quality businesses for dirt cheap prices
👉 if by chance we get a recession (well, reminder: sooner or later it will happen, it is called the business cycle), what do you think Buffett will do? Same thing again … !
I call this the ‘T-bill & Chill’ or ‘T-bill & Wait’ strategy hunting for opportunities that always come along sooner or later … + a hedge in the same time = in bad times, FED cuts interest rates which makes bond prices go UP)
Berkshire 10Q from Q3 2023 also for for clarity:
And it’s not just Buffett, but Corporate America also:
👉 cash held by corporations is at an all-time high, way above pre-covi baseline
👉 treasurers in corporations basically locked in low interests with long duration on the debt/borrowing side, and are earning juicy yields on their cash right now
📊 Asset Allocation
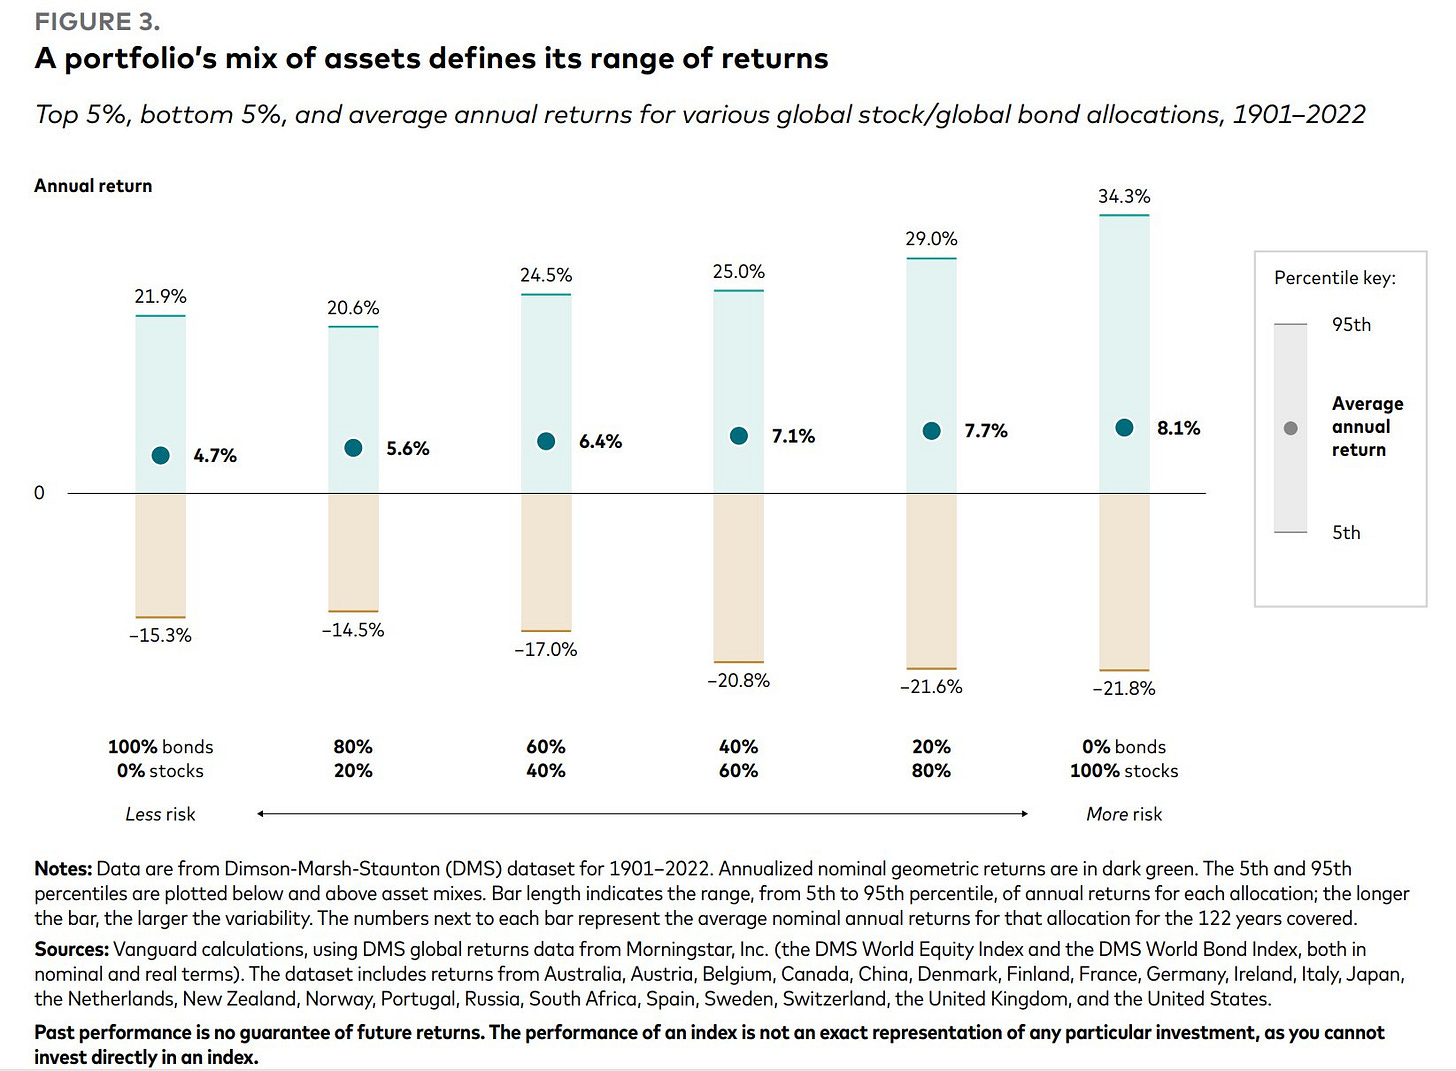
How do bonds & stocks allocations perform in a portfolio? 1901-2022 range of returns for various mixes of Global Stocks & Bonds, both average returns + top & bottom 5%
👉 100% bonds portfolio = 4.7% CAGR
👉 60% stocks, 40% bonds portfolio = 7.1% CAGR
👉 100% stocks portfolio = 8.1% CAGR
Take-away:
👉 adding bonds in a portfolio reduces volatility & drawdowns while the return sacrificed does not have to be big
👉 bonds provide decent correlation benefits and act as a recession hedge to stocks
👉 for maximising returns, equities for the win medium-long term - short term volatility needs to be stomached, if not able, more bonds given that nowadays they pay
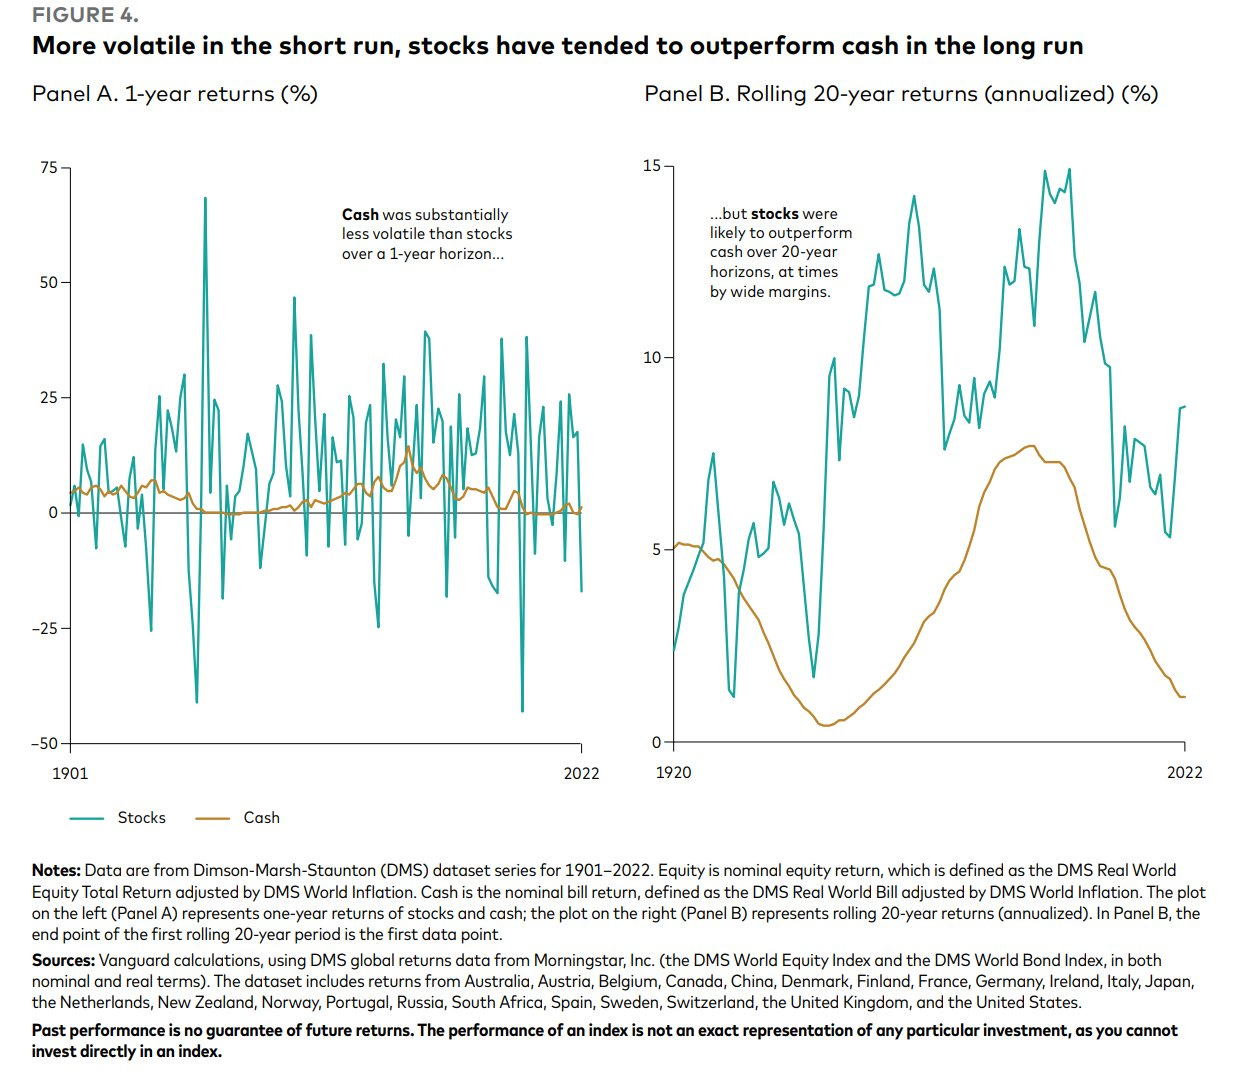
Cash (short-tern government bonds) = way less volatile than stocks over a 1-year horizon, but stocks outperforming over 20-year horizons & at times by wide margins ...
The same message, great chart assuming cash returns 5% & international equities 8.5%
👉 stocks outperform cash meaningfully over time: +22% after 5 years, +63% after 10
👉 that happens because they are cash flow producers and carry the equity risk premium (ERP) due to the downside risk & volatility, hence investors have to be compensated for stomaching short term issues, it’s that simple
📊 Asset Location
Asset location is a key yet vastly overlooked aspect in constructing great efficient investment portfolio. If you had formal training and/or experience this is not new, but I’ve seen even plenty experienced people not putting enough time into it, ignoring until later when it has to be considered before investing.
Asset location is not about the geographical asset allocation of your investments, but it is about the type of tax account you will use for any given investment. It depends on the jurisdiction (check yours), but in general we have 3 types of accounts:
Taxable Account - that is your brokerage account
Tax Free Accounts - for example ROTH in USA, or TFSA in Canada
Tax Deferred Accounts - for example IRA in USA, or RSP/LIRA in Canada
The general implication for our investing in bonds research is:
bonds pay coupons, hence are considered income, hence taxed as income … but not in all cases e.g. consider your bonds allocation for what kind of account it is suited best BEFORE investing per se … you might pay NO TAX at all on bonds …
know the tax code and make your asset allocations in general as efficient as possible … keep compounding in the best fashion possible …
📊 The Hedging Properties of Bonds
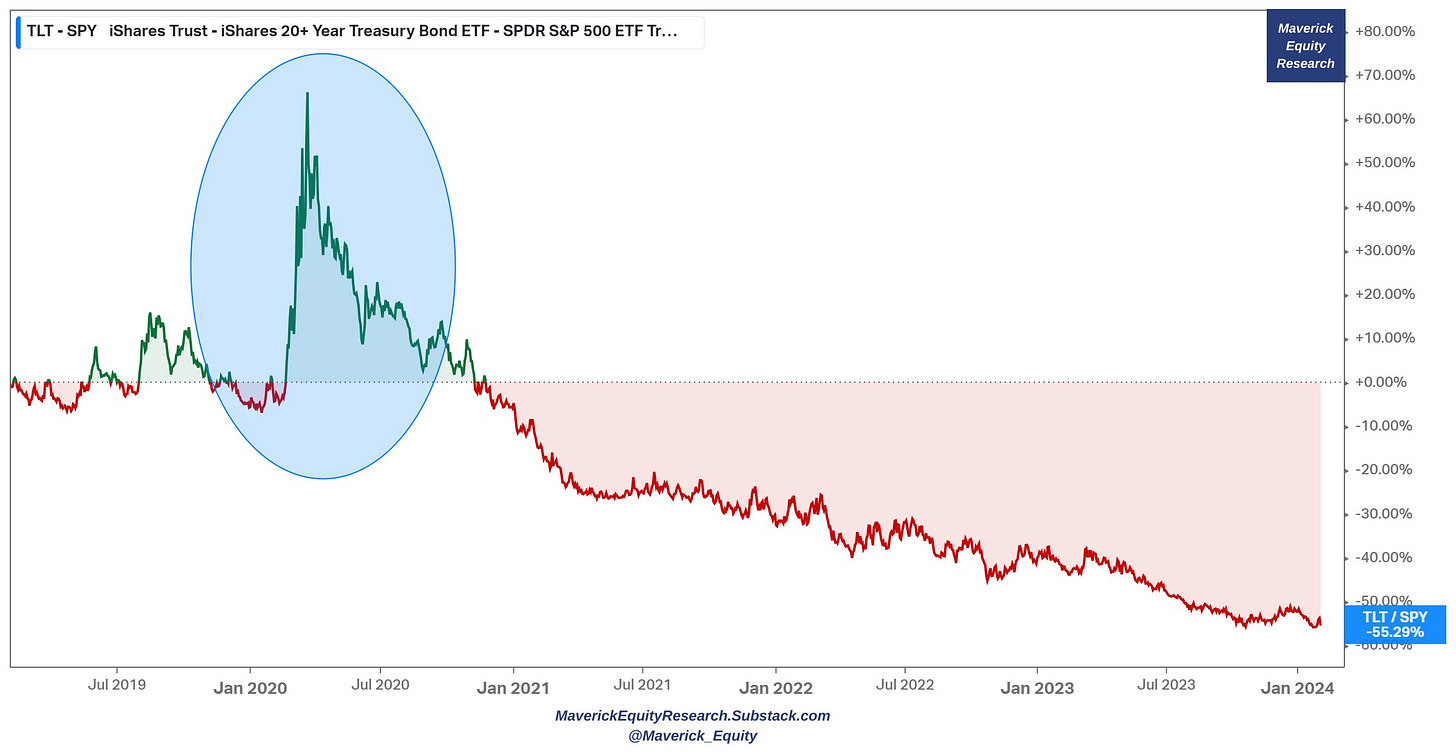
Perfect time now to consider the hedging properties of bonds in a stocks portfolio! FAQ also answered with this occasion + 'show me a graph on hedging, something ... many talk, talking is easy and cheap' There you go, Maverick chart that says 10,000 words!
👉 TLT (long dated US government bonds) / SPY ... see the 2020 pandemic green parabolic bonds run relative to stocks ...
Going back further in times besides the 2020 pandemic:
👉 the 2007-2009 Global Financial Crisis and
👉 2012 European Sovereign Debt Crisis
= Similar hedging properties of bonds activated: reducing drawdown, helping folks not go crazy, stick to the plan and keep compounding,. Stocks shall beat bonds on any given medium-long term because stocks = cash flow, bonds = debt aka promise to pay, though bonds can be good nowadays as they pay given the high(er) interest rates… .
We can also see the useful and key stocks & bonds correlation across time:
👉 the longer-term negative return correlation relationship is what makes banks a portfolio diversifier, hence the 60/40 (stocks/bonds) popular portfolio
👉 bond exposure has a role in reducing portfolio volatility while producing income
👉 2022 correlation was positive as both stocks & bonds suffered, but as we pointed out above, this is an outlier case as only 3 times in almost a century when Stocks & Bonds combined had combined negative returns: 1931, 1969 & 2022
A key question now: are financial flows picking up these days into bonds? Yes, and with record flood of cash has poured into the both ends of the Treasury yield curve:
How comes allocations/flows are record on both the short & long maturities?
As shown above via the matrix chart depicting ‘Upside & Downside for treasuries via sensitivity to various levels of rising/falling yields’:
👉 short term bonds pay now decently and in case interest rates drop (normalise), via a total return basis (coupon payment and price return) it would still be positive
👉 long term bonds would benefit a lot via a total return basis given the biggest losers in this era of Federal Reserve hawkishness, hence to bounce back as a slowdown and/or recession would ignite the bond-safety trade
In other words, investors are looking to park cash and seize the highest interest payments in more than 2 decades via the short dated treasuries, and/or on the potential juicy returns from a rally in the long dated treasuries once interest rates peak and headed lower. The long dated bonds look good especially for the scenario where we will have a slowdown in overall economic activity and/or a recession. Hence, Soft landing or Hard landing of the US economy? No problem, can keep compounding!
Alternatively, while stocks for the medium-long term are the winners, for a while and/or with some parts of the portfolio, cash/bonds are a nice way nowadays to:
keep compounding & even potentially get equity-like returns, meaning good very good risk/return money to be made + lower volatility + the potential convexity +
diversification in a potential recession & ability to buy when many need to sell stocks, meaning an often unknown effect: the ability to rebalance generated profits/liquidity into cheaper and cheaper equities which improves materially the compounding years after
optionality to wait to deploy it when cheap opportunities in equities along, and they always come, just note that PATIENCE is a virtue!
And all the above into 1 meme:
👉 Cash/Bonds/Credit = no FOMO (Fear of Missing Out), no YOLO (You Only Live Once), but = JOMO 😉 (Joy of Missing Out)
Research is NOT behind a paywall and NO pesky ads here unlike most other places!
Did you enjoy this extensive research by finding it interesting, saving you time & getting valuable insights? What would be appreciated? Sharing it around with like-minded people and hitting the ❤️ button. This will help me bringing in more & more independent investment research: from a single individual, not a company of any kind!
Also some of you asked how can one support my work which is really kind of you 🤗. Therefore, it would highly appreciated if you would support the ‘Maverick-esque’ ongoing & future research. Some of you asked if they can donate via CashApp, but I cannot open an account from Europe. A donation/tip can be done via the following:
Thank you and have a great day!
Mav 👋 🤝





















Very comprehensive, very helpful!
Has anyone studied the correlation between the maverick newsletter and the S&P? 😁
Onwards and upwards Maverick!