✍️ Maverick Charts & Markets - June 2024 Edition #19
S&P 500, US Economy, Tech, Short Sellers, Wages, Wealth & Taxes, Money Market Funds, Bonds & Yields, Nvidia & Vertiv, Wise, Financial Flows, Bank Branches, Gold, Government Debt, US Energy & If you...
Dear all,
there you go with June’s 25 charts + bonus that I carefully cherry picked for you as these monthly wrap ups are done so that many can connect the dots across markets!
Delivery is in typical Maverick fashion, via charts that say 10,000 words covering Macro, Stocks, Bonds & More which also naturally connects the Geopolitics dots.
Research is NOT behind a paywall and NO pesky ads here unlike most other places!
What would be appreciated?
Just sharing this around with like-minded people, and hitting the 🔄 & ❤️ buttons! That’ll definitely support bringing in more & more independent investment research!
First of all, check this amazing stat from the one & only tennis icon, Roger Federer!
👉 Roger Federer won almost 80% of all his matches during his career (1,526 singles matches)! How many POINTS you think he won? Let this one sink in: only 54% ... !
'The truth is, whatever game you play in life, sometimes you are going to lose: a point, a match, a season, a job ... it's a roller-coaster with many ups and down, and it's natural. You want to become a master of overcoming hard moments. The best in the world are not the best because they win every point, it's because they know they will lose again and again ... and have learned how to deal with it ... .!'
S&P 500 with a fresh all-time high at 5,584! And let this one sink via Maverick:
Despite since 2020 we had quite some historical moments and events:
👉 a pandemic, ramping inflation, high interest rates, an energy crisis, some banks that went bust (Credit Suisse in Europe, SVB & FRC in USA etc), a worldwide bottled supply chain, US politics circus (well, that is always there), a freakin' war in Europe then now Israel Hamas war …
✅ S&P 500 still returned ... 83.6%! which equates to a = 14.39% CAGR to investors = all while sleeping = very very very good …
Moreover, if patient and with a sleek approach:
👉 even more via solid businesses outside of the S&P 500 + diversification benefits
👉 opportunistic buys + occasional deploying options as an overlay = further extra
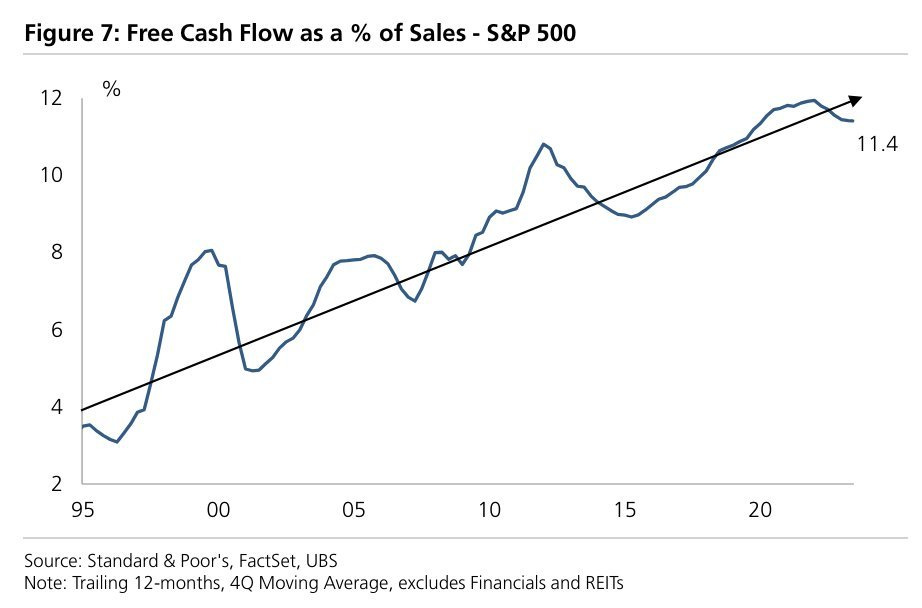
S&P 500 cash flow generation is strong baby!
👉 Free cash flow as % of Sales tells us that the S&P 500 valuation is justified
“S&P 500 companies have been generating more cash flow over the past 3 decades, justifying higher valuations“ via UBS's Golub
In case you missed my 2 distinct deep dives on the mighty S&P 500, there you go:
✍️ S&P 500 Report: Performance, Profitability, Sentiment & More - #Ed 5
✍️ S&P 500 Report: Valuation, Earnings & Fundamentals + Special Metrics #Ed 5
US Sales Managers Survey Suggests GDP Growth Will Continue Into Q3 2024
👉the US Sales Managers Survey Results for June reflect a likely acceleration of GDP growth levels seen in previous months of this year. All growth-related Indexes suggest an expectation of continuing modest-to-rapid economic expansion.
👉 Real GDP YoY growth in excess of 2% is likely to continue into the 2nd half of 2024
👉 So far, the great engine that is the American economy seems to be working well, largely untroubled by the anti-inflationary rises in interest rates, or the continuing shadow of disturbing political change globally that may impact negatively on economic growth.
Note: Data Shown as a Diffusion Index. (50 = 'No Change', above 50 = Increasing growth, below 50 = Declining growth)
In case you missed my latest on the US economy, there you go with my 3rd edition:
✍️ The State of the US Economy in 75 Charts, Edition #3
Dear all, welcome to the 3rd edition covering the US economy via the macro lens, a further improved independent research report with some even more sleek Maverick charts! Structured: 8 parts + Bonus and designed to be a very comprehensive and inclusive report.
Equities Chart of the Month = The 'Big 5' US Mega Tech
👉 Apple, Amazon, Meta, Microsoft & Google are sitting on > $400 billion in cash and
👉 have highly profitable core businesses = more than 1.5% of GDP
Let that one sink in ... and ... bring the sink if you wish!
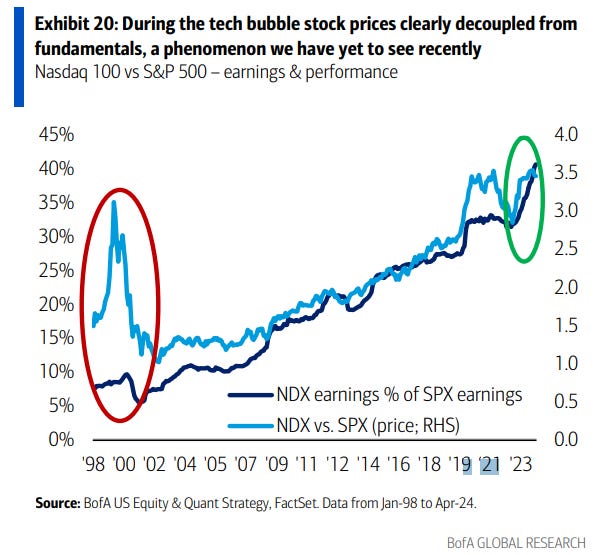
What about the Nasdaq 100, do we have a tech bubble or not? Why nope?
👉 in the 2000s tech bubble prices disconnected big big time from fundamentals (pets dot com, price/click) ... while these days that is NOT the case ...
👉 Nasdaq 100 and S&P 500: earnings and performance
Via BofA: “As asset bubbles form, a key reason volatility rises is that stocks start trading purely on momentum, decoupling from their fundamental tether (where fundamentals exist). Exhibit 20 shows how this tether was broken in the Nasdaq in 1998-2000 (vs the S&P), in contrast to how closely linked fundamentals & tech stock prices appear today.”
Short Sellers in Danger of Extinction After Crushing Stock Gains
👉 Activist campaigns by short sellers declined from 280 campaigns in 2015 to only 110 campaigns in 2023 … let that one sink in!
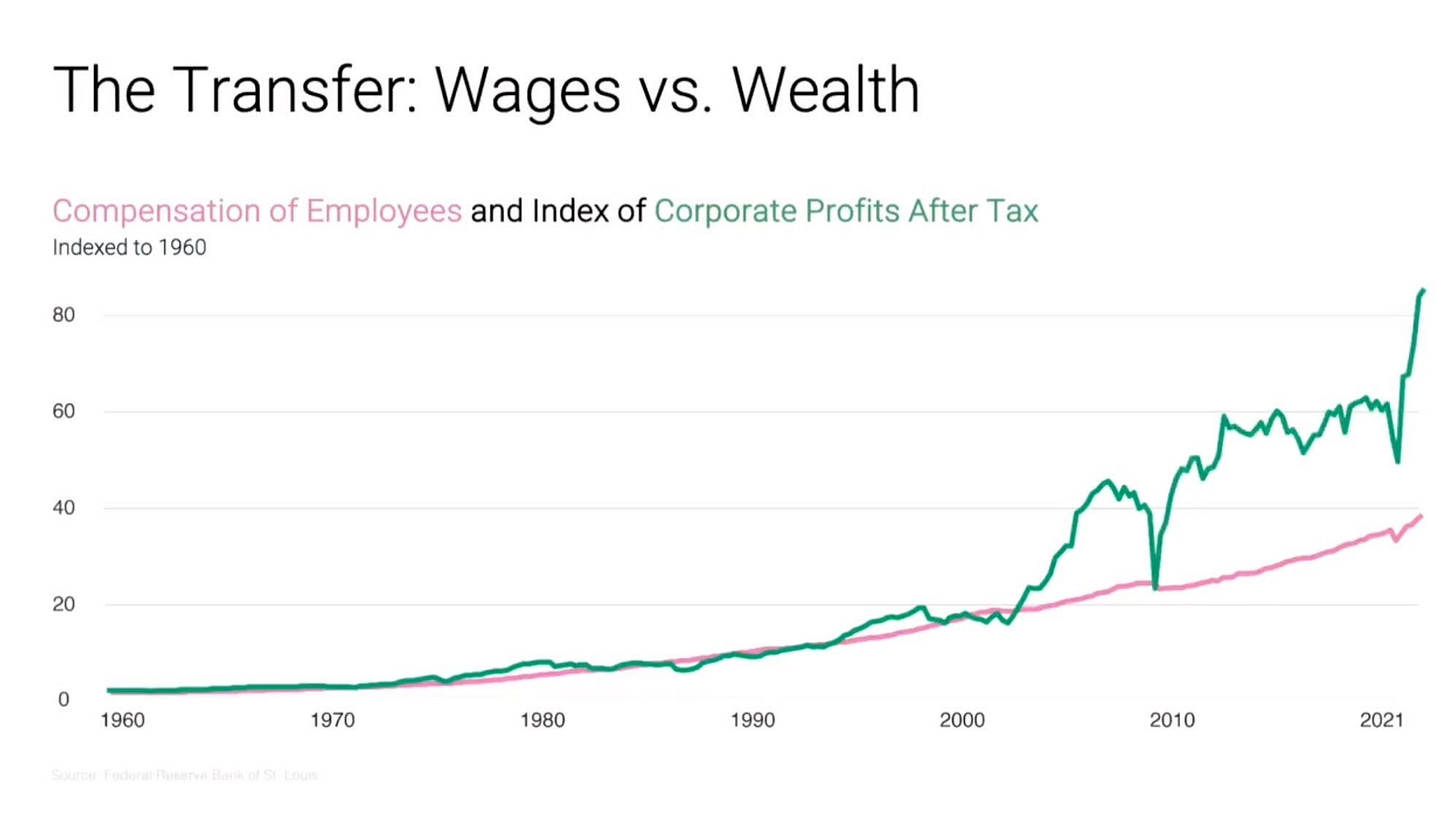
Wages vs Wealth via compensation of employees vs corporate profits after tax
👉 voice of the narrator: work, save and invest, otherwise ...
Tax on labor vs tax on capital + Wages growth vs stocks growth in the last 8 economic expansions = inequality anyone?
👉 ‘Check the delta bro'! ... double whammy for non-investors / non-capital earners ... the dangers of NOT investing ...
Number of 401(k) millionaires at Fidelity is up 43% since March 2023, take that!
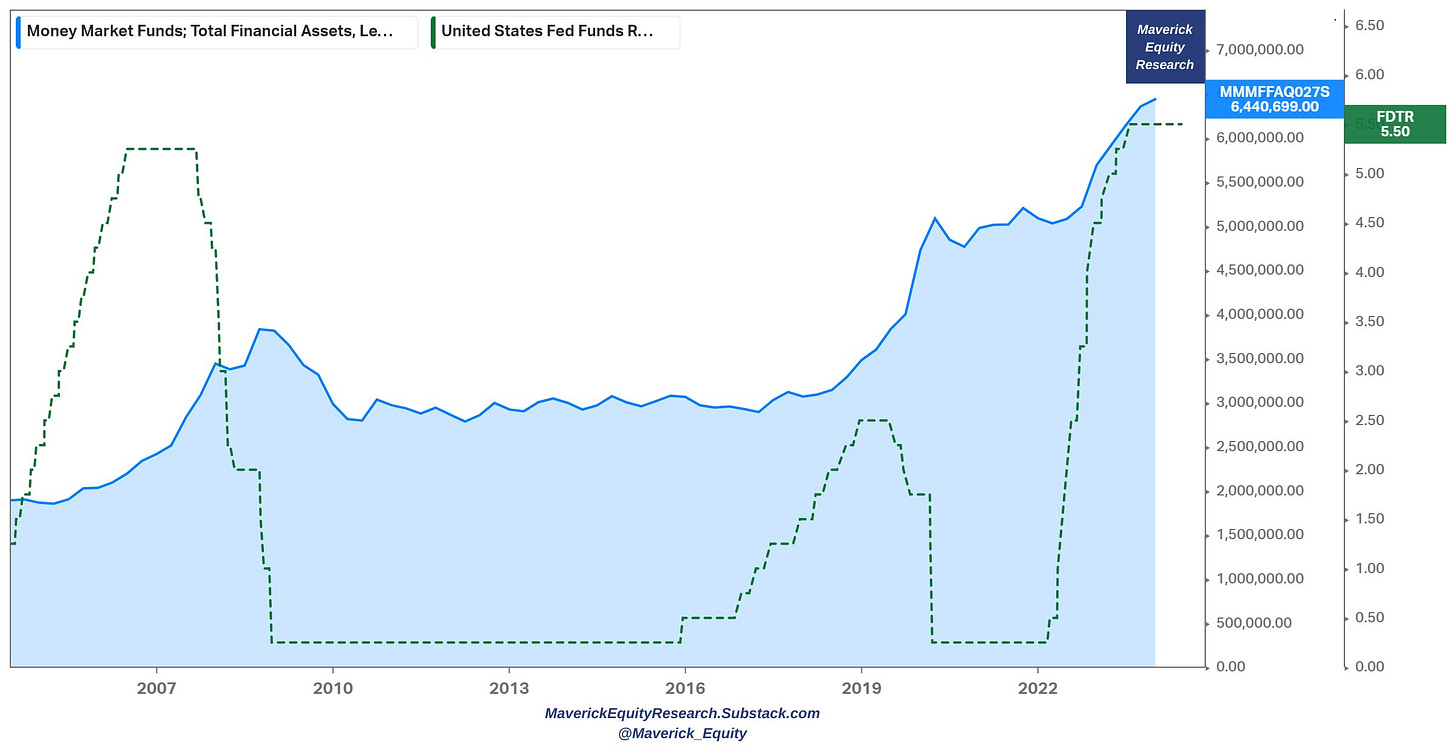
Money Market Funds (MMFs) total: besides stocks, high interest rates reward investors also, hence MMFs register also record highs in terms of assets levels
👉 MMFs total financial assets with record highs above $6.4 trillions (blue)
👉 the higher the rates driven by FED hiking rates (green), the higher MMFs assets
👉 If we count time deposits, we soon reach 9 trillions ...
Did Retail Investors react from deposits paying peanuts? For that, there you go with retail MMFs distinctively:
👉 yes, they did … also at record highs above $1.8 trillion
👉 note also below the price change % record high growth
How much money did in absolute terms investors make in 2023? Ain’t peanuts!
👉 around $300 billion in interest income (more than in the prior decade combined)
Could private individuals reacted more out of deposits? Are they losing out?
👉 Yes, let this one sink in: $17.5 trillion cash Americans have in commercial bank accounts yielding an average of just 0.45% ... PEANUTS!
What about US long-dated government bonds?
👉 TLT (20+ Year Treasury Bond ETF): record flows (almost 50 billion), price bottoming ... fed funds rate peaking … thoughts? I think you know mine …
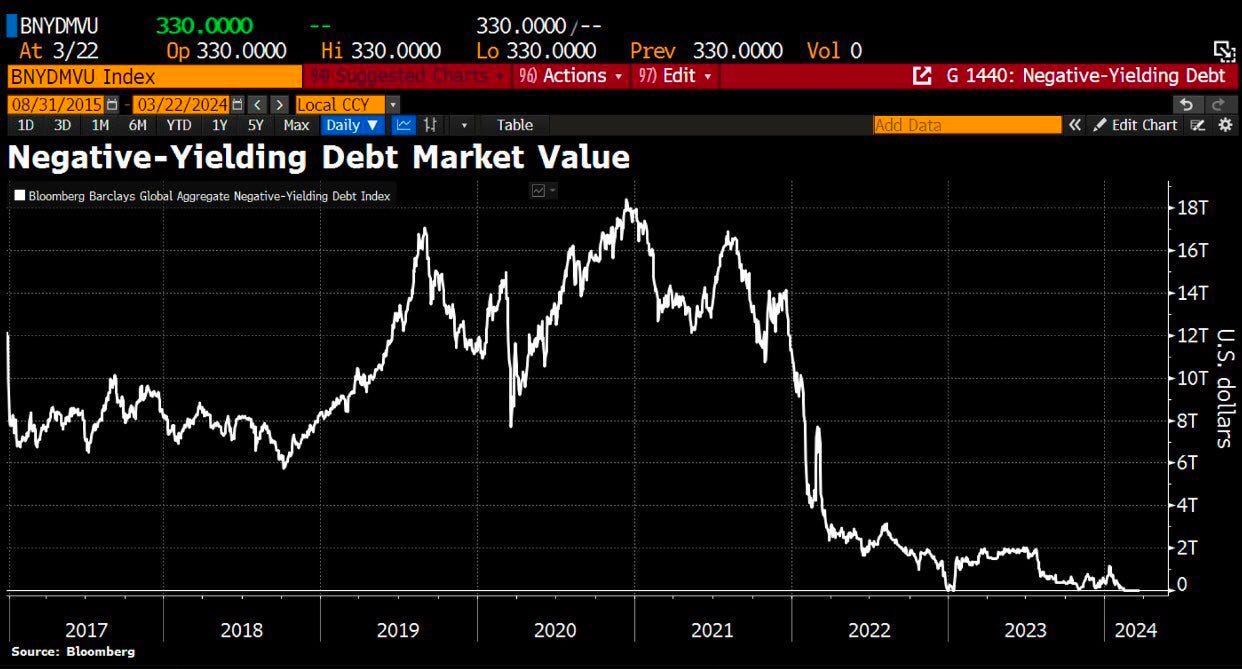
Negative yielding bonds that we had for quite a while, remember them?
👉 not here anymore, but many people asked themselves and myself something like this: ‘why and who bought buy them in the first place? it’s a guaranteed loss!’
👉 well, it is a loss if held to maturity … but check what I did / many bank treasury departments (ALM): buy negative, sell higher at a bigger negative ;) ... minus with a minus makes a plus ;) … and no, this is not a joke, it worked …
In case you missed my 2-part deep dive series on Investing in Cash/Credit/Bonds:
✍️ My name is Bond, Yield Bond! The Return of Yield! Getting Paid to Chill ... (Part I)
✍️ My name is Bond, Yield Bond! The Return of Yield! T-Bill & Chill ... T-Bond & Long (Part II)
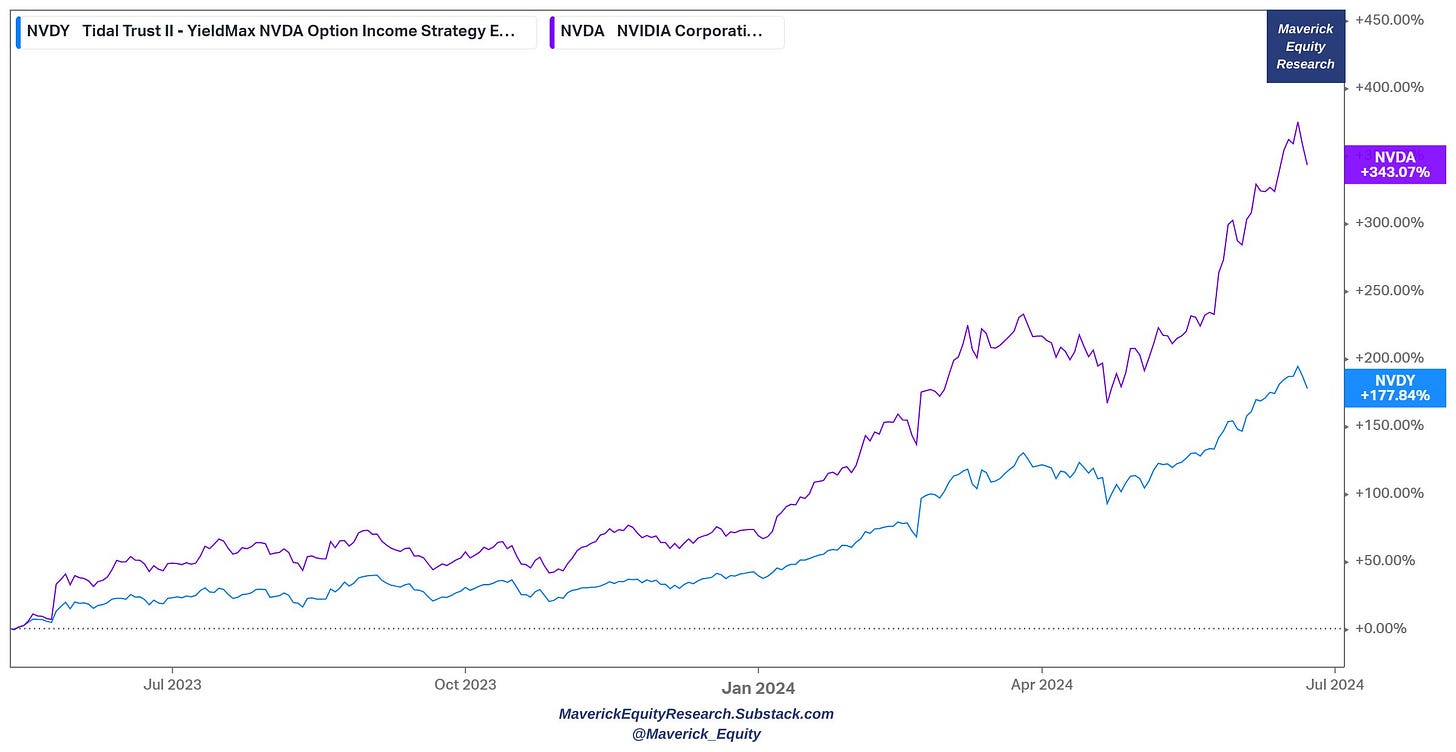
Curious about Nvidia also like the whole market?
👉 Nvidia and an ETF derivative on it YieldMax NVDA Option Income Strategy ETF (Total Return = chart 1, Dividend yield & dividend payments (monthly) = chart 2)
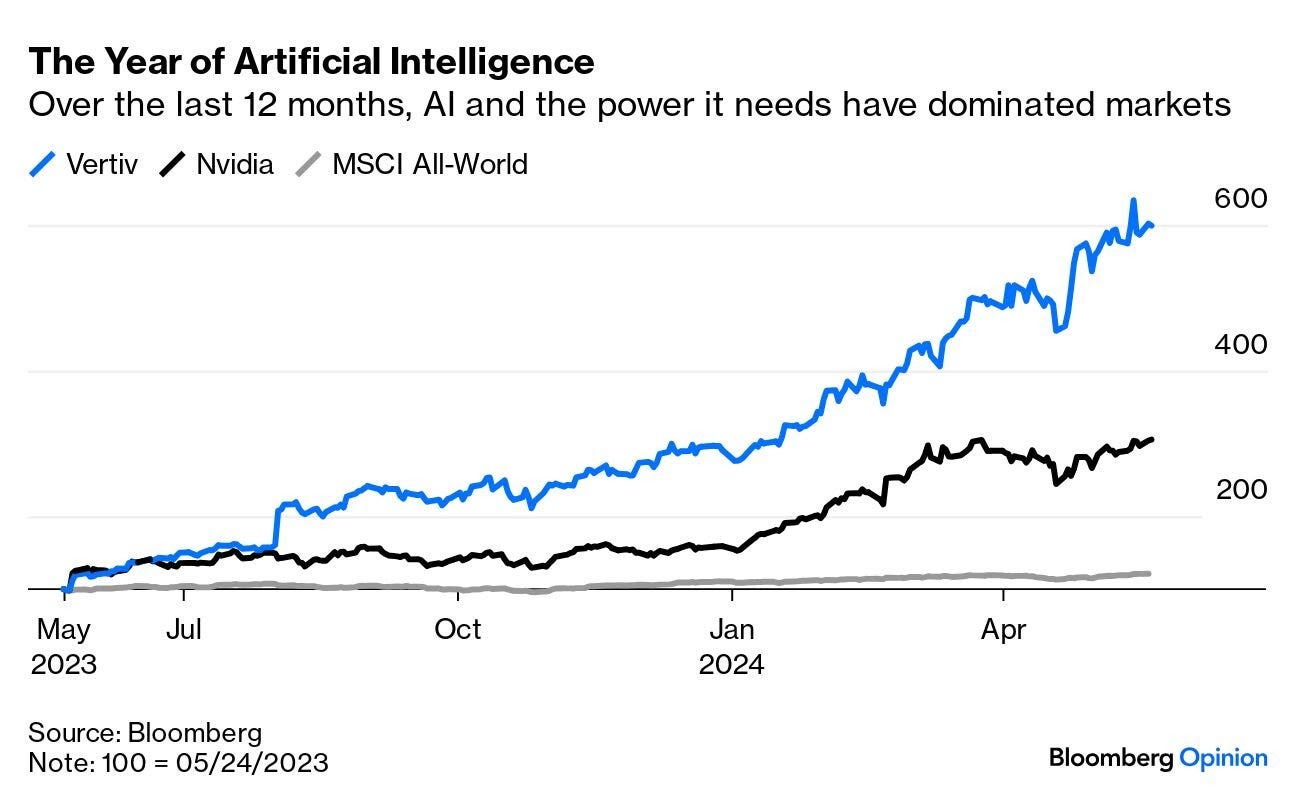
I am not much into what the market talks all the time, forget Nvidia, check Vertiv
👉 Vertiv relative to Nvidia and MSCI World ... Vertiv Holdings Co., which makes power and cooling equipment for data centers, has far outperformed Nvidia since Nvidia Day …
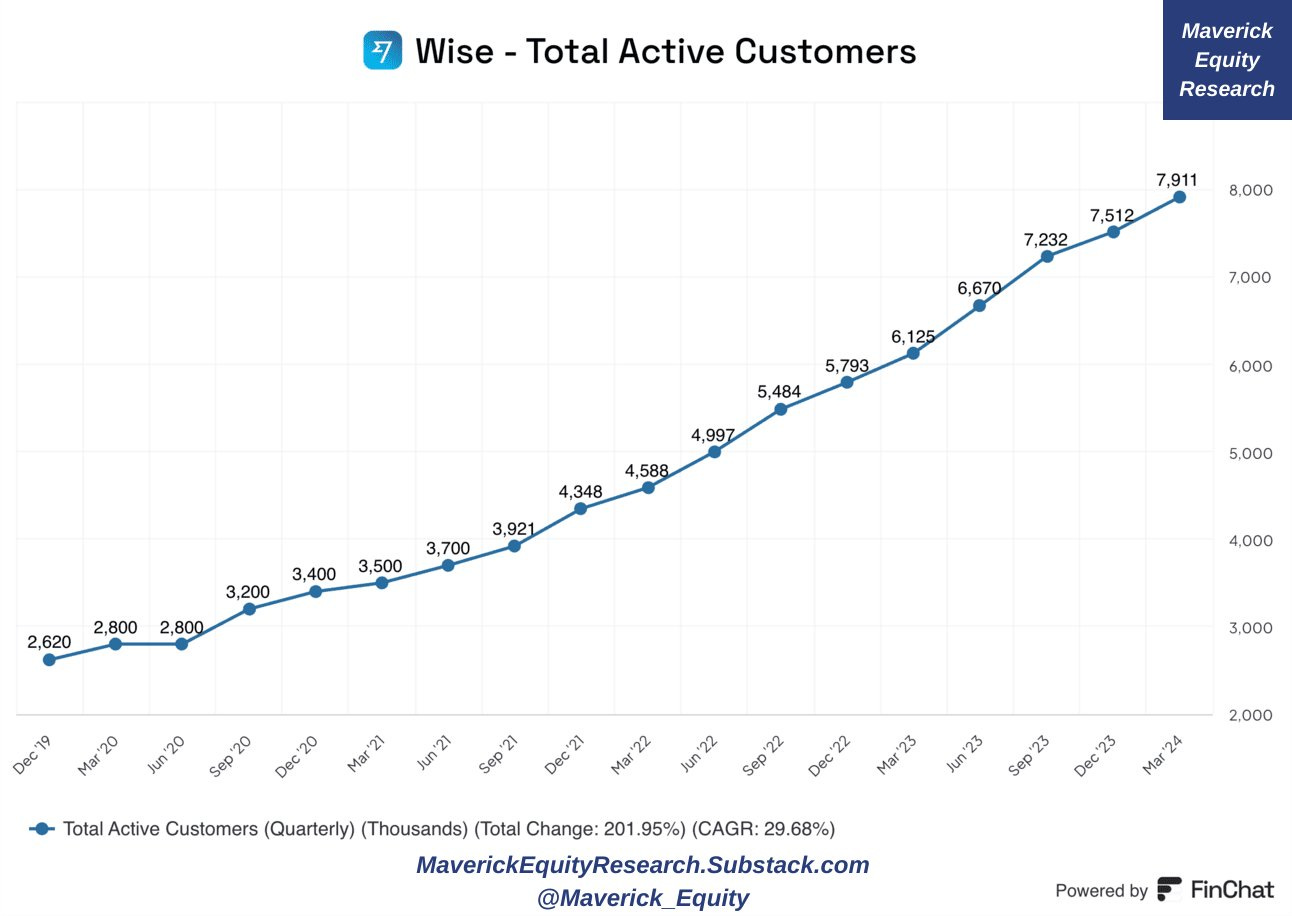
WISE (WISE) KPI: Total Active Customers
👉 UK-based cross-border payments provider Wise reported its 4th quarter results this week = revenue and earnings came in above expectations, but the company’s guidance for 2025 underwhelmed investors.
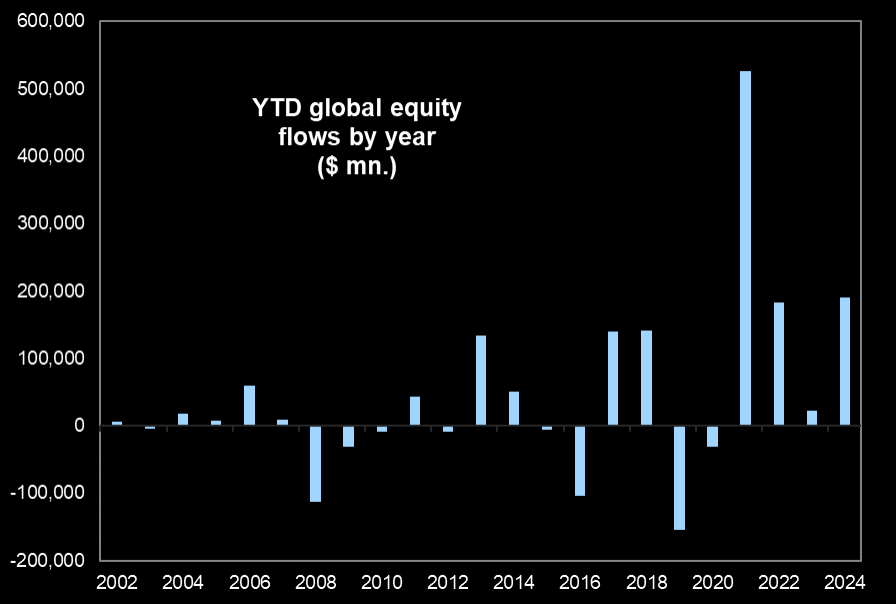
Stocks Inflows Mania
👉 "Global equity funds have seen $190.5 Billion inflows YTD, the 2nd largest equity inflows on record (only 2021 saw more inflows). This is +$1.7B worth of equity inflows per day." via GS
Individual stocks purchased by retail investors since 2018 ... big big buyers ...
US bank branches: after peaking in 2012 at 83k, 13k have closed since then
👉 I personally did run a strategic project where we just did that 'transition' in Europe ... brick & mortar VS digital (omni) channels at it's best …
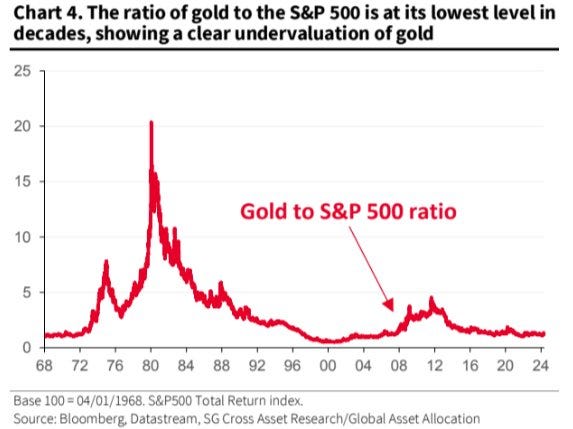
Ratio of Gold to the S&P 500 - gold a bad investment relative to the S&P 500
Europeans hold way less stocks than US households
👉 not a surprise then that Europeans are less wealthy, right?
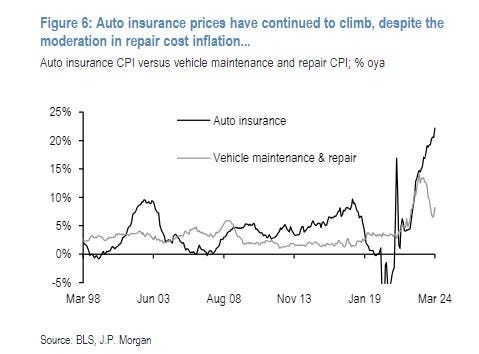
Auto insurance skyrocketing in the US despite lower repair cost inflation
The higher the government debt, the lower the interest rates - 2 key questions:
👉 are yields simply a function of the total outstanding debts ?
👉 what would need to happen for debts to get lower overall, is it even possible?
In the end of the day, remember, somebodies debt is somebodies else asset …
👍 Bonus charts
US Energy milestone for that 4th of July!
👉 US now produces more energy than it consumes, and for the 1st time in > 60 years
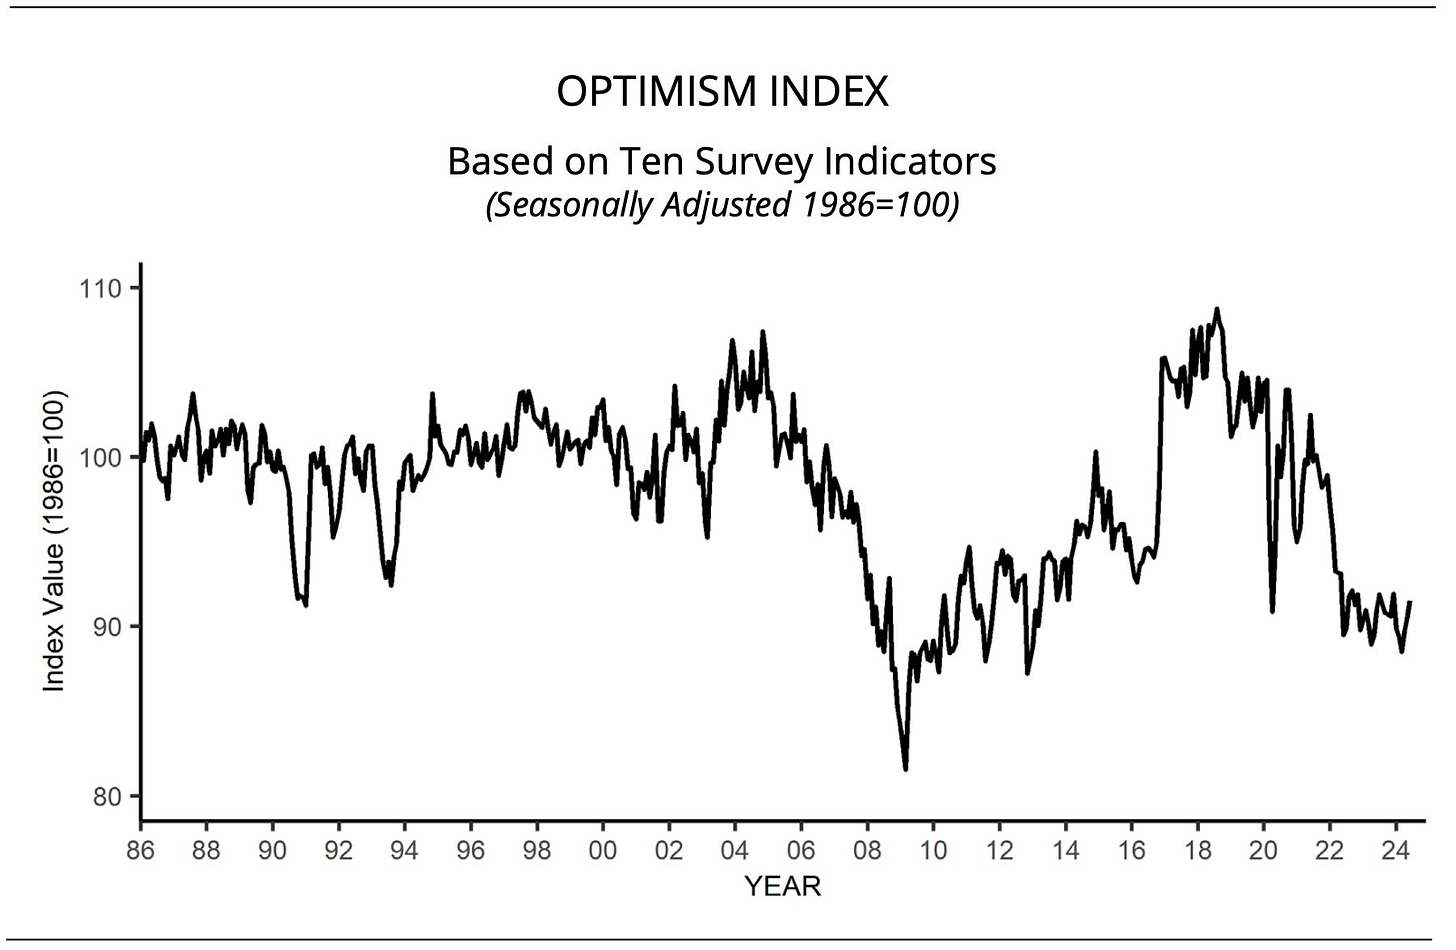
How is sentiment among small businesses baby?
👉 NFIB Small Business Optimism Index reached the highest read of the year in June
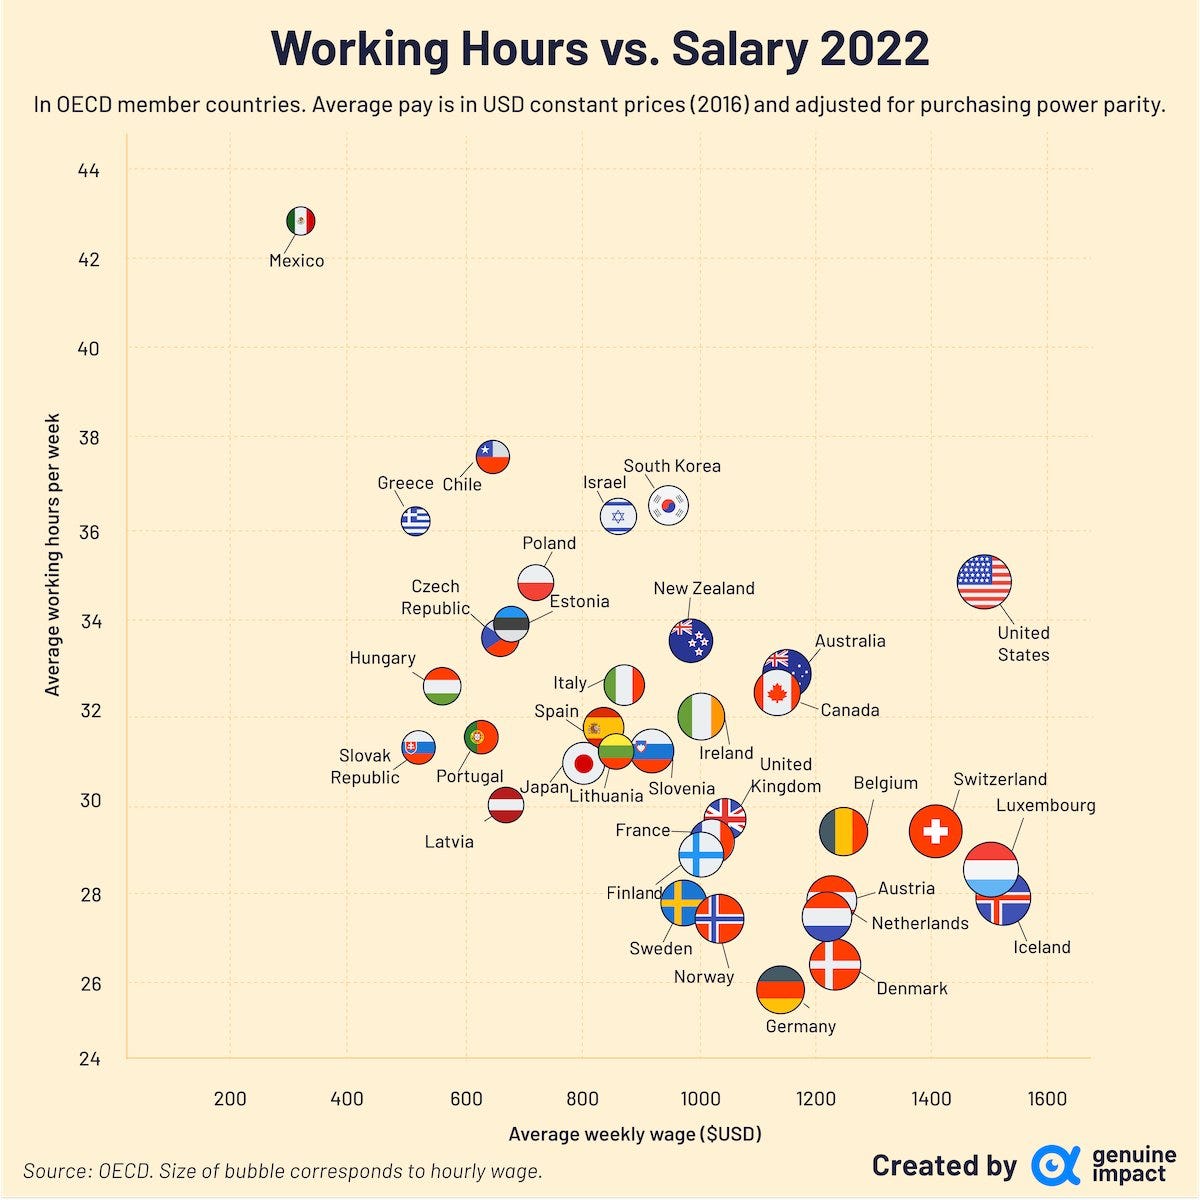
Hours Worked vs Salaries in OECD Countries
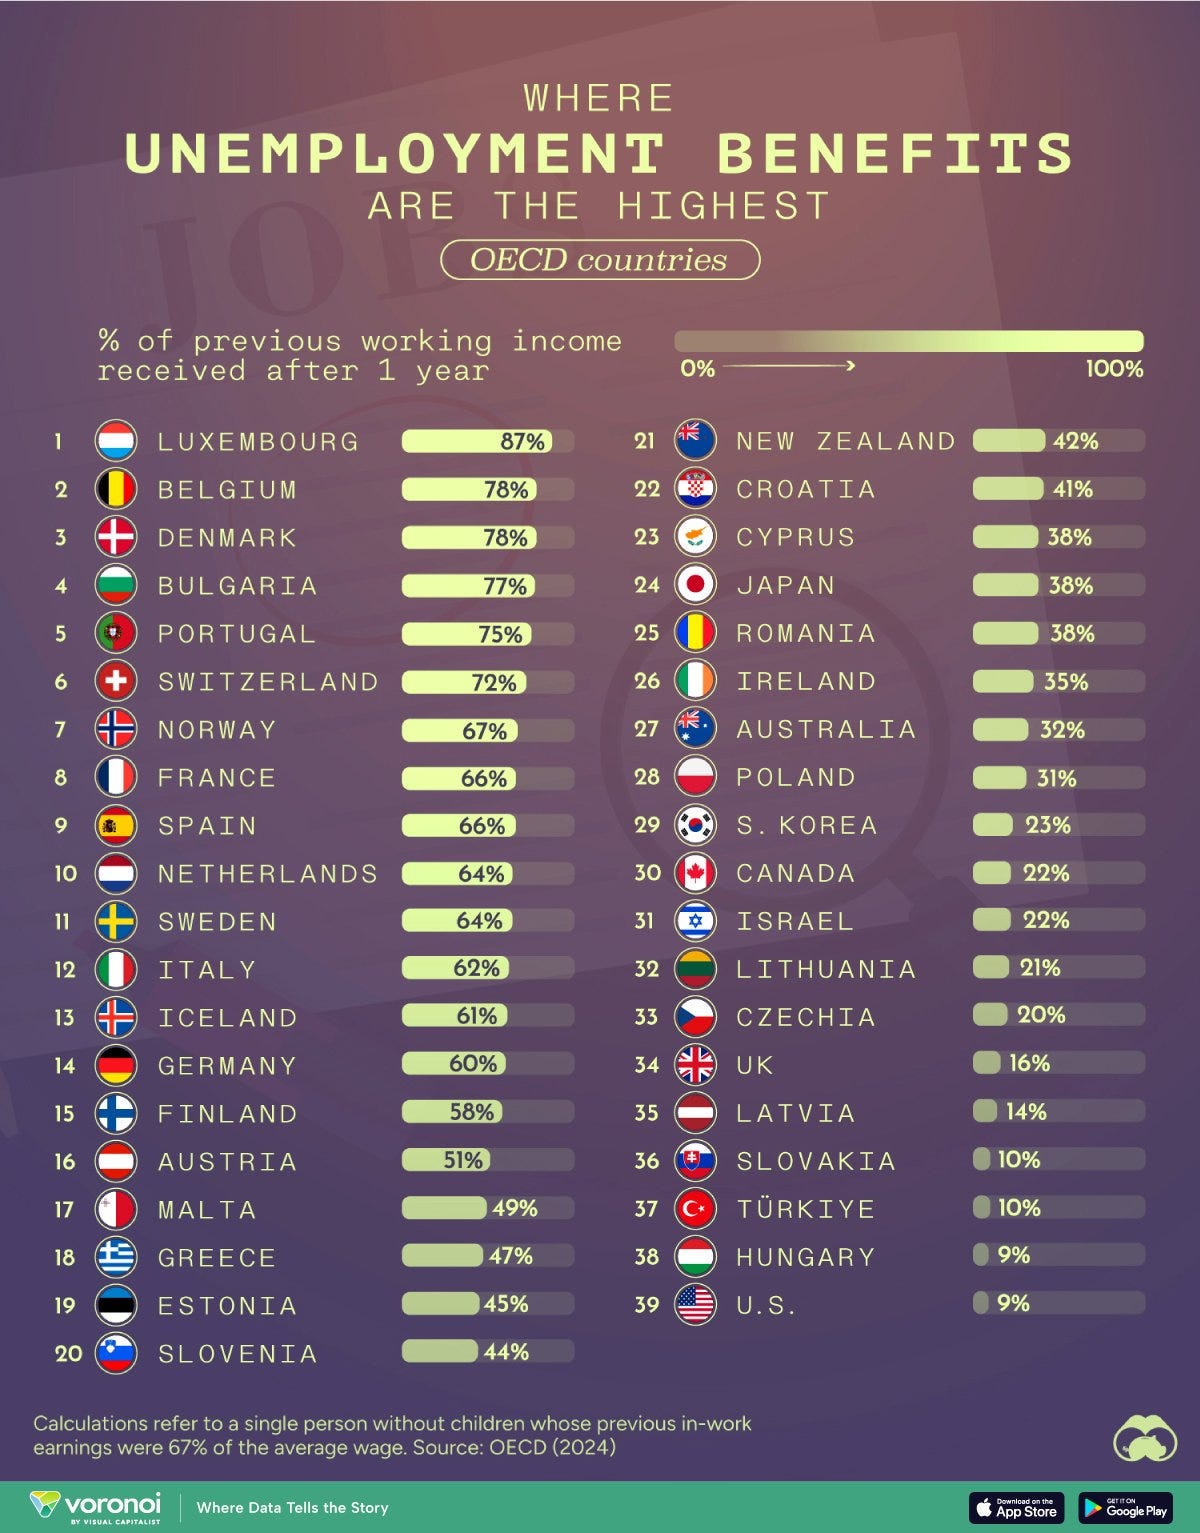
Where Unemployment Benefits are the Highest in OECD Countries?
A sleek message to end the monthly wrap-up, key reminder on consistency. If you:
Research is NOT behind a paywall and NO pesky ads here unlike most other places!
Did you enjoy this extensive research by finding it interesting, saving you time & getting valuable insights? What would be appreciated?
Just sharing this around with like-minded people, and hitting the 🔄 & ❤️ buttons! That’ll definitely support bringing in more & more independent investment research: from a single individual … not a bank, fund, click-baity media or so … !
Have a great summer!
Mav 👋 🤝

















love the monthly chart storm, the cherry picked key highlights, skipping the bla bla bla spam, thanks!
Thank you !