✍️ Maverick Charts & Markets - May 2024 Edition #18
Revenge Shopping, FED Balance Sheet, Defense Spending, Stocks Allocation, Nvidia, Sentiment, Value & Growth, EM & US, US & Europe, Cocoa, Olive Oil, Bonds TLT, USD/JPY, GDP per capita, Wages and Taxes
Dear all,
first of all, great news! The Substack team decided to have my publication featured within their ecosystem after handpicking it from the many out there! Sleek badge also!
Secondly, welcome to the 2,000+ new readers for a total of 8,757! The independent investment research here is now read across 150 countries and 49 US states! Enjoy!
Now there you go with May’s 25 charts + bonus that I carefully cherry picked for you as these monthly wrap ups are done so that many can connect the dots across markets!
Delivery is in typical Maverick fashion, via charts that say 10,000 words covering Macro, Stocks, Bonds & More which also naturally connects the Geopolitics dots.
Research is NOT behind a paywall and NO pesky ads here unlike most other places!
What would be appreciated?
Just sharing this around with like-minded people, and hitting the 🔄 & ❤️ buttons! That’ll definitely support bringing in more & more independent investment research!
From the world of Macro
Advance Retail Sales since 2000 - Never Bet Against The American Consumer!
👉 the 2020 pandemic meant a dip given the overall stop, but check that rebound which not many at all did expect … while my fun and simplistic analogy would be:
'If humans engage in revenge s*x, why not engaging properly in revenge shopping 😇?' Mav
P.S. not sure about my behavioural economics analogy, but yeah, you got it …😉
US Federal Reserve's balance
👉 the FED has shed ~$1.75 trillion since the peak in April 2022 … back at the mid 2020 pandemic times and
👉 with the current drawdown at -19%, it is heading lower from here most likely
US Defense Spending and Interest on its Debt
👉 let this one sink in: the cost of servicing US government debt (interest on debt) is on course to surpass defense spending …
US & China alternative data, you wouldn’t guess my pick: electricity generation!
👉 the Chinese growth has been off the charts, almost literally … which tells us that China's real economy is huge!
N.B.✍️ The State of the US Economy in 45 Charts, Edition #3 went live this weekend, hence in case you missed it, check it out: a very comprehensive and thoughtful report!
From the world of Stocks
S&P 500 Fun fact: +13% in 2024 and all those juicy gains came in just 10 trading days out just 112 ... let that sink in! And trust me, day traders quite surely did miss more than half out of those 10 days!.
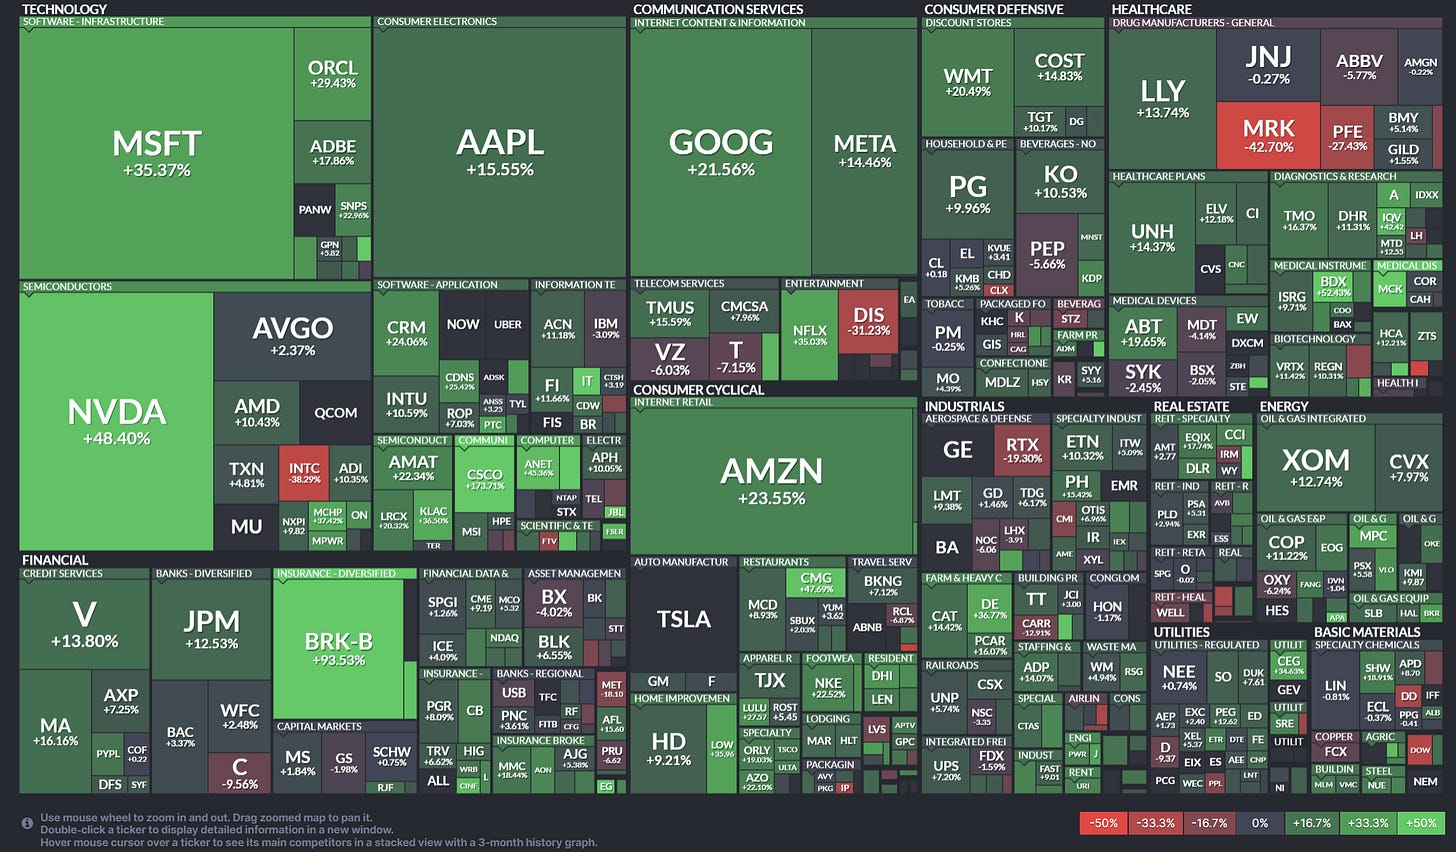
S&P 500 returns in 2024 (chart 1) and EPS growth for the past 5 years (chart 2) via the biggest single names in the 11 sectors and the 24 industries
👉 great returns via very solid earnings growth ...
👉 spot the positive and negative outliers + your top names ... and connect the dots ...
👉 which ones jump to you, you own and/or find interesting? ... food for thought ...
N.B. in case you missed my S&P 500 two distinct deep dives reports, there you go:
✍️ S&P 500 Report: Performance, Profitability, Sentiment & More - #Ed 5
✍️ S&P 500 Report: Valuation, Earnings & Fundamentals + Special Metrics #Ed 5
Institutional vs Retail allocation to stocks! Both going higher, institutional catching up to retail after 2022 was quite a scare when the belief was that a recession coming to town is a sure thing ... which never came ...
👉 Q1: have retail investors internalised for a solid portfolio and let it work without touching it too much? Because it's like soap, the more you the touch, the more it drops in value ...
👉 Q2: do retail investors have actually 'Diamond Hands' while institutionals 'Paper Hands' ?
7 & 8. Twitter Economic Sentiment GS Index & Consumer Sentiment (chart 1) with the S&P 500 drawdowns since 2018 (chart 2)
👉 Twitter going parabolic lately: did disconnect materially also before the 2022 bear market, went way more negative during Covid: so, FinTwit overshoots & undershoots?
👉 2nd chart: the S&P 500 drawdown ... and see if ... 'it's a match' ... like on Tinder …
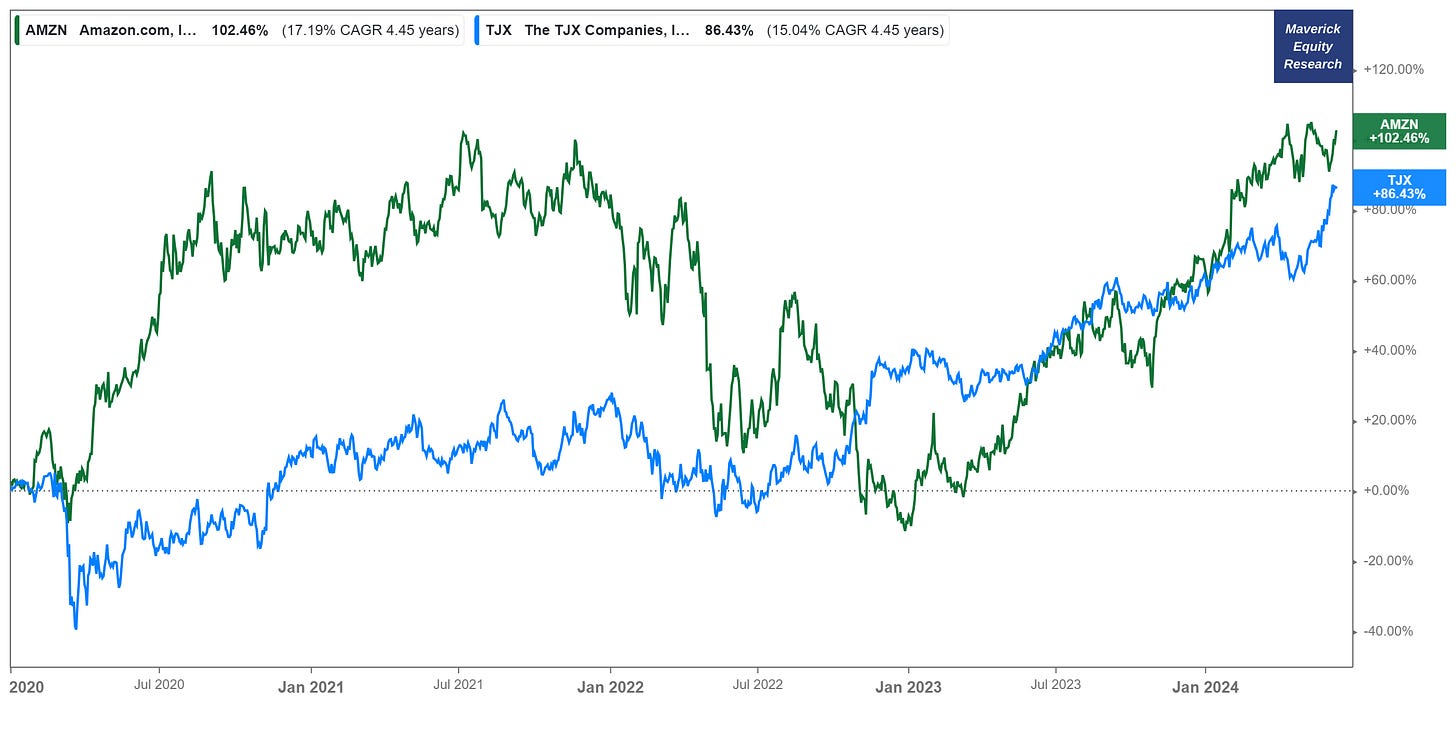
Retail: Amazon (AMZN) & TJX Companies (TJX) return since 2020: 102% and 86%!
Complementary, Retail Sales: e-commerce retail sales as % of total sales
👉 the trend has been clear since the advent of the internet, but check that big increase since the 2020 pandemic …
👉 retail e-commerce at 15.6% of total sales, capturing market share more and more, it will be very hard or close to impossible for this trend to reverse
Love and Interest Rates - Match.com / Match Group (MTCH)
👉 stock is down 72% since the IPO - is love an interest rates phenomenon? ...
+99% in the last 3 years, guess who is that? Boring oily ‘old economy’ Shell (SHEL) that is rarely talked about … yet, 3x more returns than the S&P 500 …
It’s Snapchat time, meaning Snap Inc (SNAP): revenues (green), stock-based compensation (orange) and net income (red):
👉 a serious question: is this company run by Executives for the benefit of Executives?
👉 I get that big 2017 net income loss via loads of stock-based compensation for executives after the IPO … but what about after?
👉 despite growing revenues very very well … losses keep coming, but no problem to issue SBC for the insiders … not a single profitable quarter …
Top 10 companies as % of the S&P 500 market cap since 1990!
👉 2000 = Dotcom bubble …
👉 2020 = Covid pandemic …
👉 2024 = Nowadays, AI days via Nvidia, Microsoft, Apple, Google/Alphabet, Meta/Facebook … and check also Berkshire, Elli Lilly, JP Morgan and Broadcom
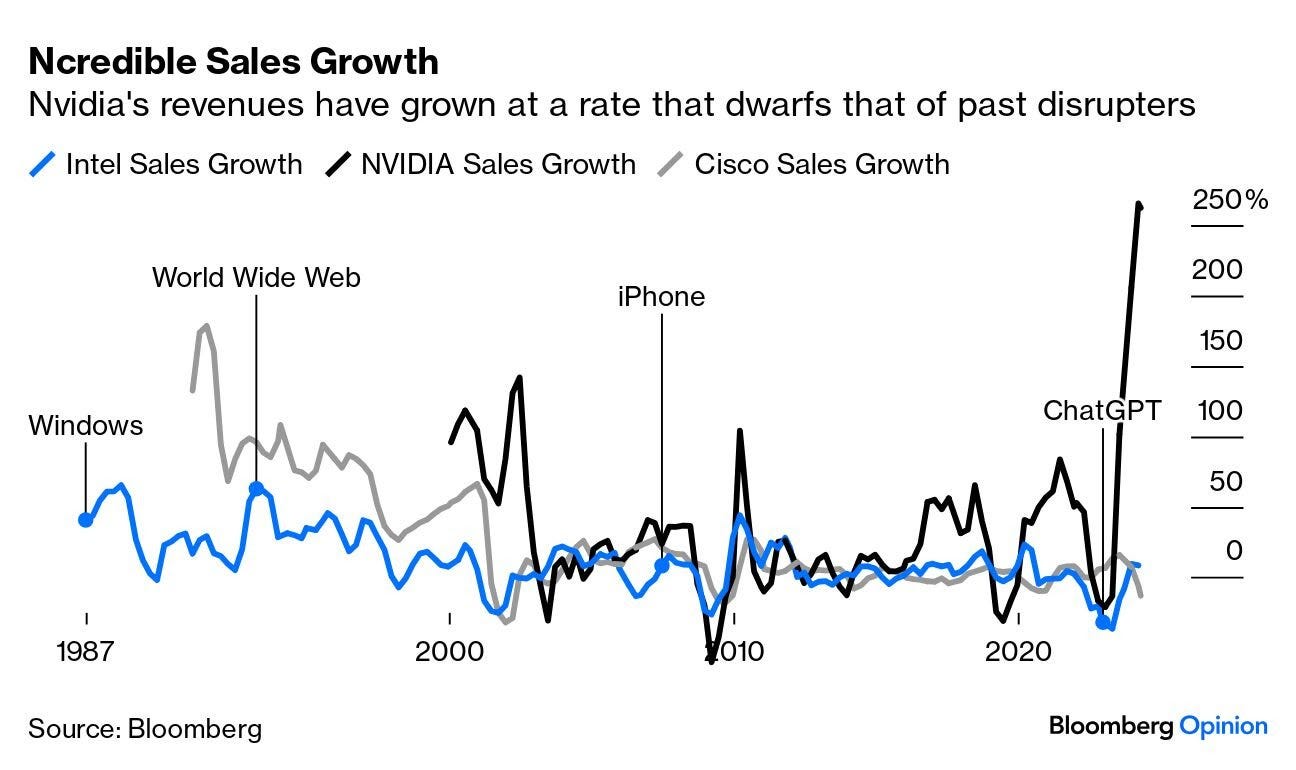
15, 16, 17. Nvidia’s revenues have grown at a rate that dwarfs that of past disruptors
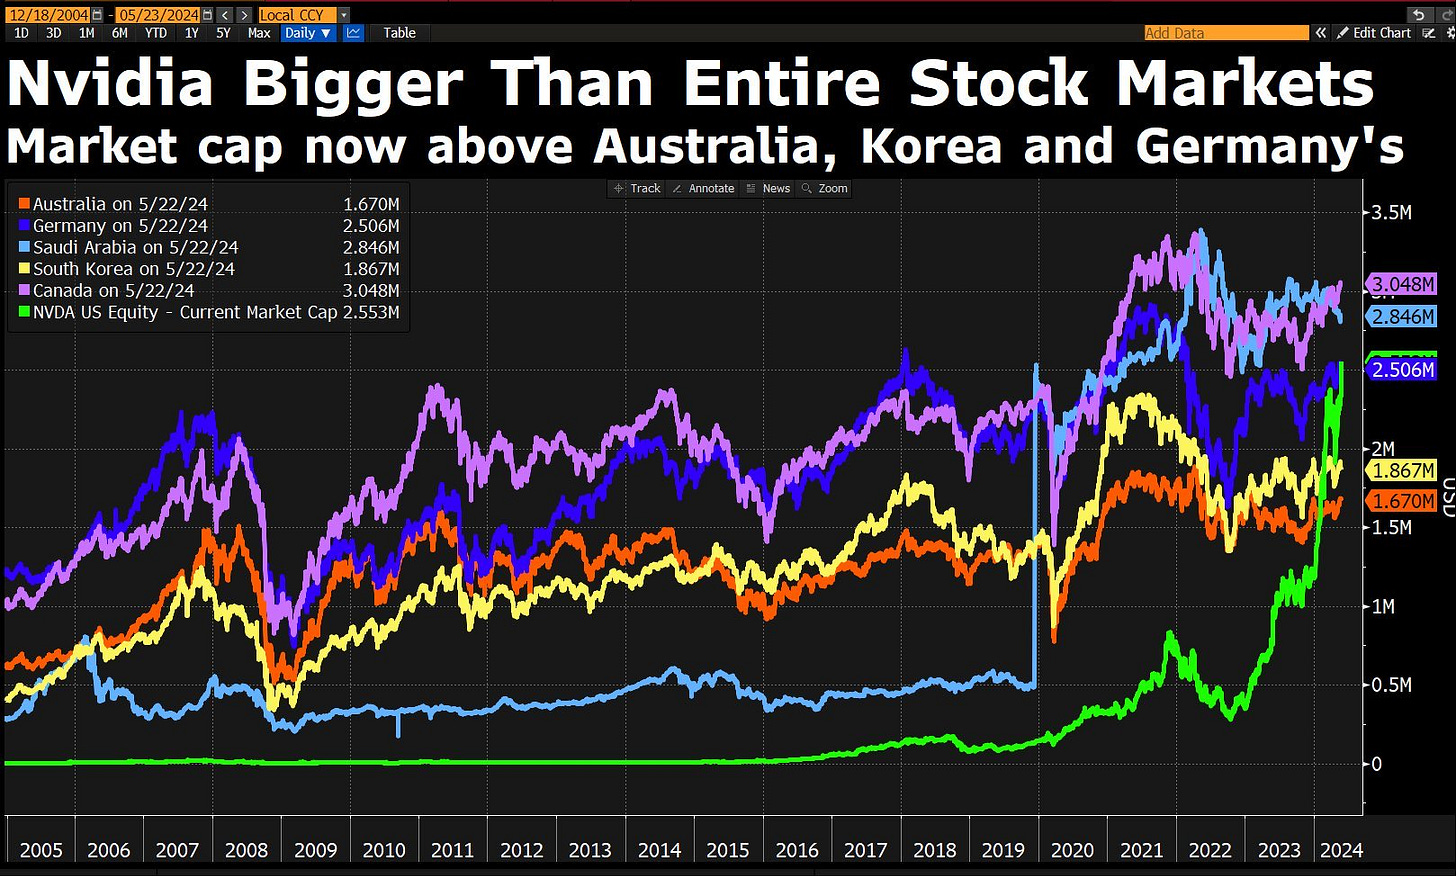
And Nvidia’s market capitalisation is now bigger than entire stock markets:
Nvidia's Data Center market share : from 15% to 80% in 5 years is a great feat, yet it also tells us there is not much more to capture, no?
Value stocks on the cheap side compared to Growth
👉 relative valuation dropped to levels rarely seen in the past 2 decades
Emerging Markets (EM) Equities at 50-year lows relative to US equities
👉 can this trend reverse? what would make this trend reverse? Food for thought …
European Stocks relative to US Stocks (via the ratio Stoxx 600 and S&P 500)
👉 what is going on here really? Is it about ‘working hard’ vs ‘holidays’ mindset? Is it about living for working or working for living? I ask because:
👉 Norway’s oil fund head Nicolai Tangen finds US investments more attractive due to weaker regulations & more risk-taking, and also added that he thinks Europeans are ‘less hard-working’ than Americans: “There’s a mindset issue in terms of acceptance of mistakes and risks. You go bust in America, you get another chance. In Europe, you’re dead,” he said, adding that there was also a difference in “the general level of ambition. We are not very ambitious. I should be careful about talking about work-life balance, but the Americans just work harder.”
Maverick’s take as I worked in both US and Europe (6 EU countries, East to West):
👉 the above is quite valid, but mostly for Western Europe … trust me, Eastern Europe works way harder than both US and Western Europe, especially for what they get for the work … there it’s about survival, not about fancy holidays and 30+ holidays/year …
👉 one issue for Europeans working less harder than Americans are incentives/taxes: why bother busting your a*s when taxes are very high and meritocracy is way less than in US … when the state and the CEO’s and Boards fraternities take most of the cake, why go the extra mile, push and fight for the leftovers? So I kind of get it …
👉 always exceptions, but on balance: when young, motivated and into moving mountains, US is rather the place to be … while for later in life when chilling more, Europe the place to be … or how a buddy says: US is to make money, Europe to spend it
Moreover, start-up / risk taking culture is way less in Europe relative to the US where the entrepreneurial spirit is alive and kicking + a pay it forward mentality!
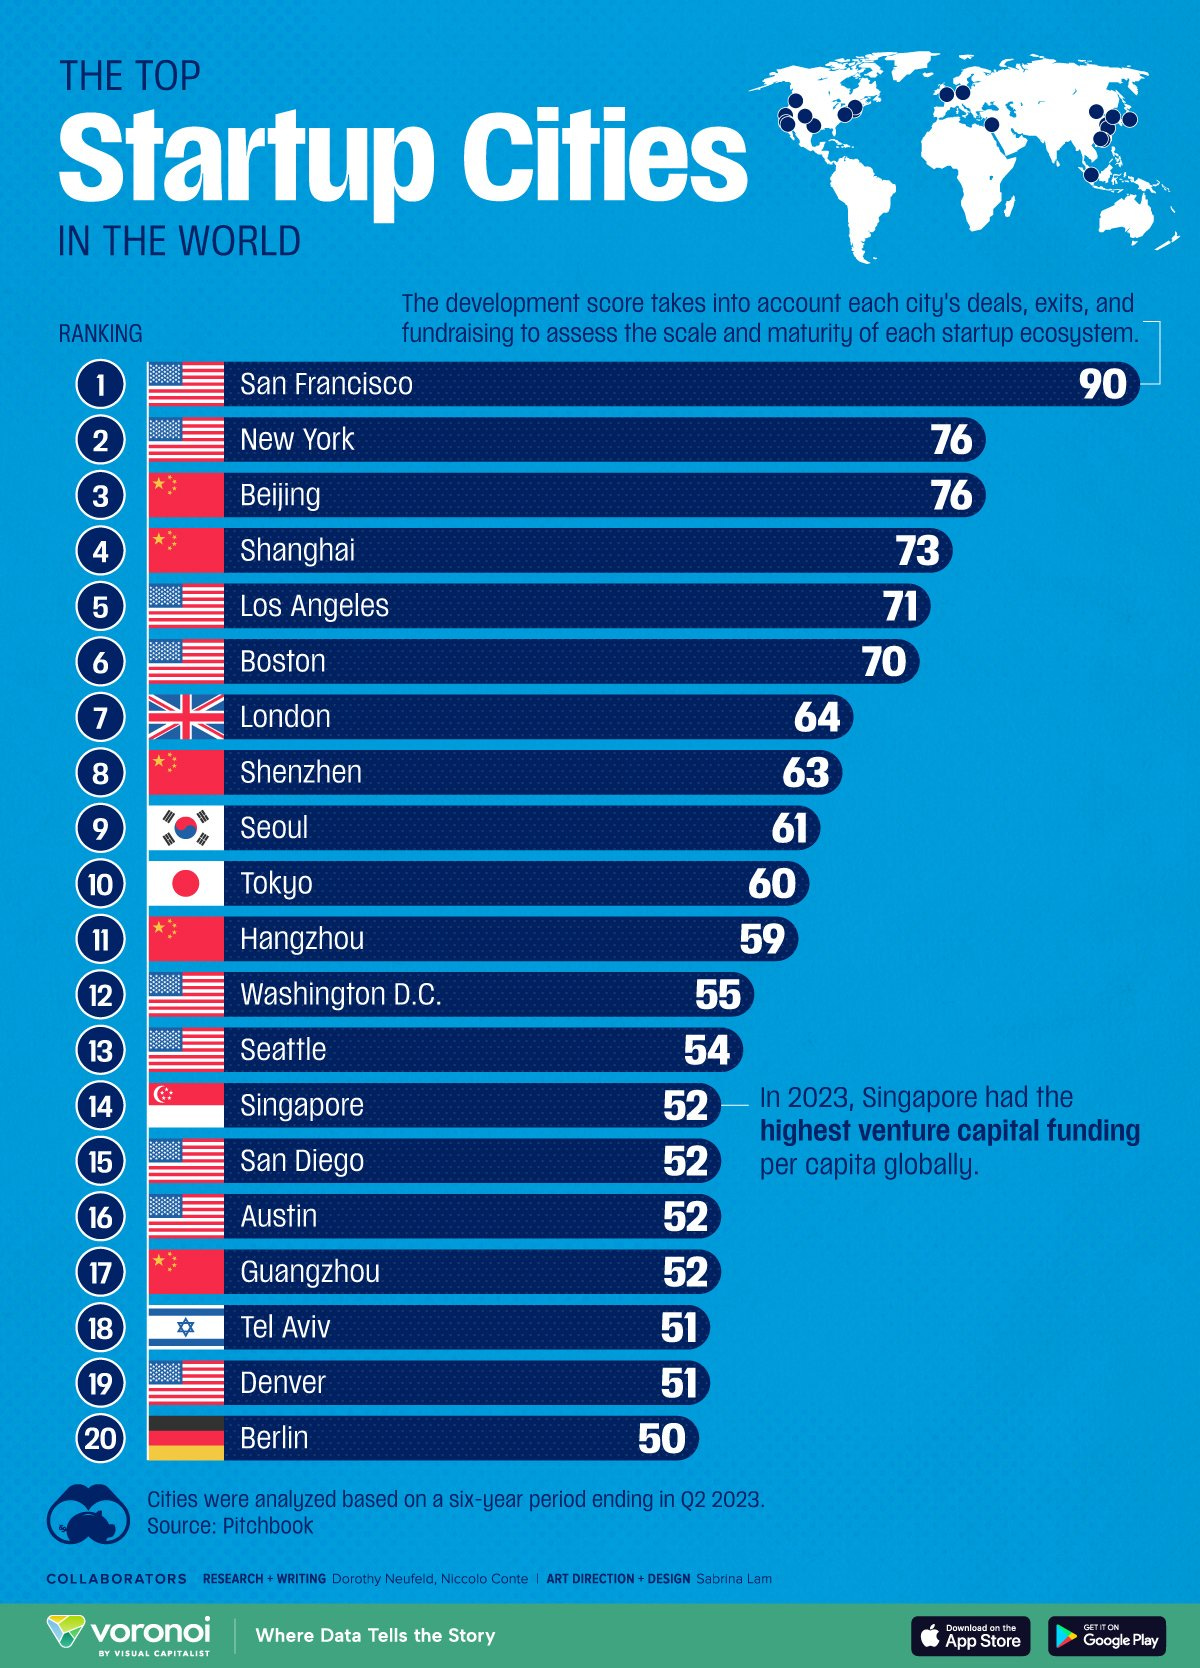
Just check the Top startup cities around the world: lot of US, not much Europe
From the world of Bonds/Cash/Credit
TLT 20+ year treasuries (green), cumulative flows (blue) & FED funds rate (red)
👉 as the FED funds rate did increase massively to combat inflation, long dated bonds got hammered on and on … yet see the crazy increasingly flows into the ETF the more interest rates grew … which is very strange and I did not expect
👉 I did expect such an increase in flows rather these, yet flows stabilised now … and that because TLT is an investment with the idea that rate cuts are incoming, hence price will rebound strongly … as peak interest rates are here rather sooner than later
N.B. my 2-part research series on Investing in Bonds/Cash/Credit in case you missed it
✍️ My name is Bond, Yield Bond! The Return of Yield! Getting Paid to Chill ... (Part I)
✍️ My name is Bond, Yield Bond! The Return of Yield! T-Bill & Chill ... T-Bond & Long (Part II)
From the world of Commodities
You like Cocoa? After blating to even above 12,000 per tonne in April 2024, Cocoa bubbly prices finally coming down to 8,219 per tonne
You might heard the cocoa prices skyrocketing, but what about Olive oil?
Since 2021 it has doubled … and would be nice if it’s bubbly price falls like Cocoa …
Real Assets and their return since 2000: Farmland has been farming really well
From the world of FX
USD/JPY: the Yen to a 34-year low against the USD in 2024, let that one sink in!
👍 Bonus charts - GDP/capita, Wages and Taxes edition!
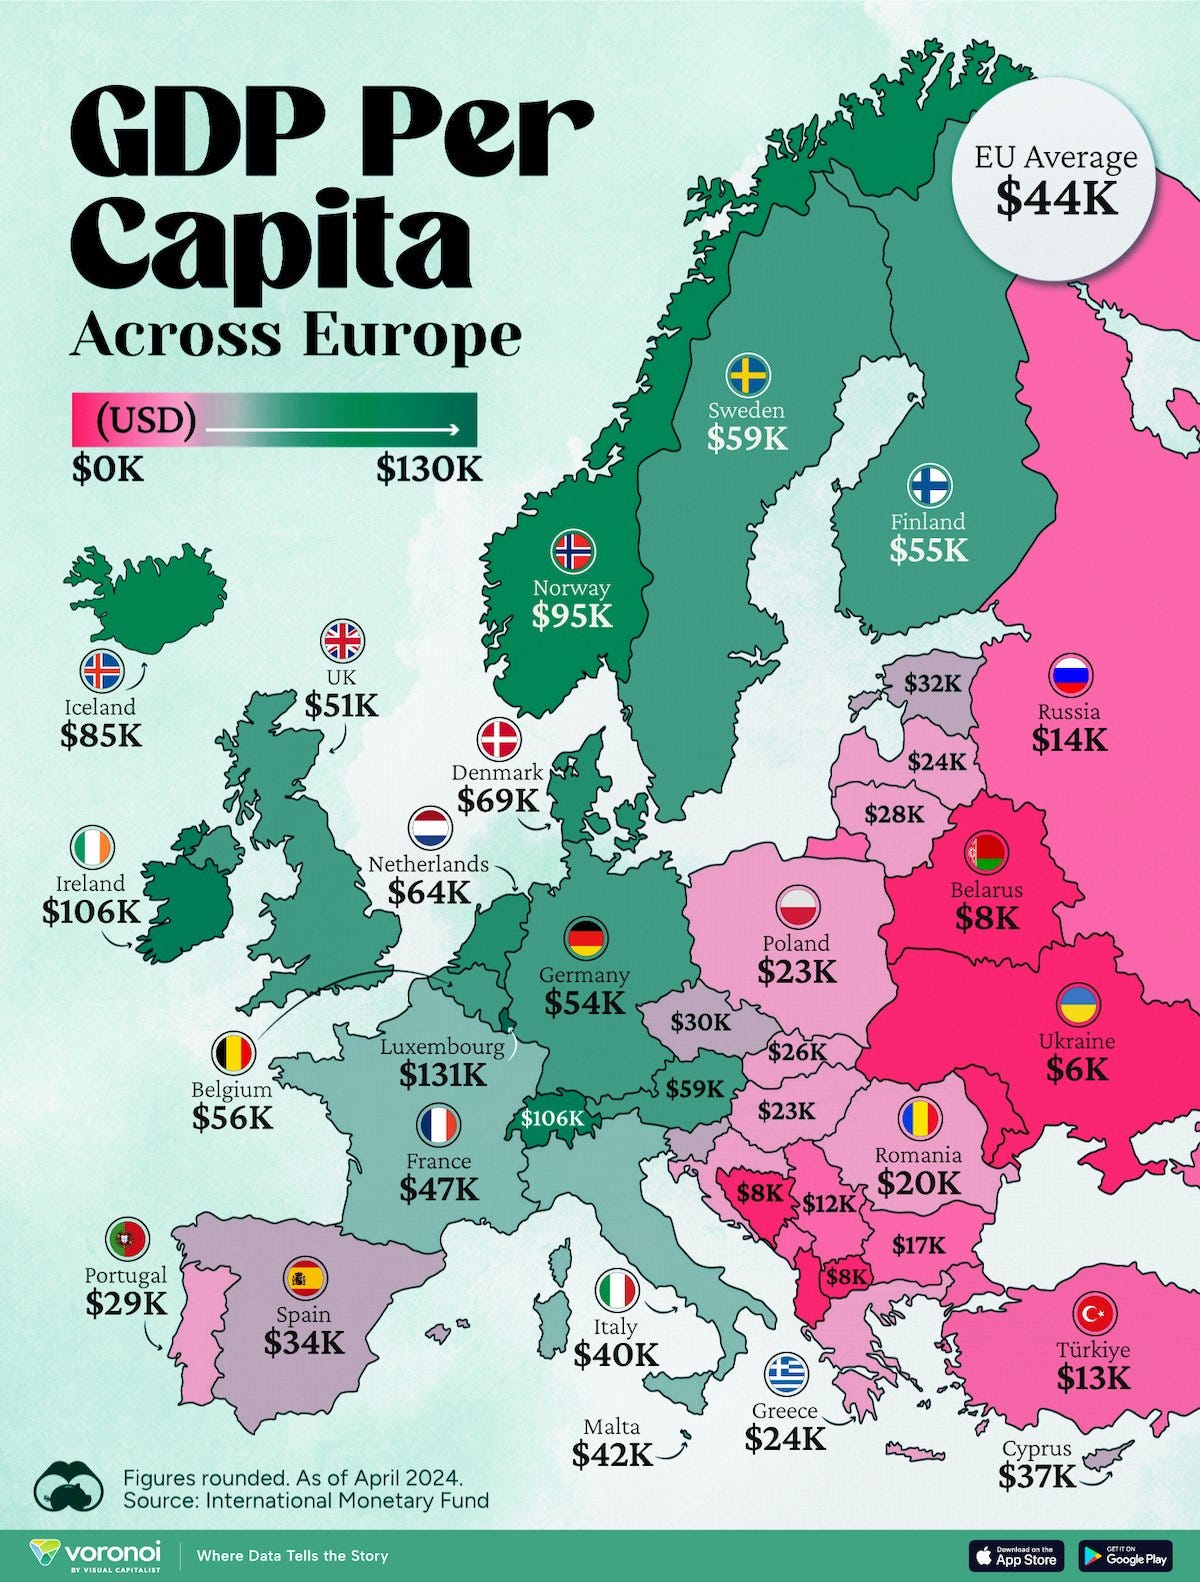
Europe’s GDP Per Capita by Country, let's get visual!
👉 Europe is home to some of the largest and most sophisticated economies in the world. But how do countries in the region compare with each other on a per capita productivity basis?
👉 GDP per capita levels across 44 nations in current U.S. dollars, updated April 2024
P.S. I lived in 7 of them ... from financially 'poor' east to 'rich' west, from communism to rather more capitalism … to rather more social welfare states ... GDP/capita not a perfect metric, but it matches my 'single person' ... 'observational study' …
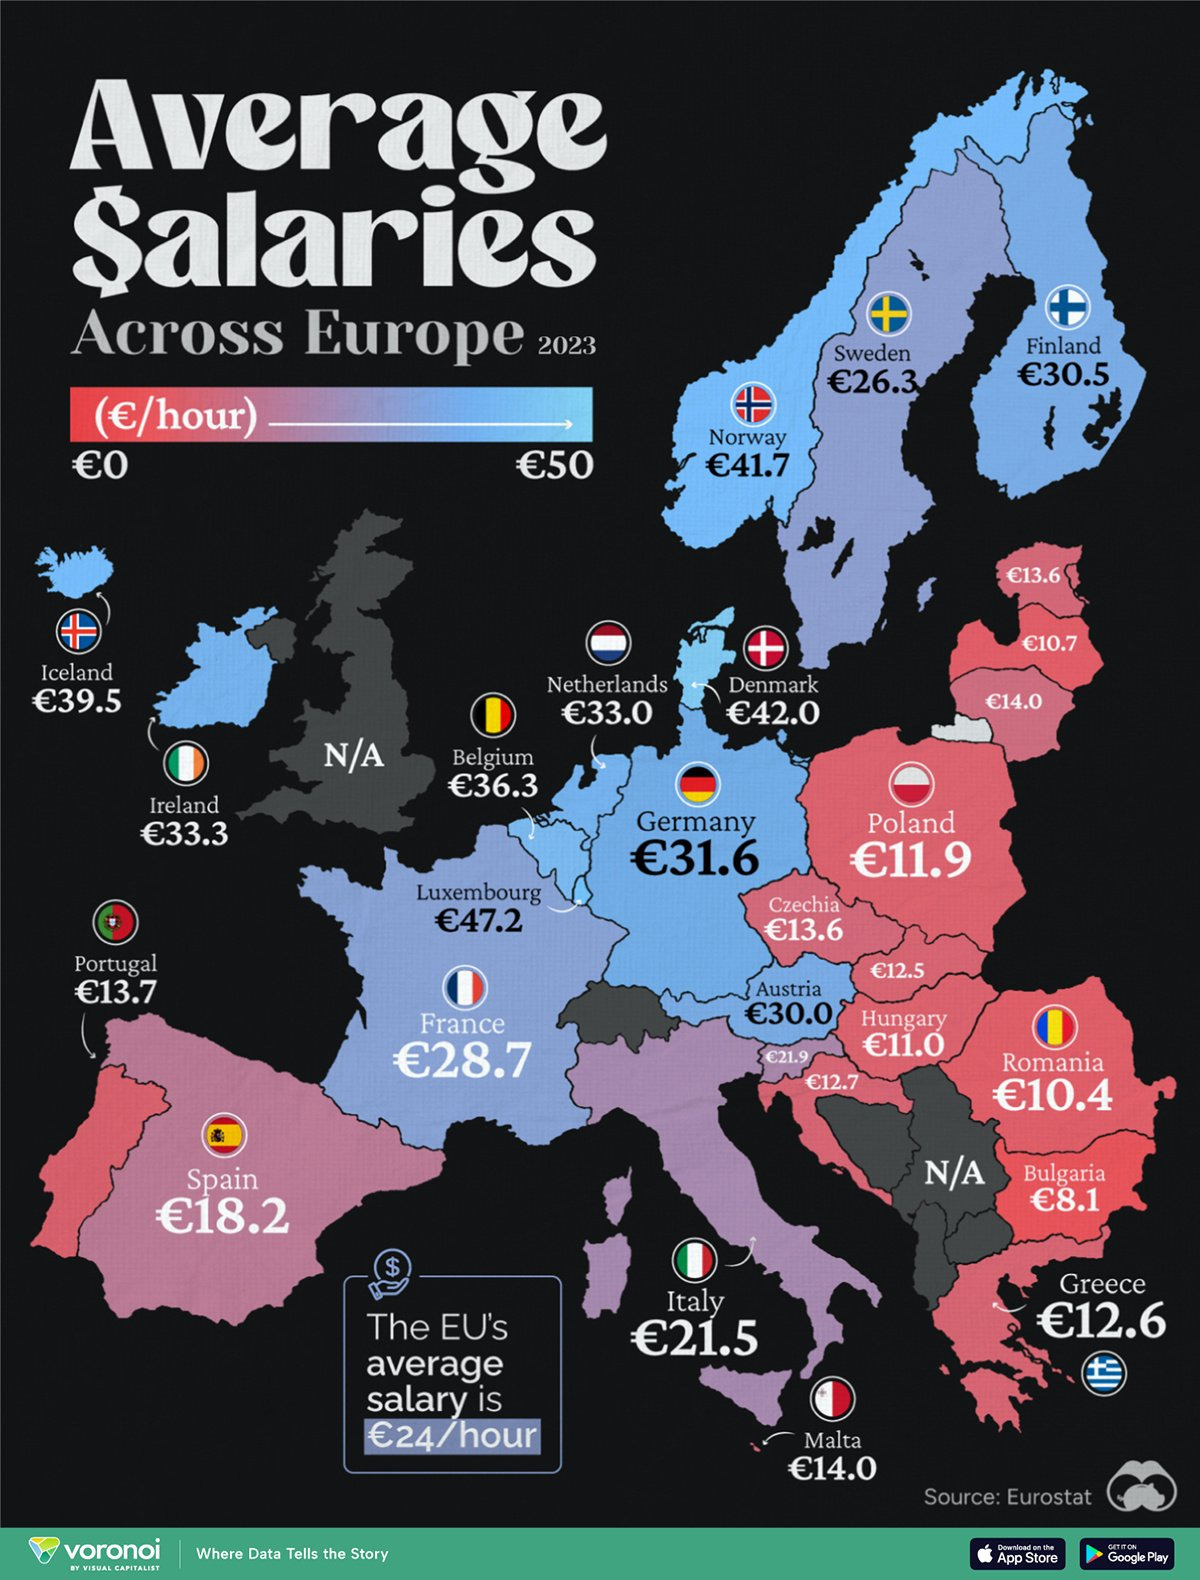
Average Wages Across Europe (data comes from Eurostat is current up to 2023)
👉 the bluer the country, the higher the hourly salary
👉 Luxembourg, Europe’s financial services capital, has the highest average salary (€47/hour) across the continent. The country also has the highest per capita GDP in the world
👉 Scandinavia’s Denmark and Norway also pay higher (€42/hour) though Sweden (€26/hour) falls more in the middle of the pack
Complementary, Europe via personal income tax rates: from 9% to 58% ....
Visualizing the Tax Burden of Every U.S. State in 2024
It’s important to understand that under this methodology, the tax burden measures the percent of an average person’s income that is paid towards state and local taxes. It considers property taxes, income taxes, and sales & excise tax.
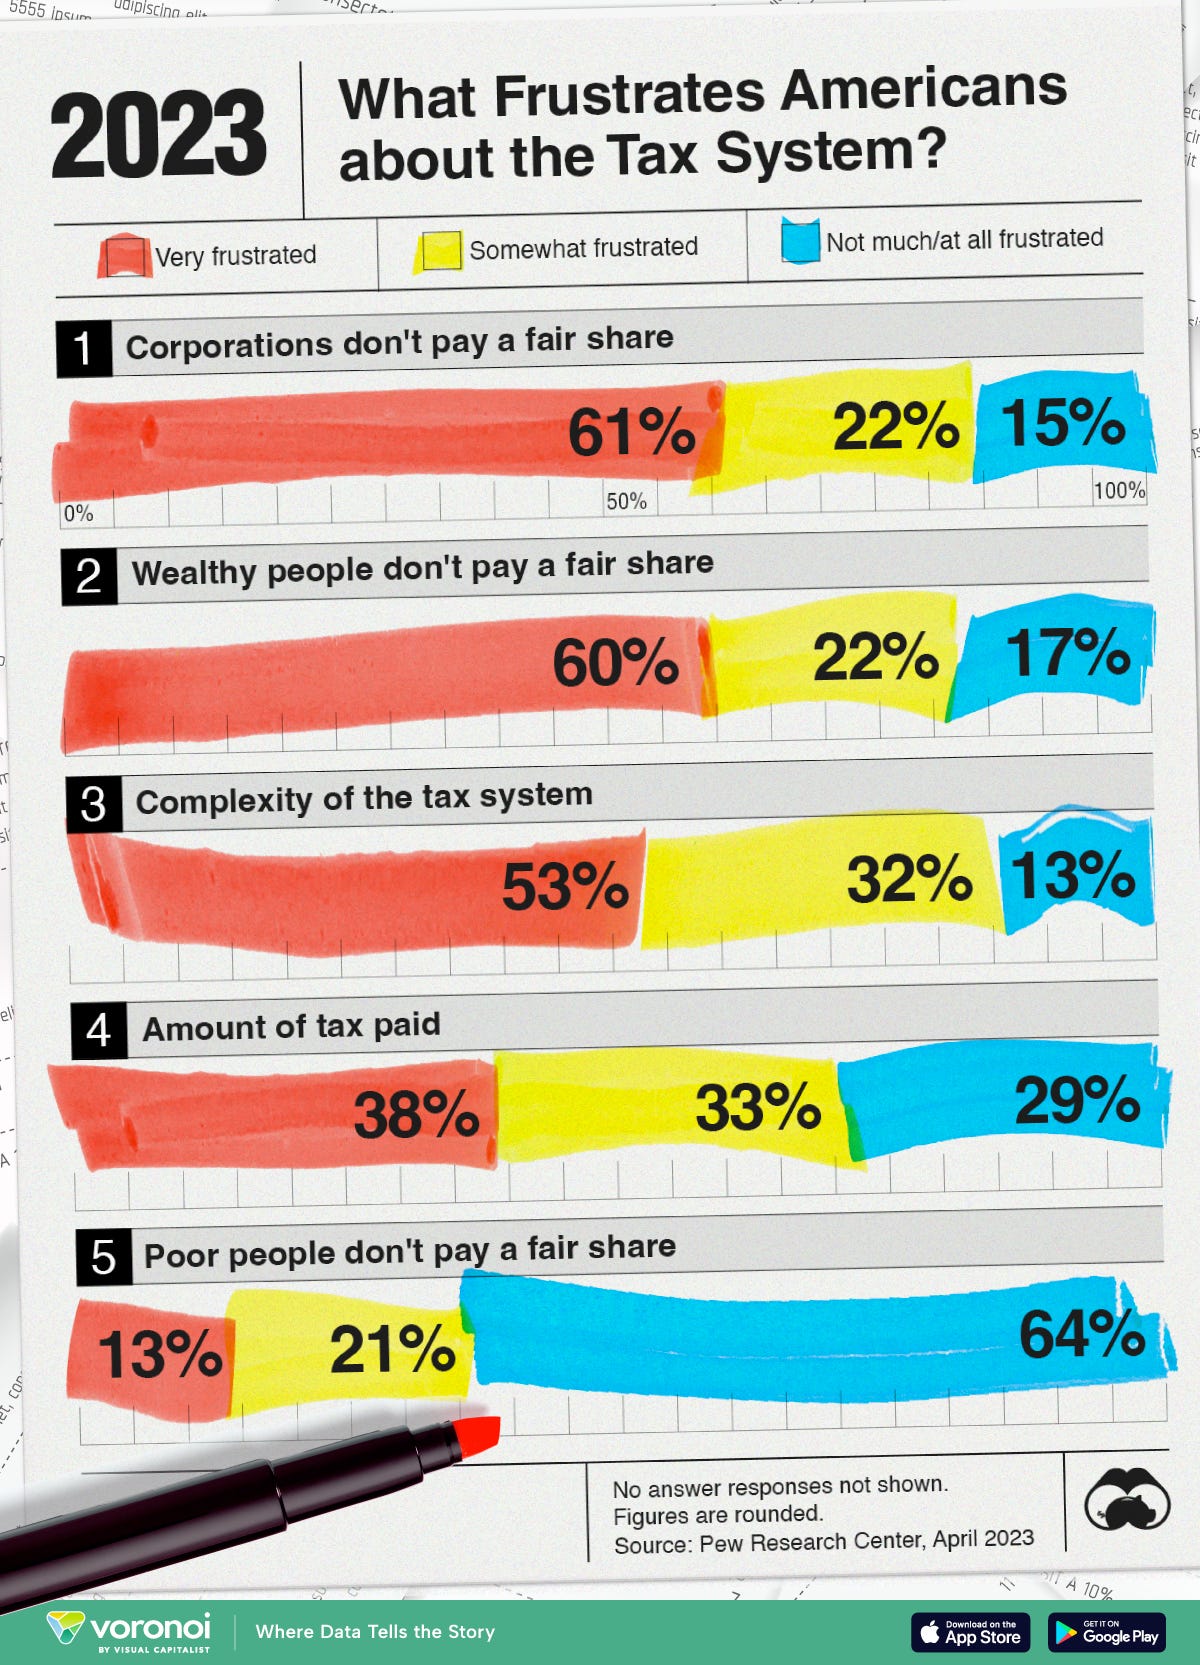
What Frustrates Americans About the Tax System
Which States Have the Highest Minimum Wage in America?
This year, 22 states are raising their minimum wage, impacting almost 10 million workers across the country
Last but not least, the quotes of the month are coming from the one and only, Buffett!
"Tell me who your heroes are and I’ll tell you how you’ll turn out to be." and "Predicting rain doesn't count, building the ark does."
Research is NOT behind a paywall and NO pesky ads here unlike most other places!
Did you enjoy this extensive research by finding it interesting, saving you time & getting valuable insights? What would be appreciated?
Just sharing this around with like-minded people, and hitting the 🔄 & ❤️ buttons! That’ll definitely support bringing in more & more independent investment research: from a single individual … not a bank, fund, click-baity media or so … !
Have a great day!
Mav 👋 🤝













I love the detail Maverick! As for emerging markets, with the expectation that oil production will be at a surplus by 2030 (I think IEA or an organization like that made the prediction), cheap energy will be what makes emerging market equities more attractive than US equities.
Also, the surge in electricity output in China compared to America, I agree with your point on how the real economy of China is much larger than the US. And the continued rise in electricity output in China reminded me of how dirt cheap Chinese equities are.
A truly broad overview with enough granularity to interest readers all over the world. Thank you!